The Landings of Westerville
Nursing Home · Westerville, OH
CMS overall rating Info The Overall CMS Rating is scored from 1 to 5 stars and combines results from health inspections, staffing levels, and quality measures. Health inspections carry the most weight. Staffing and quality scores can increase or decrease the final rating based on performance compared to state and national standards.

The Landings of Westerville

Nursing Home · Westerville, OH
CMS overall rating Info The Overall CMS Rating is scored from 1 to 5 stars and combines results from health inspections, staffing levels, and quality measures. Health inspections carry the most weight. Staffing and quality scores can increase or decrease the final rating based on performance compared to state and national standards.
Calculator: See prices in your area
The Landings of Westerville accepts Medicare, Medicaid, and private pay.

Overview of The Landings of Westerville

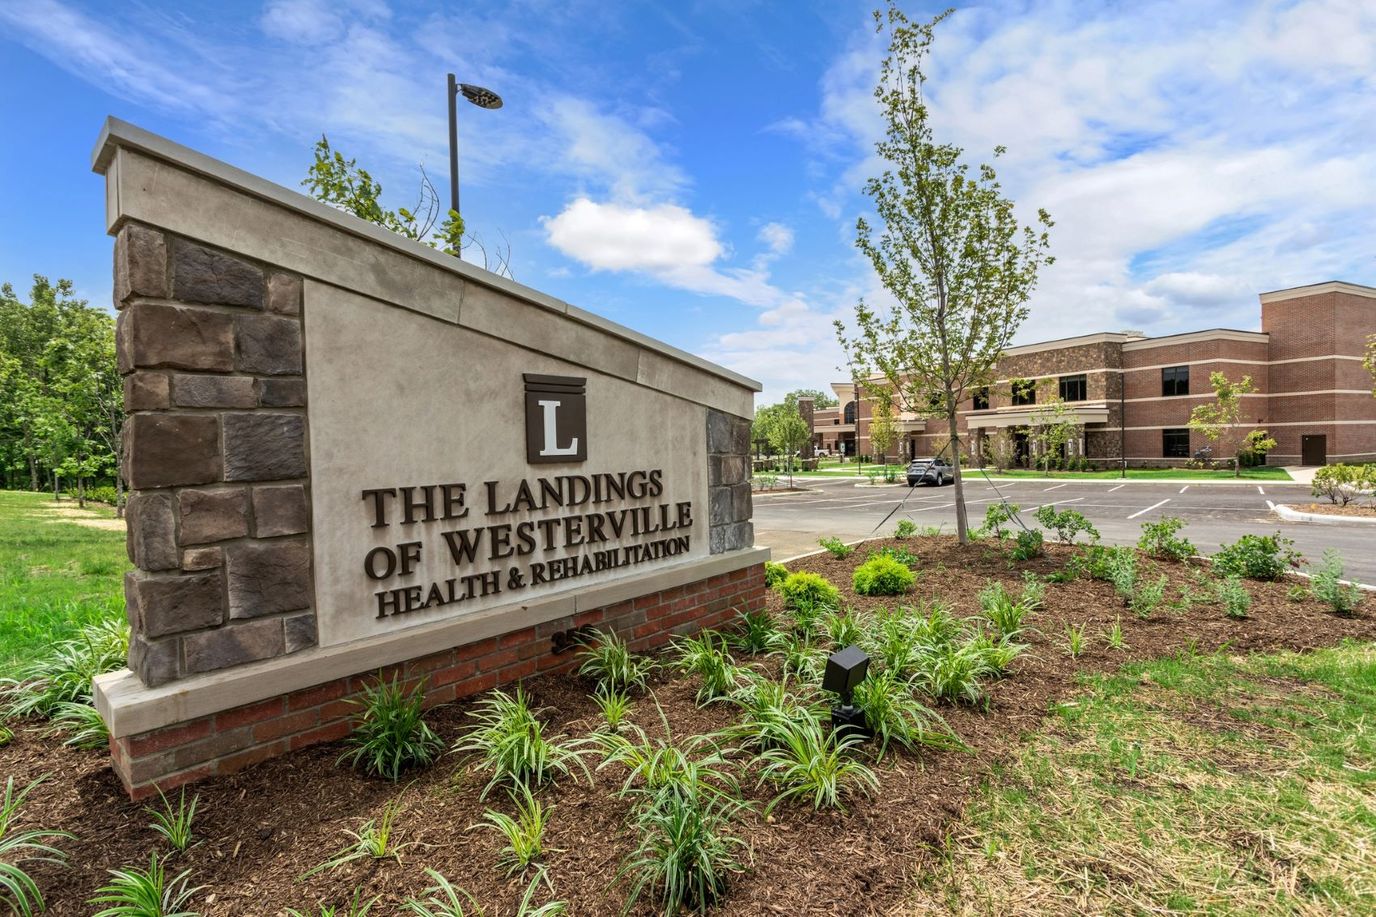
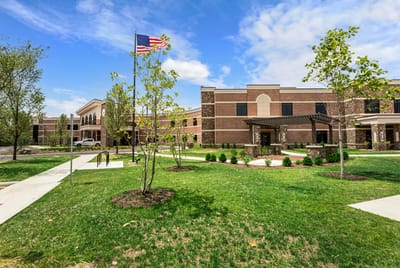
The Landings of Westerville, located in Westerville, Ohio, is a trusted skilled nursing center that offers exceptional care and support to residents. With private rooms and a capacity of 120 beds, this assisted living and nursing home community prioritizes healing, comfort, and an enhanced quality of life. Their services include short-term nursing care, rehabilitation services, and comprehensive ventilator care. By providing a nurturing environment and treating residents as part of their extended family, The Landings of Westerville ensures a compassionate and supportive experience.
At The Landings of Westerville, their dedicated team understands the unique needs of each resident and is committed to fostering their recovery journey. With a personalized approach to care, they prioritize both physical and emotional well-being, creating a true sense of belonging. Residents can expect exceptional care, genuine compassion, and the opportunity to thrive within a supportive community.

(614) 942-6700

Quality ratings

Measured by Centers for Medicare & Medicaid Services (CMS)

Overall rating Info The Overall CMS Rating combines results from health inspections, staffing levels and quality measures. Health inspections carry the most weight. Staffing and quality scores can increase or decrease the final rating based on performance compared to state and national standards.
▲ 57.1% Above OH avg. ▲ 57.1% Above OH avg.Click the badge to see the full State ranking.Click here to see the full State ranking.
Health Inspection Info Based on the results of the facility's three most recent standard inspections and any complaint investigations. CMS reviews the number, scope, and severity of deficiencies, with more recent findings weighted more heavily.
▲ 42.8% Above OH avg. ▲ 42.8% Above OH avg.Click the badge to see the full State ranking.Click here to see the full State ranking.
Staffing Info Measures average nursing staff hours per resident per day, including Registered Nurses (RNs) and total nursing staff. Ratings are adjusted based on the level of care residents require and are compared to state and national benchmarks.
▼ 18.1% Below OH avg. ▼ 18.1% Below OH avg.Click the badge to see the full State ranking.Click here to see the full State ranking.
Quality Measures Info Based on clinical and physical health indicators reported to CMS, such as hospital readmissions, falls, pressure ulcers, and improvements in mobility. These measures reflect how well residents' health needs are being managed.
▲ 14.7% Above OH avg. ▲ 14.7% Above OH avg.Click the badge to see the full State ranking.Click here to see the full State ranking.

Staffing hours breakdown

Info Daily nursing hours per resident by staff type, reported to CMS. Higher is generally better — compare this facility to state and national averages to see where staffing stands.

Hours per resident per day — compared to Ohio state averages

Total nursing care / resident Info Total adjusted nursing hours per resident per day, combining RN, LPN, and aide time. CMS adjusts this for case-mix so facilities can be fairly compared.
2h 53m per day
This facility Ohio avg (3h 32m per day)
vs Ohio avg
-18%
Staff typeHours / Day / Residentvs state avg
Total Nursing (Weekend) Info Combined nursing hours (RN + LPN + Nurse Aide) per resident per day on weekends. Staffing often drops on weekends — this figure reveals whether the facility maintains adequate coverage outside of weekday hours. 3h 48m per day

Capacity and availability

This home usually has limited availability

Occupancy between 85% and 95% suggests balanced demand.

Higher occupancy than the Ohio average: 78.7%
Occupancy rate 89.2%
Avg. Length of Stay 105 days
Occupancy rate
89.2%
Avg. Length of Stay
105 days

Who this home usually serves

TYPE OF STAY

Mix of rehab and long-term care

This home supports both short-term rehab and long-term care, with residents staying for a wide range of durations.

Breakdown by payment type

Medicare

40% of new residents, usually for short-term rehab.

Typical stay 1 months

Private pay

55% of new residents, often for short stays.

Typical stay 3 - 4 months

Medicaid

5% of new residents, often for long-term daily care.

Typical stay 1 - 2 years

Finances and operations

Privately-owned community
Operated by a business corporation.
Home revenue
$16.3M
Profit
$3.2M
Privately-owned community Operated by a business corporation.
Home revenue
$16.3M
Profit
$3.2M
Payroll costs Info The portion of the home's budget spent on staff, including nurses, caregivers, and other employees who support care and operations.
$9.4M
57.3% of revenue
Other operating costs Info All remaining costs needed to run the home, such as food, utilities, building maintenance, supplies and administrative expenses.
$3.7M
Total costs $13.1M
Walk Score
Walk Score: 28 / 100
Somewhat walkable. A few nearby services may be reachable on foot, but most trips require transportation.

About this community

Payment & Insurance

1 service
Accept Medicare

Therapy & Rehabilitation

2 services
Rehabilitation Services
Respite Care

Staffing & Medical

2 services
Doctor on Staff
24-Hour Staffing

Amenities & Lifestyle

In-House Salon
Fine Dining
Wellness Therapies
Outdoor Activities
ActivitiesA variety of activities including fitness classes, arts and crafts, social events, and outings are available.
Specific ProgramsVentilator Care, Physical Therapy, Occupational Therapy, Speech Therapy

Dining & Nutrition

Food DescriptionFine dining available with meals served in a communal setting.

Contact The Landings of Westerville

Health Inspection History

Inspections Since 2024
Total health inspections 3

Ohio average 6.7


Last Health inspection on Sep 2025

Total health citations
7

Ohio average 30.9

Citations per inspection
2.33

Ohio average 4.59


Health citations are formal notices following inspections when they fail to comply with safety and care standards.

4 of 7 citations resulted from standard inspections; and 3 of 7 resulted from complaint investigations.

Breakdown of citation severity (last 2 years)
Critical Health citations
0
100% better than Ohio average

Ohio average: 0.3


Serious Health citations
1
11% worse than Ohio average

Ohio average: 0.9

0 critical citations Ohio average: 0.3

1 serious citation Ohio average: 0.9

6 moderate citations Ohio average: 29

0 minor citations Ohio average: 0.7
Citations history (last 2 years)
Quality of Care moderate citation Sep 02, 2025
Corrected

Resident Rights moderate citation Sep 02, 2025
Corrected

Pharmacy moderate citation Mar 13, 2025
Corrected

Quality of Care moderate citation Mar 13, 2025
Corrected

Financial Assistance for
Nursing Home in Ohio

The Landings of Westerville is located in Westerville, Ohio.
Here are the financial assistance programs available to residents in Ohio.

Get Financial aid guidance

PASSPORT Waiver

Ohio Medicaid PASSPORT

Age 60+
General Ohio resident, Medicaid-eligible, nursing home-level care need.
Income Limits (2025) ~$2,829/month 300% FBR, individual
Asset Limits $2,000 (individual), $3,000 (couple).
OH

Administered through regional agencies; waitlists possible.

Benefits
Personal care (5-7 hours/day) Respite (240 hours/year) Adult day care ($65/day) Home modifications ($1,500 avg.)

Ohio Home Care Program (non-Medicaid)

OH HCP

Age 60+
General Ohio resident, at risk of decline.
Income Limits ~$2,000/month individual, varies
Asset Limits $5,000 individual
OH

Limited funding; regional variation.

Benefits
In-home care (3-5 hours/week) Respite (up to 10 days/year) Transportation (~5 trips/month)

Assisted Living Waiver (ALW)

Ohio Assisted Living Waiver

Age 21+ (65+ prioritized)
General OH resident, Medicaid-eligible, NFLOC.
Income Limits (2025) ~$2,829/month (individual); QIT required.
Asset Limits $2,000 (individual), $3,000 (couple).
OH

Covers ~300 facilities; room/board not included (separate cost).

Benefits
Personal care Meals Medication management Transportation (~$3,000-$4,000/month value)

Program of All-Inclusive Care for the Elderly (PACE)

Ohio PACE (e.g., McGregor PACE)

Age 55+
General OH resident (specific counties), NFLOC, safe with PACE support.
Income Limits (2025) ~$2,829/month (Medicaid-eligible); private pay option available.
Asset Limits $2,000 (individual), $3,000 (couple) for Medicaid enrollees.
OH

Available in 9 counties (e.g., Cuyahoga, Franklin); expanding via Healthy Aging Grants.

Benefits
Personal care (5-7 hours/day) Medical care Meals Transportation Respite Therapies

Medicare Savings Program (MSP)

Ohio Medicare Savings Program

Age 65+ or disabled
General OH resident, Medicare Part A/B.
Income Limits (2025) ~$2,510/month (QMB), ~$3,380/month (SLMB), ~$3,598/month (QI)—individual.
Asset Limits $9,430 (individual), $14,130 (couple).
OH

Three tiers; includes Extra Help for Part D; no waitlist.

Benefits
Covers Part B premiums ($174.70/month) Deductibles ($240/year) Copays (~20%)

Home Energy Assistance Program (HEAP)

Ohio HEAP

Age 60+ prioritized
General OH resident, low-income household.
Income Limits (2025) ~$3,970/month individual, 185% FPL
Asset Limits Not assessed; income-focused.
OH

Covers gas, electric, oil; emergency aid via Winter/Summer Crisis Programs.

Benefits
Heating/cooling aid ($300-$1,000/season) Emergency aid ($500 max)

Family Caregiver Support Program (FCSP)

Ohio Family Caregiver Support Program

Age
General Caregivers of 60+ needing care or 55+ caregivers of others; OH resident; functional needs (2+ ADLs).
Income Limits (2025) Prioritizes ~$24,980/year (individual); no strict cap.
Asset Limits Not assessed; need-based.
OH

12 AAAs; rural/low-income priority; volunteer respite option.

Benefits
Respite (4-6 hours/week or 5 days/year) Adult day care ($60/day) Training Supplies (~$500/year)

VA Aid and Attendance (A&A) and Housebound Benefits

Ohio VA Aid and Attendance/Housebound

Age 65+ or disabled veteran/spouse
General OH resident, wartime service, need for ADL help (A&A) or homebound.
Income Limits (2025) Net income < ~$1,984/month (veteran with dependent, A&A); pension offsets income.
Asset Limits ~$155,356 net worth limit
OH

High veteran demand; supports care in multiple settings.

Benefits
Cash (~$1,433-$2,642/month veteran, ~$951-$1,318 spouse) for care costs (e.g., in-home, assisted living)

Homestead Exemption

Ohio Homestead Exemption

Age 65+ (or disabled)
General OH resident, homeowner, low-income.
Income Limits (2025) ~$38,500/year individual, adjusted annually
Asset Limits Not assessed; home ownership required.
OH

Reduces taxable value by $25,000; applies to primary residence.

Benefits
Tax reduction (~$400-$800/year avg., varies by county)

Save the Dream Ohio (Homeowner Assistance Fund)

Ohio Save the Dream

Age 60+ prioritized
General OH resident, homeowner, hardship post-Jan 21, 2020.
Income Limits (2025) ~$147,600/year family of 4, 150% AMI; varies by county
Asset Limits Not assessed; hardship-focused.
OH

Covers delinquent mortgages, utilities, taxes; max $25,000 mortgage aid.

Benefits
Mortgage aid ($25,000 max) Utility/property tax aid ($5,000 avg.)

Staffing Data

Reporting period: April 1 – June 30, 2025 (Q2 2025). Source: CMS Payroll-Based Journal report.

Total staff 196
Employees 154
Contractors 42
Staff to resident ratio 1.73:1
19% worse than Ohio average
Ohio average ratio: 2.14:1 Ohio average ratio: 2.14:1See full Ohio ranking
Avg staff/day 55
Average shift 10.3 hours
27% better than Ohio average
Ohio average: 8.1 hours Ohio average shift: 8.1 hoursSee full Ohio ranking
Total staff hours (quarter) 51,485

Nursing staff breakdown

Q2 2025 · Apr 1 – Jun 30 More info This data comes from the CMS Payroll-Based Journal report covering April 1 – June 30, 2025.
Registered Nurse

Manages medical care and health needs.

Total count 21
Average shift length Info Average shift length. Calculated as total hours divided by days worked and average staff per day. 11.9 hours

No contractors work on this role.

Licensed Practical Nurse

Assists with medical care and medications.

Total count 30
Average shift length Info Average shift length. Calculated as total hours divided by days worked and average staff per day. 11.8 hours

No contractors work on this role.

Certified Nursing Assistant

Helps with daily care and mobility.

Total count 73
Average shift length Info Average shift length. Calculated as total hours divided by days worked and average staff per day. 11.4 hours

No contractors work on this role.

Contractor staffing

Q2 2025 · Apr 1 – Jun 30 More info This data comes from the CMS Payroll-Based Journal report covering April 1 – June 30, 2025.

Total hours from contractors

6.1%

3,146 contractor hours this quarter

Qualified Social Worker: 12 Speech Language Pathologist: 8 Physical Therapy Aide: 8 Physical Therapy Assistant: 7 Respiratory Therapy Technician: 5 Medical Director: 1 Occupational Therapy Assistant: 1

Staff by category

Q2 2025 · Apr 1 – Jun 30 More info This data comes from the CMS Payroll-Based Journal report covering April 1 – June 30, 2025.
Certified Nursing Assistant7307324,75191100%11.4
Licensed Practical Nurse300307,82791100%11.8
Registered Nurse210217,40491100%11.9
RN Director of Nursing5052,0226571%8.4
Clinical Nurse Specialist5051,4446571%8.1
Qualified Activities Professional7071,0506673%12.1
Speech Language Pathologist0889907886%6.3
Physical Therapy Aide0887877987%6
Other Dietary Services Staff3036767684%6.4
Dietitian1015837380%8
Occupational Therapy Aide4045816268%7.9
Respiratory Therapy Technician0555277582%7
Administrator1015126470%8
Dental Services Staff1015117077%7.3
Mental Health Service Worker1014806066%8
Nurse Practitioner1014645864%8
Physical Therapy Assistant0774547178%5.7
Qualified Social Worker012123207178%3.8
Nurse Aide in Training1013633%12
Occupational Therapy Assistant0113678%5.1
Medical Director0113367%5.5
73 Certified Nursing Assistant
% of Days 100%
30 Licensed Practical Nurse
% of Days 100%
21 Registered Nurse
% of Days 100%
5 RN Director of Nursing
% of Days 71%
5 Clinical Nurse Specialist
% of Days 71%
7 Qualified Activities Professional
% of Days 73%
8 Speech Language Pathologist
% of Days 86%
8 Physical Therapy Aide
% of Days 87%
3 Other Dietary Services Staff
% of Days 84%
1 Dietitian
% of Days 80%
4 Occupational Therapy Aide
% of Days 68%
5 Respiratory Therapy Technician
% of Days 82%
1 Administrator
% of Days 70%
1 Dental Services Staff
% of Days 77%
1 Mental Health Service Worker
% of Days 66%
1 Nurse Practitioner
% of Days 64%
7 Physical Therapy Assistant
% of Days 78%
12 Qualified Social Worker
% of Days 78%
1 Nurse Aide in Training
% of Days 3%
1 Occupational Therapy Assistant
% of Days 8%
1 Medical Director
% of Days 7%

Facility Characteristics

Source: CMS Long-Term Care Facility Characteristics (Data as of Jan 2026)

Total residents 113
Medicare
11
9.7% of residents
Medicaid
80
70.8% of residents
Private pay or other
22
19.5% of residents
Programs & Services
Residents Group

Residents meet regularly to discuss policies, care quality, and activities

Active Resident Council

Organized group of residents that meets regularly to discuss facility policies, quality of life, and activities.

Quality of care over time

These measures show how residents usually do over time at this home, based on health outcomes and preventive care.

High-risk clinical events score Info A composite score based on pressure ulcers, falls with injury, weight loss, walking ability decline, and activities of daily living decline. 4.2
28% better than Ohio average

Ohio average: 5.8

Functional decline score Info A composite score based on activities of daily living decline, walking ability decline, and incontinence. 8.7
31% better than Ohio average

Ohio average: 12.7

Long-stay resident measures
Need for Help with Daily Activities Increased Info Percent of long-stay residents whose need for help with daily activities has increased 0.4%
94% better than Ohio average

Ohio average: 6.8%

Walking Ability Worsened Info Percent of long-stay residents whose ability to move independently worsened 4.3%
52% better than Ohio average

Ohio average: 8.9%

Low Risk Residents with Bowel/Bladder Incontinence Info Percent of low risk long-stay residents who lose control of their bowels or bladder 21.4%
In line with Ohio average

Ohio average: 22.0%

Falls with Major Injury Info Percent of long-stay residents experiencing one or more falls with major injury 1.1%
68% better than Ohio average

Ohio average: 3.4%

High Risk Residents with Pressure Ulcers Info Percent of long-stay high risk residents with pressure ulcers 7.6%
95% worse than Ohio average

Ohio average: 3.9%

Urinary Tract Infection Info Percent of long-stay residents with a urinary tract infection 0.3%
49% better than Ohio average

Ohio average: 0.5%

Lost Too Much Weight Info Percent of long-stay residents who lose too much weight 7.6%
23% worse than Ohio average

Ohio average: 6.2%

Depressive Symptoms Info Percent of long-stay residents who have depressive symptoms 19.0%
21% better than Ohio average

Ohio average: 24.0%

Antipsychotic Use Info Percent of long-stay residents who received an antipsychotic medication 1.5%
82% better than Ohio average

Ohio average: 8.4%

Pneumococcal Vaccine Info Percent of long-stay residents assessed and appropriately given the pneumococcal vaccine 100.0%
8% better than Ohio average

Ohio average: 92.4%

Influenza Vaccine Info Percent of long-stay residents assessed and appropriately given the seasonal influenza vaccine 100.0%
6% better than Ohio average

Ohio average: 94.5%

Short-stay resident measures
Pneumococcal Vaccine Info Percent of short-stay residents assessed and appropriately given the pneumococcal vaccine 98.4%
26% better than Ohio average

Ohio average: 78.0%

Antipsychotic medication increase Info Percent of short-stay residents who newly received an antipsychotic medication 0.7%
46% better than Ohio average

Ohio average: 1.3%

Influenza Vaccine Info Percent of short-stay residents assessed and appropriately given the seasonal influenza vaccine 97.1%
29% better than Ohio average

Ohio average: 75.6%

Penalties and fines

Federal penalties imposed by CMS for regulatory violations, including civil money penalties (fines) and denials of payment for new Medicare/Medicaid admissions.

Source: CMS Penalties Database

No penalties in the past 3 years

No civil money penalties or payment denials were reported in the last 3 years.

Compare Nursing Home around Westerville

The information below is reported by the Ohio Department of Health, Bureau of Survey and Certification.

4 facilities compared · CMS & OH Dept. of Health data

Filter by care type
Highbanks Care Center
NH

Nursing Home Licensed facility providing 24/7 skilled nursing care for residents with complex, ongoing medical needs. Staffed by RNs, LPNs, and CNAs. Inspected and star-rated annually by CMS. Accepts Medicare (short-term rehab) and Medicaid (long-term care).

AL

Assisted Living A licensed, long-term care setting for seniors or individuals with disabilities who need help with daily activities — like bathing, dressing, and medication management — but not 24-hour skilled nursing. Offers housing, meals, and around-the-clock support while aiming to maximize resident independence.

Westerville56 95.0% +21%2.97 +77%-16%$0205.0-53 57 Zallaca Romero$5.8M$3.0M51.5%366303
The Landings of Westerville
NH

Nursing Home Licensed facility providing 24/7 skilled nursing care for residents with complex, ongoing medical needs. Staffed by RNs, LPNs, and CNAs. Inspected and star-rated annually by CMS. Accepts Medicare (short-term rehab) and Medicaid (long-term care).

AL

Assisted Living A licensed, long-term care setting for seniors or individuals with disabilities who need help with daily activities — like bathing, dressing, and medication management — but not 24-hour skilled nursing. Offers housing, meals, and around-the-clock support while aiming to maximize resident independence.

Westerville120 89.2% +13%2.89 +16%-18%$072.31111 28 Josie Woosley$16.3M$9.4M57.3%366494
Forest Hills Center
NH

Nursing Home Licensed facility providing 24/7 skilled nursing care for residents with complex, ongoing medical needs. Staffed by RNs, LPNs, and CNAs. Inspected and star-rated annually by CMS. Accepts Medicare (short-term rehab) and Medicaid (long-term care).

AL

Assisted Living A licensed, long-term care setting for seniors or individuals with disabilities who need help with daily activities — like bathing, dressing, and medication management — but not 24-hour skilled nursing. Offers housing, meals, and around-the-clock support while aiming to maximize resident independence.

Westerville75 95.2% +21%3.48 -3%-2%$0323.6-73 45 -$8.9M$3.9M43.7%365980
Columbus Colony For Elderly Care
NH

Nursing Home Licensed facility providing 24/7 skilled nursing care for residents with complex, ongoing medical needs. Staffed by RNs, LPNs, and CNAs. Inspected and star-rated annually by CMS. Accepts Medicare (short-term rehab) and Medicaid (long-term care).

AL

Assisted Living A licensed, long-term care setting for seniors or individuals with disabilities who need help with daily activities — like bathing, dressing, and medication management — but not 24-hour skilled nursing. Offers housing, meals, and around-the-clock support while aiming to maximize resident independence.

Westerville110 79.9% +2%3.04 +55%-14%$169.6k559.2573 46 Ohio School For The Deaf Alumni Association$11.3M$5.9M52.5%365421

Guides for Better Senior Living

Care Cost Calculator: See Prices in Your Area

Nursing Home Data Explorer

Don’t Wait Too Long: 7 Red Flag Signs Your Parent Needs Assisted Living Now

The True Cost of Assisted Living in 2025 – And How Families Are Paying For It

Understanding Senior Living Costs: Pricing Models, Discounts & Financial Assistance

Frequently Asked Questions about The Landings of Westerville

Is The Landings of Westerville in a walkable area?

The Landings of Westerville has a walk score of 28. Somewhat walkable. A few nearby services may be reachable on foot, but most trips require transportation.

Are there photos of The Landings of Westerville?

Yes — there are 16 photos of The Landings of Westerville in the photo gallery on this page.

What is the phone number of The Landings of Westerville?

(614) 942-6700 will put you in contact with the team at The Landings of Westerville.

Is The Landings of Westerville Medicare or Medicaid certified?

Yes — The Landings of Westerville is a CMS-certified provider of Medicare and Medicaid.

Explore Open Rooms
1 Contact details
2 What type of senior care service are you looking for?
3 What budget do you have in mind for senior care?
4 How soon do you need to find care?
5 Additional details

Thank you for your interest!

Our team will be in touch shortly to help with next steps.