• Home
  • Nursing Home in Florida
The Lilac at Bayview
Nursing Home & Respite Care · Saint Augustine, FL
CMS overall rating Info CMS (the Centers for Medicare & Medicaid Services) is the federal agency that rates nursing home quality. Its Overall Rating runs from 1 to 5 stars, combining health inspections, staffing, and quality measures, with inspections weighted most heavily.

The Lilac at Bayview

Nursing Home & Respite Care · Saint Augustine, FL
CMS overall rating Info CMS (the Centers for Medicare & Medicaid Services) is the federal agency that rates nursing home quality. Its Overall Rating runs from 1 to 5 stars, combining health inspections, staffing, and quality measures, with inspections weighted most heavily.
Calculator: See prices in your area
The Lilac at Bayview accepts Insurance and/or HMO, Medicaid, Medicare, Veteran Affairs Benefits, Workers Compensation, and private pay.

Overview of The Lilac at Bayview

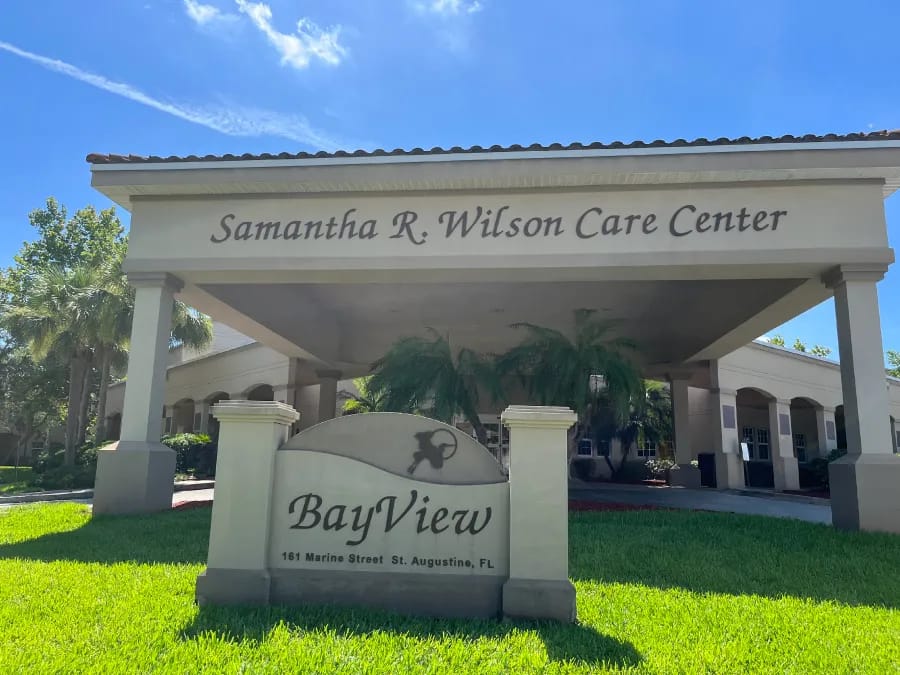
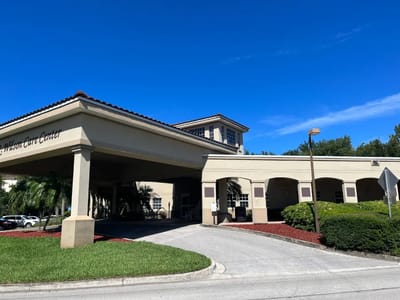
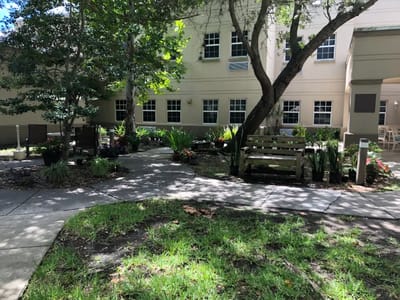
Situated on Marine Street, The Lilac at Bayview is a 69-bed nursing home in Saint Augustine, Florida. Run by administrator Heather Christine Salerno and operated by St. Augustine Fl Opco LLC, the facility handles a mix of long-term medical care and short-term post-hospital therapy, with average stays lasting about 58 days. For payment, the business office accepts traditional Medicare, Medicaid, private funds, VA benefits, and workers’ compensation.

The surrounding area is exceptionally easy to get around on foot, earning a walk score of 93 out of 100, which means visiting families can easily walk to local shops, restaurants, and nearby attractions. Indoors, the bilingual staff speaks English and Spanish, delivering an average of 4 hours and 17 minutes of direct nursing attention to each resident daily. This floor team coordinates orthopedic rehabilitation, pharmacy management, and respite care alongside regular activities like gardening, cooking classes, and group outings.

The Florida Agency for Health Care Administration monitors the property through regular safety evaluations. Past reports highlighted problems with staff training numbers, staffing levels, and medication management, but the facility has shown consistent improvement, and recent inspections have come back clean with zero lingering citations.

Prospective representatives can contact the admissions department to check on current openings, ask about the bilingual care schedules, or set up a time to visit the property in person.

Quality ratings

Measured by Centers for Medicare & Medicaid Services (CMS)

Overall rating Info The Overall CMS Rating combines results from health inspections, staffing levels and quality measures. Health inspections carry the most weight. Staffing and quality scores can increase or decrease the final rating based on performance compared to state and national standards.
Health Inspection Info Based on the results of the facility's three most recent standard inspections and any complaint investigations. CMS reviews the number, scope, and severity of deficiencies, with more recent findings weighted more heavily.
Staffing Info Measures average nursing staff hours per resident per day, including Registered Nurses (RNs) and total nursing staff. Ratings are adjusted based on the level of care residents require and are compared to state and national benchmarks.
Quality Measures Info Based on clinical and physical health indicators reported to CMS, such as hospital readmissions, falls, pressure ulcers, and improvements in mobility. These measures reflect how well residents' health needs are being managed.

Staffing hours breakdown

Info Daily nursing hours per resident by staff type, reported to CMS. Higher is generally better — compare this facility to state and national averages to see where staffing stands.

Hours per resident per day — compared to state averages

Total nursing care / resident Info Total adjusted nursing hours per resident per day, combining RN, LPN, and aide time. CMS adjusts this for case-mix so facilities can be fairly compared.
4h 17m per day
Rank #66 / 253Nurse hours — State benchmarkedThis home is ranked 66th out of 253 homes in Florida. Shows adjusted nurse hours per resident per day benchmarked to the Florida average, with a ranking across 253 Florida facilities. More hours mean more direct care. The national average is about 3.5 hrs; below 3.0 is a red flag.Rankings are based only on facilities in Florida that report data for that category. Facilities without available data are excluded from the ranking.Click the rank badge to see the full State ranking.Click here to see the full State ranking.
vs avg
Staff type Hours / Day / Resident vs state avg
Registered Nurse (RN) Info RNs hold the highest nursing license and can assess residents, interpret test results, and direct care plans. More RN hours per day often signals stronger clinical oversight and faster response to health changes. 18m per day
LPN / LVN Info Licensed Practical Nurses (LPNs) or Licensed Vocational Nurses (LVNs) deliver routine hands-on care — medication administration, wound dressing, and monitoring vital signs. They work under RN supervision and make up a large share of daily bedside care. 1h 8m per day
Nurse Aide Info Certified Nurse Aides (CNAs) provide the most direct day-to-day assistance: bathing, dressing, feeding, and mobility. Nurse aide hours are typically the largest staffing category and directly affect residents' quality of life. 2h 7m per day
Weekend Total Nursing Info Combined nursing hours (RN + LPN + Nurse Aide) per resident per day on weekends. Staffing often drops on weekends — this figure reveals whether the facility maintains adequate coverage outside of weekday hours. 3h 16m per day
Physical Therapist Info Hours per resident per day provided by licensed Physical Therapists (PTs) or PT Assistants. PT services help residents recover mobility after injury or illness and are especially important for post-acute (short-stay) rehabilitation. 2m per day
Weekend RN Info Registered nurse hours specifically on weekends. Facilities sometimes reduce RN presence on Saturdays and Sundays — a low weekend RN figure compared to weekday hours can indicate reduced clinical oversight when most administrative staff are absent. 7m per day

Capacity and availability

Avg. Length of Stay
58 days
Bed community size
69-bed community Rank #656 / 1074Bed count — State benchmarkedThis home is ranked 656th out of 1074 homes in Florida. Shows this facility's certified or reported bed count compared to other Florida facilities. Larger communities may offer more amenities, programs, and on-site services for residents and families.Rankings are based only on facilities in Florida that report data for that category. Facilities without available data are excluded from the ranking.Click the rank badge to see the full State ranking.Click here to see the full State ranking.
A moderately sized community that may balance personal attention with shared amenities and social activities.
Walk Score
Walk Score: 93 / 100 Rank #22 / 1486Walk Score — State benchmarkedThis home is ranked 22nd out of 1486 homes in Florida. Shows how walkable this facility's neighborhood is compared to the average Walk Score across Florida facilities. Higher scores benefit residents, families, and staff.Rankings are based only on facilities in Florida that report data for that category. Facilities without available data are excluded from the ranking.Click the rank badge to see the full State ranking.Click here to see the full State ranking.
Walker's paradise. Daily errands do not require a car, with many shops and services nearby.

About this community

Occupancy

Occupancy rate
83%
Rank #178 / 258Occupancy rate — State benchmarkedThis home is ranked 178th out of 258 homes in Florida. Shows this facility's occupancy rate versus the Florida average, with its Statewide rank out of 258. Higher occupancy signals strong local demand and financial stability.Rankings are based only on facilities in Florida that report data for that category. Facilities without available data are excluded from the ranking.Click the rank badge to see the full State ranking.Click here to see the full State ranking.
Similar to the Florida average: 84.3%
Occupied beds
57 / 69
Average occupied beds in Florida homes 108 beds

License Details

Facility TypeAssisted Living Facility
StatusLicensed
IssuanceJanuary 13, 2026
ExpirationDecember 1, 2028
CountySt. Johns
License Number9470
CMS Certification Number105816
AccreditationsJoint Commission Accredited

Ownership & Operating Entity

The Lilac at Bayview is legally operated by St. Augustine Fl Opco Llc, and administered by Heather Christine Salerno.

Owner NameSt. Augustine Fl Opco LLC
Profit StatusFor-profit

Type Of Units

Private
69 units
Total beds
69 units

Staffing

Key information about the people who lead and staff this community.

Languages Spoken

English Spanish

Therapy & Rehabilitation

3 services
Rehabilitation Services
Respite Care
Short-Term Rehab

Amenities & Lifestyle

Specific ProgramsOrthopedic Rehab, Pharmacy Management

Contact The Lilac at Bayview

Inspection History

In Florida, the Agency for Health Care Administration (AHCA) is the primary authority that conducts unannounced inspections and completes official health quality reports for all healthcare facilities.

Since 2012 · 14 years of data 26 citations 25 inspections
Inspection Score Info A composite 0–100 score combining this facility's inspections, citations, complaints, and enforcement actions relative to the Florida state average. The score below shows how many points this facility sits above or below the typical Florida assisted living residence score (the benchmark); higher is better.

9 points above the Florida average for assisted living residences (83/100)

Rank #237 / 876 in Florida Inspection Score — State benchmarked This home is ranked 237th out of 876 homes in Florida. Shows this facility's inspection score compared to the Florida average among 876 comparable communities in the ranking pool. Rankings are based only on facilities in Florida that report data for that category. Facilities without available data are excluded from the ranking. Inspection score: 92 out of 100. Letter grade A-. 9 points above the Florida average for assisted living residences (83/100)

Inspection Scorecard Info This scorecard compares key inspection, citation, and complaint metrics at this facility against the Florida state average. Metrics rated ≥15% worse than average are highlighted in red; those ≥15% better are highlighted in green.

Since 2012 vs. Florida state average
Overall vs. FL average 1 Worse Metrics worse than Florida average:
• Inspection citation rate (3% above)
1 At Avg Metrics at Florida average:
• Inspections with citations (at FL avg)
4 Better Metrics better than Florida average:
• Total citations (21% below)
• Citations per year (21% below)
• Citations per inspection (23% below)
• Total inspections (4% below)
Latest Inspection May 16, 2025 Routine

Citations Info Citations are formal regulatory issues recorded during state inspections.

This Facility FL Average vs. FL Avg
Total citations Info Formal regulatory issues recorded by inspectors across all inspection types. 26 33 This facility has 21% fewer total citations than a typical Florida assisted living residence (26 vs. FL avg 33).↓ 21% better Rank #414 / 919 Total citations — State benchmarked This home is ranked 414th out of 919 homes in Florida. Shows this facility's total citations compared to the Florida average among 919 comparable communities in the ranking pool. Rankings are based only on facilities in Florida that report data for that category. Facilities without available data are excluded from the ranking.
Citations per year Info Average citations per year since 2012. 1.9 2.4 This facility has 21% fewer citations per year than a typical Florida assisted living residence (1.9 vs. FL avg 2.4).↓ 21% better
Citations per inspection Info Average citations per inspection. 1 1.3 This facility has 23% fewer citations per inspection than a typical Florida assisted living residence (1 vs. FL avg 1.3).↓ 23% better Rank #167 / 919 Citations per inspection — State benchmarked This home is ranked 167th out of 919 homes in Florida. Shows this facility's citations per inspection compared to the Florida average among 919 comparable communities in the ranking pool. Rankings are based only on facilities in Florida that report data for that category. Facilities without available data are excluded from the ranking.

Inspections Info State inspections evaluate whether the facility meets health and safety standards.

This Facility FL Average vs. FL Avg
Total inspections Info Combined count of all routine and focused inspections. Excludes complaint investigations. 25 26 This facility has 4% fewer total inspections than a typical Florida assisted living residence (25 vs. FL avg 26).↓ 4% better
Inspections with citations Info Inspections that resulted in at least one regulatory citation. 16 16 This facility has inspections with citations in line with the Florida average (16 vs. FL avg 16).— At avg
Inspection citation rate Info Percentage of inspections that resulted in at least one citation. 64% 62% This facility has 2 percentage points higher inspection citation rate than a typical Florida assisted living residence (64% vs. FL avg 62%).↑ 2% worse Rank #590 / 919 Inspection citation rate — State benchmarked This home is ranked 590th out of 919 homes in Florida. Shows this facility's % of inspections with citations compared to the Florida average among 919 comparable communities in the ranking pool. Rankings are based only on facilities in Florida that report data for that category. Facilities without available data are excluded from the ranking.

Inspection Reports Summary Info An editor-reviewed summary of the themes and findings across this facility's recent inspection reports.

  • May 16, 2025 routine inspection found no deficiencies and no complaints were substantiated.
  • November 2, 2023 routine inspection cited five Class 3 deficiencies including medication assistance, staffing standards, HIV/AIDS training, physical plant safety, and resident contracts.
  • Deficiency themes over time consistently involved medication management, staffing standards, and staff training, with some improvements shown by recent clean inspections.

Health Inspection History

Inspections since 2021
Total health inspections 6

State average N/A


Last Health inspection on Apr 2025

Total health citations
22 Rank #161 / 252Health citations — State benchmarkedThis home is ranked 161st out of 252 homes in Florida. Shows this facility's total health deficiency citations benchmarked to the Florida State average, with a ranking across all 252 FL facilities. Lower citation counts earn a better rank.Rankings are based only on facilities in Florida that report data for that category. Facilities without available data are excluded from the ranking.Click the rank badge to see the full State ranking.Click here to see the full State ranking.

State average N/A

Citations per inspection
3.67 Rank #94 / 252Citations per inspection — State benchmarkedThis home is ranked 94th out of 252 homes in Florida. Shows average deficiency citations per CMS inspection for this facility versus the Florida mean across 252 facilities with citation data. Lower is better.Rankings are based only on facilities in Florida that report data for that category. Facilities without available data are excluded from the ranking.Click the rank badge to see the full State ranking.Click here to see the full State ranking.

State average N/A


Health citations are formal notices following inspections when they fail to comply with safety and care standards.

15 of 22 citations resulted from standard inspections; and 7 of 22 resulted from complaint investigations.

Breakdown of citation severity (last 5 years)
Critical health citations
3
In line with State average

State average: N/A


Serious health citations
2
In line with State average

State average: N/A

3 critical citations State average: N/A

2 serious citations State average: N/A

17 moderate citations State average: N/A

0 minor citations State average: N/A
Citations history (last 5 years)
Infection Control moderate citation Apr 10, 2025
Corrected

Pharmacy moderate citation Apr 10, 2025
Corrected

Pharmacy moderate citation Apr 10, 2025
Corrected

Quality of Care moderate citation Apr 10, 2025
Corrected

Staffing Data

Reporting period: October 1 – December 31, 2025 (Q4 2025). Source: CMS Payroll-Based Journal report.

Total staff 166
Employees 127
Contractors 39
Staff to resident ratio 1.48 : 1
0% compared with State average

State average ratio: 0 : 0

Avg staff/day 50
Average shift 8.7 hours
0% compared with State average

State average: 0 hours

Total staff hours (quarter) 39,872

Nursing staff breakdown

Q4 2025 · Oct 1 – Dec 31 More info This data comes from the CMS Payroll-Based Journal report covering October 1 – December 31, 2025.
Registered Nurse

Manages medical care and health needs.

RN Staff Info All 9 RN Staff are full-time employees. No contractors work on this role. 9
Average shift length Info Average shift length. Calculated as total hours divided by days worked and average staff per day. 7.7 hours
Licensed Practical Nurse

Assists with medical care and medications.

LPN Staff Info All 29 LPN Staff are full-time employees. No contractors work on this role. 29
Average shift length Info Average shift length. Calculated as total hours divided by days worked and average staff per day. 9.3 hours
Certified Nursing Assistant

Helps with daily care and mobility.

CNA Staff Info All 76 CNA Staff are full-time employees. No contractors work on this role. 76
Average shift length Info Average shift length. Calculated as total hours divided by days worked and average staff per day. 9.6 hours

Contractor staffing

Q4 2025 · Oct 1 – Dec 31 More info This data comes from the CMS Payroll-Based Journal report covering October 1 – December 31, 2025.

Total hours from contractors

7.7%

3,052 contractor hours this quarter

Speech Language Pathologist: 11 Physical Therapy Aide: 9 Physical Therapy Assistant: 9 Respiratory Therapy Technician: 5 Qualified Social Worker: 2 Medical Director: 2 Occupational Therapy Assistant: 1

Staff by category

Q4 2025 · Oct 1 – Dec 31 More info This data comes from the CMS Payroll-Based Journal report covering October 1 – December 31, 2025.
Certified Nursing Assistant 76 0 76 20,098 92 100% 9.6
Licensed Practical Nurse 29 0 29 10,241 92 100% 9.3
Registered Nurse 9 0 9 1,801 89 97% 7.7
Other Dietary Services Staff 3 0 3 1,195 85 92% 7.9
Speech Language Pathologist 0 11 11 1,156 88 96% 6.3
Physical Therapy Aide 0 9 9 1,013 81 88% 6
Clinical Nurse Specialist 2 0 2 646 65 71% 7
Administrator 1 0 1 528 66 72% 8
Dietitian 2 0 2 506 53 58% 9.2
Dental Services Staff 1 0 1 480 66 72% 7.3
Mental Health Service Worker 2 0 2 460 61 66% 6.5
Nurse Practitioner 1 0 1 452 62 67% 7.3
RN Director of Nursing 1 0 1 413 53 58% 7.8
Physical Therapy Assistant 0 9 9 354 71 77% 4
Respiratory Therapy Technician 0 5 5 266 51 55% 4.8
Qualified Social Worker 0 2 2 192 36 39% 5.3
Occupational Therapy Assistant 0 1 1 47 10 11% 4.7
Medical Director 0 2 2 24 6 7% 4
76 Certified Nursing Assistant
% of Days 100%
29 Licensed Practical Nurse
% of Days 100%
9 Registered Nurse
% of Days 97%
3 Other Dietary Services Staff
% of Days 92%
11 Speech Language Pathologist
% of Days 96%
9 Physical Therapy Aide
% of Days 88%
2 Clinical Nurse Specialist
% of Days 71%
1 Administrator
% of Days 72%
2 Dietitian
% of Days 58%
1 Dental Services Staff
% of Days 72%
2 Mental Health Service Worker
% of Days 66%
1 Nurse Practitioner
% of Days 67%
1 RN Director of Nursing
% of Days 58%
9 Physical Therapy Assistant
% of Days 77%
5 Respiratory Therapy Technician
% of Days 55%
2 Qualified Social Worker
% of Days 39%
1 Occupational Therapy Assistant
% of Days 11%
2 Medical Director
% of Days 7%

Penalties and fines

Includes penalties issued in 2023-2024

Federal penalties imposed by CMS for regulatory violations, including civil money penalties (fines) and denials of payment for new Medicare/Medicaid admissions.

Source: CMS Penalties Database (Data as of Jan 2026)

Total fines amount $125K Rank #242 / 258Federal fines — State benchmarkedThis home is ranked 242nd out of 258 homes in Florida. Shows this facility's cumulative CMS federal fine dollars versus the Florida average among facilities with fines, and where it ranks among 258 facilities in the pool. Lower total dollars mean a better rank.Rankings are based only on facilities in Florida that report data for that category. Facilities without available data are excluded from the ranking.Click the rank badge to see the full State ranking.Click here to see the full State ranking.
74% higher than State average

State average: $72K

Number of fines 3
14% more fines than State average

State average: 2.6

Payment Denials Info Serious action where Medicare and/or Medicaid temporarily stops payments for new residents until issues are fixed. 0
100% fewer payment denials than State average

State average: 0.1

Fines amount comparison
This facility $125K
State average $72K
Penalty History

Penalties are imposed by CMS for violations of federal nursing home regulations.

3 penalties in the past 3 years

Multiple penalties were reported in the last 3 years.

Civil Money Penalty Info Fines imposed for noncompliance, which can be assessed per day or per instance of violation. May 17, 2024
$8K
Civil Money Penalty Info Fines imposed for noncompliance, which can be assessed per day or per instance of violation. May 17, 2024
$8K
Civil Money Penalty Info Fines imposed for noncompliance, which can be assessed per day or per instance of violation. Sep 21, 2023
$109K

Last updated: Jan 2026

Quality of care over time

These measures show how residents usually do over time at this home, based on health outcomes and preventive care.

High-risk clinical events score Info A composite score based on pressure ulcers, falls with injury, weight loss, walking ability decline, and activities of daily living decline. 7.4
In line with State average

State average: 7.4

Functional decline score Info A composite score based on activities of daily living decline, walking ability decline, and incontinence. 8.9
28% better than State average

State average: 12.4

Long-stay resident measures
Need for Help with Daily Activities Increased Info Percent of long-stay residents whose need for help with daily activities has increased 8.3%
21% better than State average

State average: 10.5%

Walking Ability Worsened Info Percent of long-stay residents whose ability to move independently worsened 8.5%
35% better than State average

State average: 12.9%

Low Risk Residents with Bowel/Bladder Incontinence Info Percent of low risk long-stay residents who lose control of their bowels or bladder 10.0%
26% better than State average

State average: 13.5%

Falls with Major Injury Info Percent of long-stay residents experiencing one or more falls with major injury 5.4%
102% worse than State average

State average: 2.6%

High Risk Residents with Pressure Ulcers Info Percent of long-stay high risk residents with pressure ulcers 3.4%
37% better than State average

State average: 5.4%

Urinary Tract Infection Info Percent of long-stay residents with a urinary tract infection 0.0%
100% better than State average

State average: 0.9%

Lost Too Much Weight Info Percent of long-stay residents who lose too much weight 11.7%
95% worse than State average

State average: 6.0%

Depressive Symptoms Info Percent of long-stay residents who have depressive symptoms 0.3%
91% better than State average

State average: 3.3%

Antipsychotic Use Info Percent of long-stay residents who received an antipsychotic medication 4.5%
44% better than State average

State average: 8.0%

Pneumococcal Vaccine Info Percent of long-stay residents assessed and appropriately given the pneumococcal vaccine 96.9%
In line with State average

State average: 97.7%

Influenza Vaccine Info Percent of long-stay residents assessed and appropriately given the seasonal influenza vaccine 100.0%
In line with State average

State average: 99.2%

Short-stay resident measures
Pneumococcal Vaccine Info Percent of short-stay residents assessed and appropriately given the pneumococcal vaccine 97.6%
In line with State average

State average: 94.0%

Antipsychotic medication increase Info Percent of short-stay residents who newly received an antipsychotic medication 1.0%
35% better than State average

State average: 1.5%

Influenza Vaccine Info Percent of short-stay residents assessed and appropriately given the seasonal influenza vaccine 96.4%
In line with State average

State average: 94.7%

Breakdown by payment type

Medicare

33% of new residents, usually for short-term rehab.

Typical stay 23 days

Private pay

51% of new residents, often for short stays.

Typical stay 2 - 3 months

Medicaid

16% of new residents, often for long-term daily care.

Typical stay 5 - 6 months

Facility Characteristics

Source: CMS Long-Term Care Facility Characteristics (Data as of Jan 2026)

Total residents 112
Medicare
22
19.6% of residents
Medicaid
86
76.8% of residents
Private pay or other
4
3.6% of residents
Programs & Services
Residents Group

Residents meet regularly to discuss policies, care quality, and activities

Family Member Group

Family members meet regularly to discuss policies, care quality, and activities

Active Family Council

Organized group of family members that meets regularly to discuss facility policies, resident care, and activities.

Active Resident Council

Organized group of residents that meets regularly to discuss facility policies, quality of life, and activities.

Finances and operations

Based on CMS SNF Cost Report for fiscal year ending in 12/2023.

For-profit
Operated by a single business entity.
Net patient revenue Info Net patient revenue — what the home actually collects for resident care, after contractual allowances, bad debt and discounts are subtracted from its gross charges (CMS cost report, Worksheet G-3). It covers resident care only; money the home earns from other sources is shown separately as "Other income."
$15.4M
Net patient income Info Net patient income: net patient revenue minus the home's total operating expenses. A positive figure means it earns more from resident care than it spends to deliver it; a negative figure means the opposite. It excludes non-operating "other income."
-$165.4K
For-profit Operated by a single business entity.
Net patient revenue Info Net patient revenue — what the home actually collects for resident care, after contractual allowances, bad debt and discounts are subtracted from its gross charges (CMS cost report, Worksheet G-3). It covers resident care only; money the home earns from other sources is shown separately as "Other income."
$15.4M Rank #157 / 257Revenue — State benchmarkedThis home is ranked 157th out of 257 homes in Florida. Shows this facility's annual revenue compared to the Florida average. Higher revenue generally means more resources for staffing and capital — read alongside Payroll %.Rankings are based only on facilities in Florida that report data for that category. Facilities without available data are excluded from the ranking.Click the rank badge to see the full State ranking.Click here to see the full State ranking.
Net patient income Info Net patient income: net patient revenue minus the home's total operating expenses. A positive figure means it earns more from resident care than it spends to deliver it; a negative figure means the opposite. It excludes non-operating "other income."
-$165.4K
Other income Info Money the home earns outside of resident care — such as investments, grants, rentals and other non-operating sources (CMS cost report, Worksheet G-3). It is tracked separately from net patient revenue: it is not part of that figure, and it is not included in net patient income.
-$466.0K
Payroll costs Info Staff salaries plus wage-related costs — benefits such as payroll taxes, health insurance and retirement — from the home's own accounting records (CMS cost report, Worksheet A). Contract or agency labor is counted separately, under other operating costs. Rank #101 / 257Payroll — State benchmarkedThis home is ranked 101st out of 257 homes in Florida. Shows total annual staff payroll benchmarked to the Florida average. Higher payroll investment relative to peers often signals better staffing and less reliance on cheaper contract labor.Rankings are based only on facilities in Florida that report data for that category. Facilities without available data are excluded from the ranking.Click the rank badge to see the full State ranking.Click here to see the full State ranking.
$7.6M 49.3% of net patient revenue Info Payroll as a share of revenue: staff salaries and wage-related benefits divided by net patient revenue. A higher figure means more of each revenue dollar goes to staff pay. Rank #30 / 257Payroll % — State benchmarkedThis home is ranked 30th out of 257 homes in Florida. Shows payroll as a percentage of revenue versus the Florida average. Well-run Florida facilities typically land around 49–56% — the top third Statewide. Below 25% may signal understaffing or heavy agency use — read with Staffing ratings.Rankings are based only on facilities in Florida that report data for that category. Facilities without available data are excluded from the ranking.Click the rank badge to see the full State ranking.Click here to see the full State ranking.
Other operating costs Info Everything it costs to run the home apart from payroll — food, utilities, supplies, maintenance, contract labor and administration. Calculated as total operating expense minus payroll (staff salaries and wage-related benefits).
$8.0M
Total costs Info The home's total operating expense for the year — all the costs of running it, salaries included (CMS cost report, Worksheet G-3).
$15.5M

Who this home usually serves

TYPE OF STAY

Mix of rehab and long-term care

This home supports both short-term rehab and long-term care, with residents staying for a wide range of durations.

Most new residents arrive under private pay (51% of admissions), and a typical private pay stay runs around 2 - 3 months.

Admissions
674 total

Coverage residents most often arrive under.

Medicare 33%
Private pay 51%
Medicaid 16%
Discharges
696 total

Coverage residents most often leave under.

Medicare 24%
Private pay 53%
Medicaid 23%

Activities in this home

Places of interest near The Lilac at Bayview

Address 0.0 miles from city center Info Estimated distance in miles from Saint Augustine's city center to The Lilac at Bayview's address, calculated via Google Maps.

Calculate Travel Distance to The Lilac at Bayview

Add your location

Address

Compare Nursing Homes around the area

The information below is reported by the Florida Agency for Health Care Administration (AHCA).

The Lilac at Bayview
NH
RC
Saint Augustine - 69 - 93 -
Terracina Grand
NH
AL
IL
MC
RC
Naples - 200 A+ 12 Studio / 1 Bed / 2 Bed
The Oaks of Clearwater
NH
AL
IL
MC
Clearwater (Oak Bluffs) - 175 B- 64 Studio / 1 Bed / 2 Bed
Brookdale Palmer Ranch
NH
AL
IL
MC
Sarasota (Bee Ridge) - 118 A+ 3 Studio / 1 Bed / 2 Bed
Life Care Center at Inverrary
NH
Lauderhill (Inverrary) - 120 A+ 12 Private / Semi-Private Rooms

Frequently Asked Questions about The Lilac at Bayview

What languages are spoken at The Lilac at Bayview?

The team at The Lilac at Bayview speaks English and Spanish.

Who is the owner of The Lilac at Bayview?

The Lilac at Bayview is legally operated by St. Augustine Fl Opco Llc, and administered by Heather Christine Salerno.

Is The Lilac at Bayview in a walkable area?

The Lilac at Bayview has a walk score of 93. Walker's paradise. Daily errands do not require a car, with many shops and services nearby.

What is the license number of The Lilac at Bayview?

According to FL state health department records, The Lilac at Bayview's license number is 9470.

When does The Lilac at Bayview's license expire?

According to FL state health department records, The Lilac at Bayview's license expires on December 1, 2028.

What is the occupancy rate at The Lilac at Bayview?

The Lilac at Bayview's occupancy is 83%.

What payment types does The Lilac at Bayview accept?

The Lilac at Bayview accepts Insurance and/or HMO, Medicaid, Medicare, VA, and Workers Compensation.

Guides for Better Senior Living

Care Cost Calculator: See Prices in Your Area

Nursing Home Data Explorer

Don’t Wait Too Long: 7 Red Flag Signs Your Parent Needs Assisted Living Now

The True Cost of Assisted Living in 2025 – And How Families Are Paying For It

Understanding Senior Living Costs: Pricing Models, Discounts & Financial Assistance