The Maples Health & Rehabilitation

Nursing Home
Overview of The Maples Health & Rehabilitation

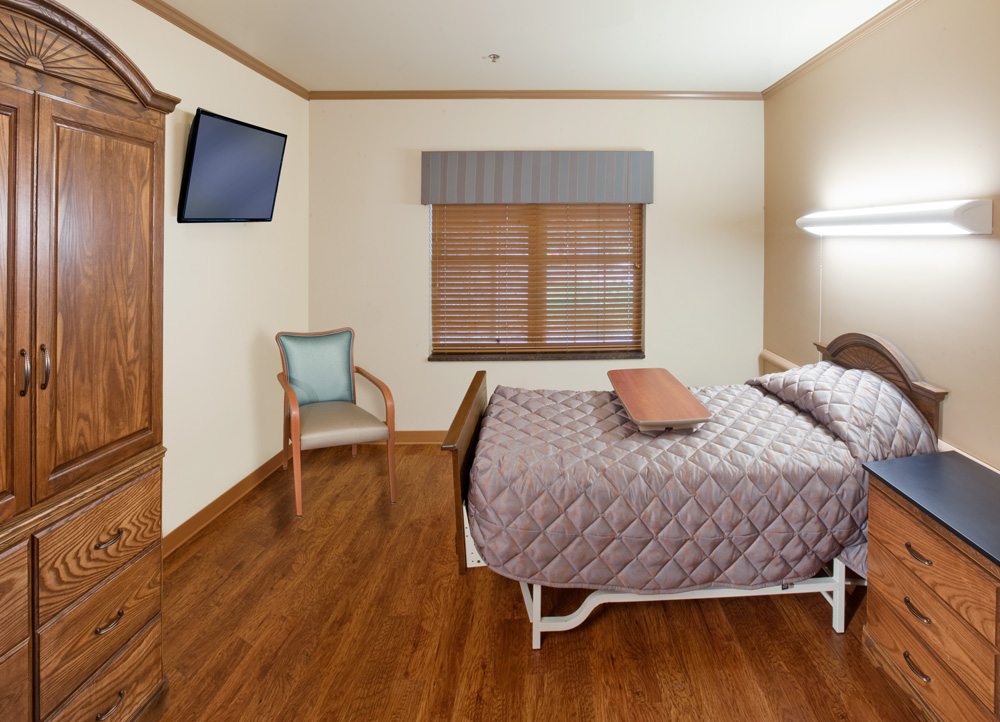
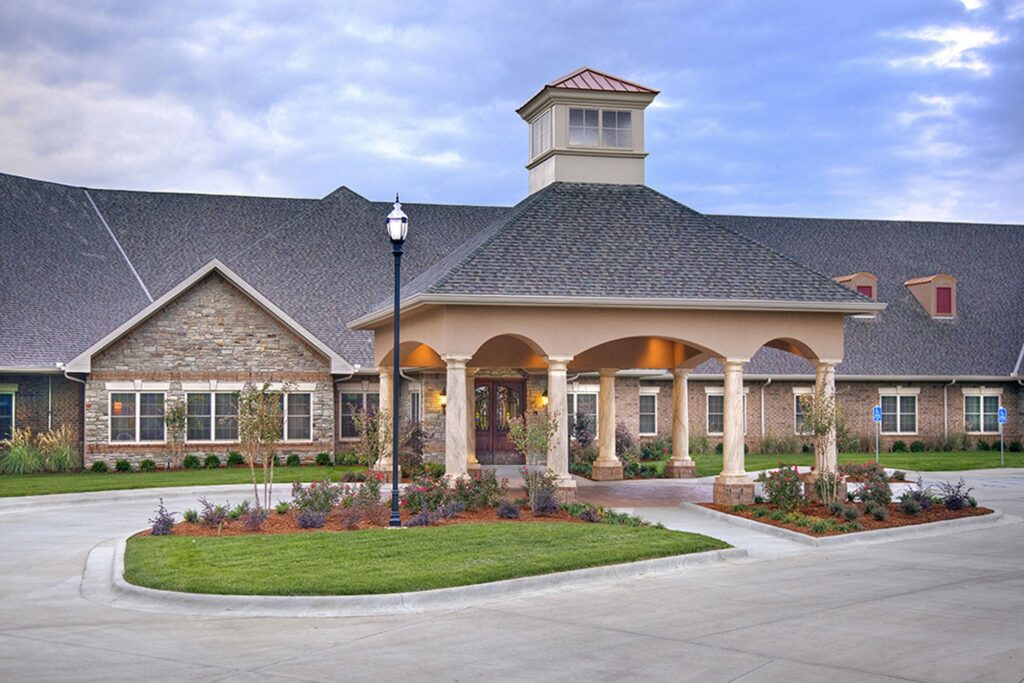
Specializing in short-term rehabilitation and long-term care services, The Maples believes that quality and compassionate care are the most important priorities in their service. Community features are designed to promote comfort and care for its residents. The upscale community boasts its home-like atmosphere where seniors can enjoy their stay. The Maples do their best in ensuring that its residents have a speedy recovery and get back on their feet as soon as possible. 

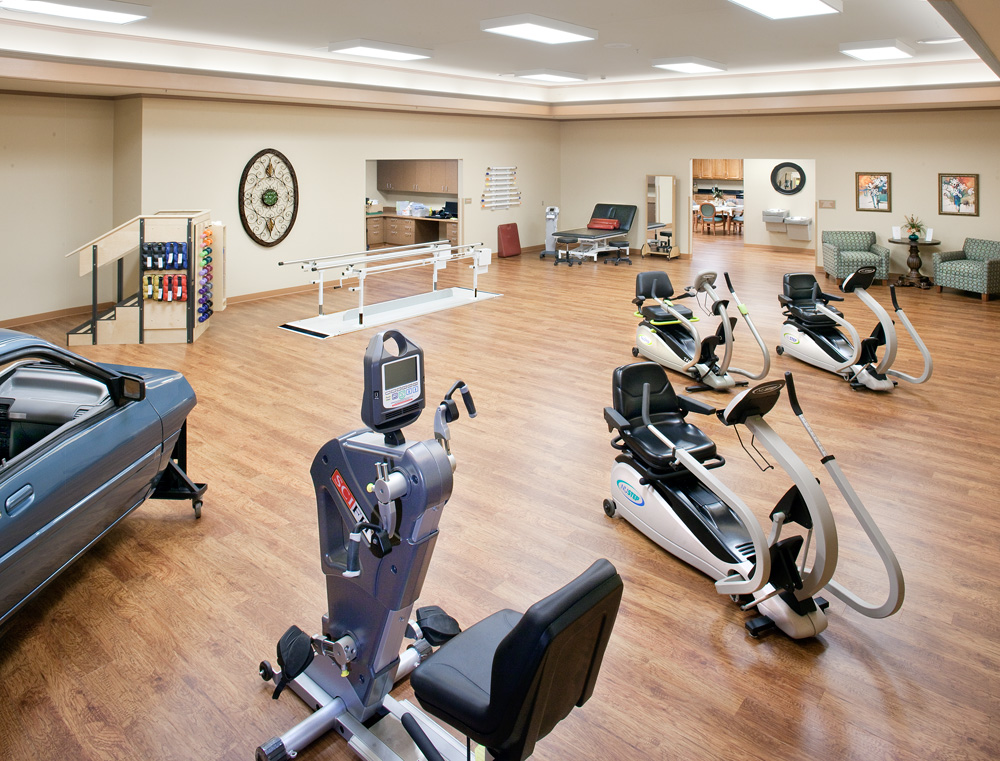
The Maples is a 120-bed facility with 24-hour skilled nursing care, a spacious therapy gym, a private dining room, and an outdoor courtyard. The nursing home follows a guideline to see if a resident reaches the qualifications for Medicare.

(417) 891-1700

Quality ratings

Measured by Centers for Medicare & Medicaid Services (CMS)

Overall rating Info Official CMS rating based on health inspections, staffing and quality measures.
4/5
Missouri average: 2.5/5
Health Inspection Info Official CMS rating based on deficiencies found during state health inspections.
3/5
Missouri average: 2.8/5
Staffing Info Official CMS rating based on nurse staffing hours per resident per day.
3/5
Missouri average: 2.2/5
Quality Measures Info Official CMS rating based on clinical outcomes for residents.
5/5
Missouri average: 2.7/5

Nursing care per resident

Info Average daily nursing hours per resident (adjusted for acuity). Higher values indicate more nursing time per resident.
3h 44m per day

This home provides 0% more nursing time per resident than the state average.

Missouri average: 3h 44m per day

Staffing hours breakdown

Info Hours of care per resident per day, broken down by staff type. Data from CMS Medicare.
Staff type Facility State avg National avg
Registered Nurse (RN) Info Registered nurse hours per resident per day. 28m per day 28m per day 41m per day
LPN / LVN Info Licensed Practical Nurse / Licensed Vocational Nurse hours per resident per day. 46m per day 41m per day 52m per day
Nurse Aide Info Nurse aide hours per resident per day. 2h 14m per day 2h 20m per day 2h 21m per day
Total Nursing (Weekend) Info Total number of nurse staff hours per resident per day on weekends. 2h 58m per day 3h 3m per day 3h 26m per day
Physical Therapist Info Physical therapist staff hours per resident per day. 3m per day 2m per day 4m per day
RN (Weekend) Info Registered nurse hours per resident per day on weekends. 16m per day 20m per day 29m per day

Capacity and availability

Medium-capacity home

Offers a balance of services and community atmosphere.

Total beds 120

This home usually has availability

Lower occupancy suggests more openings may be available.

Lower demand than the Missouri average
Occupancy rate 76.8%
Residents per day (avg) 94
Occupancy rate
76.8%
Residents per day (avg)
94

Who this home usually serves

TYPE OF STAY

Primarily short stays

Residents typically stay for brief periods, with frequent admissions and discharges throughout the year.

Might be optimal for
Post-acute recovery Temporary care Transitional stays

Breakdown by payment type

Medicare

33% of new residents, usually for short-term rehab.

Typical stay 1 months

Private pay

63% of new residents, often for short stays.

Typical stay 1 - 2 months

Medicaid

4% of new residents, often for long-term daily care.

Typical stay 3 - 4 years

Finances and operations

Proprietary home
Corporation
Home revenue
$14.1M
Profit
$923.2K
Proprietary home Corporation
Home revenue
$14,126,842.00
Profit
$923,221.00
Payroll costs Info The portion of the home's budget spent on staff, including nurses, caregivers, and other employees who support care and operations.
$3.8M
27.2% of revenue
Other operating costs Info All remaining costs needed to run the home, such as food, utilities, building maintenance, supplies and administrative expenses.
$9.4M
Total costs $13.2M
Bed community size
120-bed community
A larger shared setting that may offer more common spaces and organized community services.
Walk Score
Walk Score: 55 / 100
Moderately walkable. Some errands can be accomplished on foot, with a mix of nearby amenities.

About this community

Facility Type
SNF

Additional licensing details

CMS Certification Number: 265559
County: GREENE

Ownership & operating entity

The Maples Health & Rehabilitation is legally operated by GREENECO NC OPS, INC, and administrated by MILLER.

Corporate entity: GREENECO NC OPS, INC

Care Services

Nursing Services
Rehabilitation Services
Respite Care
Memory Care
Skilled Nursing
24-Hour Staffing

Amenities & Lifestyle

24/7 nursing care
personalized rehabilitation programs
nutritious meals
engaging social and recreational activities.

Programs & Activities

Activities
Daily opportunities for entertainment and socialization with a diverse calendar of activities.
Specific Programs
Short-Term Rehab, Long-Term Care, Respite Care, Memory Care Support, Nutritional Support, Social & Recreational Activities.

Dining & Nutrition

Food Description
Nutritious meals crafted by a certified dietary manager and cooks, accommodating food allergies and preferences.

Types of Care at The Maples Health & Rehabilitation

Nursing Home
Contact The Maples Health & Rehabilitation

Access & Eligibility

Ways to qualify for care at this community, including accepted programs and payment options.

Medicare Accepted

This facility is certified for eligible Medicare services.

Payment & Funding Options

Medicare

Compare Nursing Homes around Springfield

The information below is reported by the Missouri Department of Health and Senior Services, Division of Regulation and Licensure.
The Maples Health & Rehabilitation
SNF

Nursing Homes 24/7 care needed

Springfield
120
No
-
55
MANTALA, MARCELO
76.8%
$14,116,771.00
$3,845,861.00
27.2%
94.40
4/5
3.7325
3/5
3/5
5/5
-
23
1
-23%
0%
+15%
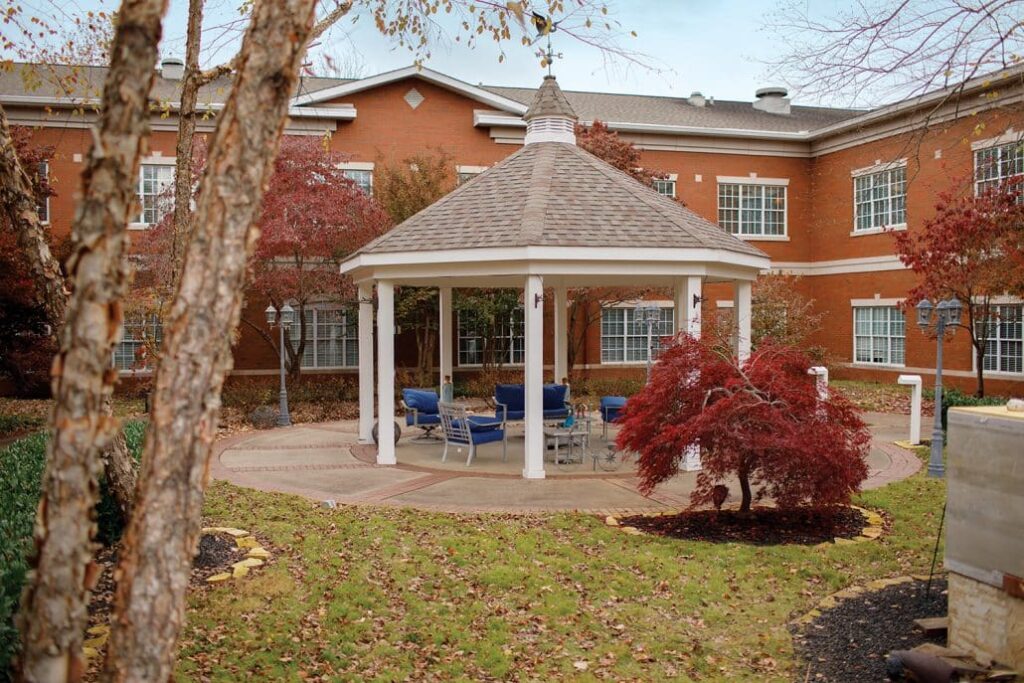
Springfield Rehabilitation & Health Care Center
SNF

Nursing Homes 24/7 care needed

Springfield
146
No
-
29
LACEY, TROY
78.1%
$13,709,803.00
$5,063,993.00
36.9%
116.50
4/5
3.6790
3/5
3/5
5/5
-
34
-
+65%
-2%
+17%
Birch Pointe Health and Rehabilitation
MC

Memory Care Specialized care for those with Memory Loss, Alzheimer's, or dementia, ensuring safety and support.

SNF

Nursing Homes 24/7 care needed

Springfield
120
No
A+
46
LOWE, CLINTON
84.0%
$12,892,307.00
$4,427,337.00
34.3%
105.00
3/5
3.5087
3/5
2/5
3/5
-
32
1
-20%
-6%
+26%
Spring Valley Health and Rehabilitation Center
SNF

Nursing Homes 24/7 care needed

Springfield
234
No
-
65
ANDERSON, HOLLY
65.2%
$18,227,722.00
$5,277,287.00
29%
151.50
2/5
2.0723
1/5
1/5
5/5
1
84
3
-31%
-45%
-2%
Springfield Skilled Care Center
AL

Assisted Living For seniors needing help with daily tasks but not full-time nursing.

IL

Independent Living For self-sufficient seniors seeking community and minimal assistance.

MC

Memory Care Specialized care for those with Memory Loss, Alzheimer's, or dementia, ensuring safety and support.

SNF

Nursing Homes 24/7 care needed

Springfield (Westside Community Betterment)
219
No
A+
28
OR ACQUISITION LLC
83.4%
$13,473,088.00
$4,605,758.00
34.2%
97.90
1/5
2.5645
1/5
1/5
3/5
1
91
3
+15%
-31%
+25%

Places of interest near The Maples Health & Rehabilitation

Address 3.2 miles from city center — 1.35 miles to nearest hospital (CoxHealth Network)

Address 610 W Sunset St, Springfield, MO 65807

Calculate Travel Distance to The Maples Health & Rehabilitation

Add your location

Address

Staffing Data

Source: CMS Payroll-Based Journal (Q2 2025)

134
Total Staff
103
Employees
31
Contractors
35,443
Total Hours (Quarter)
50
Avg Staff/Day
7.8
Avg Shift (hrs)
Nursing Staff Breakdown
Role Count Avg Shift (hrs) Uses Contractors?
Registered Nurse88.7 No
Licensed Practical Nurse178.3 No
Certified Nursing Assistant537.9 No
Staff by Category
Administration
1 staff
8hs shift avg
Nursing Staff
93 staff
8.2hs shift avg
Physicians & Practitioners
6 staff
7hs shift avg
Therapy Services
27 staff
5.4hs shift avg
Activities & Recreation
0 staff
0hs shift avg
Social Services
4 staff
4.7hs shift avg
Dietary Services
1 staff
7.3hs shift avg
Other Services
2 staff
8.9hs shift avg
Contractor Analysis
7.2%
of total hours from contractors
2,548 contractor hours this quarter
Respiratory Therapy Technician: 4 Speech Language Pathologist: 10 Physical Therapy Aide: 9 Physical Therapy Assistant: 4 Qualified Social Worker: 4
Role Employees Contractors Total Staff Total Hours Days Worked % of Days Avg Shift (hrs)
Certified Nursing Assistant5305314,80291100%7.9
Licensed Practical Nurse170176,07691100%8.3
Medication Aide/Technician140145,66991100%8.6
Registered Nurse8082,30691100%8.7
Clinical Nurse Specialist5051,4726571%6.8
Physical Therapy Aide0997237886%5.4
Speech Language Pathologist010106676976%5.1
Dental Services Staff1015746470%9
Mental Health Service Worker1015466268%8.8
Administrator1014886167%8
Other Dietary Services Staff1014736571%7.3
Nurse Practitioner1014646066%7.7
Physical Therapy Assistant0444307380%5.7
Respiratory Therapy Technician0443936571%5.8
Qualified Social Worker0443366470%4.7
Nurse Aide in Training1012544%6.2

Health Inspection History

Inspections
Total health inspections 7

Missouri average 6.6


Last Health inspection on Mar 2025

Total health citations 23
Citations per inspection
3.29

Health citations are formal notices following inspections when they fail to comply with safety and care standards.

19 of 23 citations resulted from standard inspections; and 4 of 23 resulted from complaint investigations.

Breakdown of citation severity (last 3 years)
Critical Health citations More info 0
100% better than Missouri average

Missouri average: 0.7


Serious Health citations More info 1
In line with Missouri average

Missouri average: 1

0 critical citations More info Missouri average: 0.7

1 serious citation More info Missouri average: 1

22 moderate citations More info Missouri average: 33.6

0 minor citations More info Missouri average: 1.2
Citations history (last 3 years)
Nutrition moderate citation Mar 07, 2025
Corrected

Quality of Care moderate citation Mar 07, 2025
Corrected

Quality of Care moderate citation Mar 07, 2025
Corrected

Quality of Care moderate citation Mar 07, 2025
Corrected

Facility Characteristics

Source: CMS Long-Term Care Facility Characteristics (Data as of Jan 2026)

Ownership: For-Profit Individual
Resident Census by Payment Source
89 Total Residents
Medicare 10 (11.2%)
Medicaid 39 (43.8%)
Private Pay/Other 40 (44.9%)
Programs & Services
Residents' Group
Nurse Aide Training
Family Engagement

Active councils help families stay involved in care decisions and facility operations.

Quality of care over time

These measures show how residents usually do over time at this home, based on health outcomes and preventive care.

High-risk clinical events score Info A composite score based on pressure ulcers, falls with injury, weight loss, walking ability decline, and activities of daily living decline. 5.2
52% better than Missouri average

Missouri average: 10.9

Functional decline score Info A composite score based on activities of daily living decline, walking ability decline, and incontinence. 7.4
62% better than Missouri average

Missouri average: 19.5

Long-stay resident measures
Need for Help with Daily Activities Increased Info Percent of long-stay residents whose need for help with daily activities has increased 7.0%
65% better than Missouri average

Missouri average: 19.8%

Walking Ability Worsened Info Percent of long-stay residents whose ability to move independently worsened 8.7%
58% better than Missouri average

Missouri average: 20.6%

Low Risk Residents with Bowel/Bladder Incontinence Info Percent of low risk long-stay residents who lose control of their bowels or bladder 6.4%
65% better than Missouri average

Missouri average: 18.1%

Falls with Major Injury Info Percent of long-stay residents experiencing one or more falls with major injury 2.7%
33% better than Missouri average

Missouri average: 4.0%

High Risk Residents with Pressure Ulcers Info Percent of long-stay high risk residents with pressure ulcers 4.2%
16% better than Missouri average

Missouri average: 5.0%

Urinary Tract Infection Info Percent of long-stay residents with a urinary tract infection 0.0%
100% better than Missouri average

Missouri average: 2.7%

Lost Too Much Weight Info Percent of long-stay residents who lose too much weight 3.6%
36% better than Missouri average

Missouri average: 5.6%

Depressive Symptoms Info Percent of long-stay residents who have depressive symptoms 0.0%
100% better than Missouri average

Missouri average: 12.8%

Antipsychotic Use Info Percent of long-stay residents who received an antipsychotic medication 1.7%
92% better than Missouri average

Missouri average: 22.0%

Pneumococcal Vaccine Info Percent of long-stay residents assessed and appropriately given the pneumococcal vaccine 99.3%
17% better than Missouri average

Missouri average: 85.2%

Influenza Vaccine Info Percent of long-stay residents assessed and appropriately given the seasonal influenza vaccine 93.6%
In line with Missouri average

Missouri average: 90.9%

Hospitalizations per 1,000 days Info Number of hospitalizations per 1,000 long-stay resident days. 2.05
In line with Missouri average

Missouri average: 2.08

ED visits per 1,000 days Info Number of outpatient emergency department visits per 1,000 long-stay resident days. 1.31
44% better than Missouri average

Missouri average: 2.35

Short-stay resident measures
Pneumococcal Vaccine Info Percent of short-stay residents assessed and appropriately given the pneumococcal vaccine 96.9%
46% better than Missouri average

Missouri average: 66.6%

Antipsychotic medication increase Info Percent of short-stay residents who newly received an antipsychotic medication 0.2%
91% better than Missouri average

Missouri average: 2.2%

Influenza Vaccine Info Percent of short-stay residents assessed and appropriately given the seasonal influenza vaccine 81.0%
28% better than Missouri average

Missouri average: 63.5%

Re-hospitalized after SNF stay Info Percentage of short-stay residents who were re-hospitalized after their nursing home admission. 28.2%
11% worse than Missouri average

Missouri average: 25.3%

Emergency department visits Info Percentage of short-stay residents who had an outpatient emergency department visit. 10.1%
25% better than Missouri average

Missouri average: 13.4%

Falls with major injury Info Percentage of SNF residents who experience falls with major injury during their stay. 0.0%
100% better than Missouri average

Missouri average: 0.8%

Ability to care for self at discharge Info Percentage of residents at or above expected ability to care for themselves at discharge. 73.0%
36% better than Missouri average

Missouri average: 53.7%

Successful return to home or community Info Rate of successful return to home or community from a skilled nursing facility. 53.0%
5% better than Missouri average

Missouri average: 50.6%

Guides for Better Senior Living

Care Cost Calculator: See Prices in Your Area

Nursing Home Data Explorer

Don’t Wait Too Long: 7 Red Flag Signs Your Parent Needs Assisted Living Now

The True Cost of Assisted Living in 2025 – And How Families Are Paying For It

Understanding Senior Living Costs: Pricing Models, Discounts & Financial Assistance

Financial Aid for Missouri Seniors

Get financial aid guidance

Aged and Disabled Waiver

Missouri Medicaid A&D Waiver

Age 65+ or disabled, Missouri resident, Medicaid- eligible, nursing home-level care need.

~$2,829/month (300% FBR, individual).

$2,000 (individual), $3,000 (couple).

Rural access prioritized.

Missouri Supplemental Nursing Care (SNC)

MO SNC

Age 65+, Missouri resident, in approved facility.

~$1,215/month (individual).

$2,000 (individual).

Supplements SSI; facility-based only.

Structured Family Caregiving Waiver (SFCW)

Missouri Structured Family Caregiving Waiver

Age 65+, Missouri resident, MO HealthNet-eligible, NFLOC, dementia diagnosis, live with caregiver.

~$2,901/month (300% FBR, individual); QIT required.

$5,909.25 (individual), $11,818.45 (couple).

Caregiver must be family; small program size.

MO HealthNet Aged, Blind, and Disabled (ABD)

Missouri MO HealthNet ABD

Age 65+ or disabled, Missouri resident, MO HealthNet-eligible, needs help with 1+ ADL.

~$1,690/month (individual, projected); spenddown allowed.

$5,909.25 (individual), $11,818.45 (couple).

Less intensive than waivers; statewide access.

Medicare Savings Program (MSP)

Missouri Medicare Savings Program

Age 65+ or disabled, Missouri resident, Medicare Part A/B.

~$2,510/month (QMB), ~$3,380/month (SLMB), ~$3,598/month (QI)—individual.

$9,430 (individual), $14,130 (couple).

Three tiers; no waitlist; includes Extra Help for Part D.

Missouri Caregiver Program (Customized Caregiver Training & Relief)

Missouri Caregiver Program

Caregivers of 60+ with dementia, Missouri resident, functional needs (2+ ADLs).

No strict cap; prioritizes low-income (~$24,980/year individual).

Not assessed; need-based.

Administered via AAAs and Alzheimer’s Association; rural focus.

Senior Community Service Employment Program (SCSEP)

Missouri SCSEP

Age 55+, unemployed, low-income, Missouri resident.

~$1,983/month (125% FPL).

Not specified; income-focused.

Priority for veterans, rural residents; AARP partnership.

VA Aid and Attendance (A&A) and Housebound Benefits

Missouri VA Aid and Attendance/Housebound

Age 65+ or disabled veteran/spouse, Missouri resident, wartime service, need for ADL help (A&A) or homebound.

Net income < ~$1,984/month (veteran with dependent, A&A); pension offsets income.

~$155,356 (net worth limit).

High veteran demand in rural/urban areas.

Who we are

Your Senior Care Partner, Every Step of the Way

We help families find affordable senior communities and unlock same day discounts, Medicaid, and Medicare options tailored to your needs.

Contact us Today