The Oaks of Pasadena
Nursing Home, Independent Living & Assisted Living · Pasadena, CA
CMS overall rating Info The Overall CMS Rating is scored from 1 to 5 stars and combines results from health inspections, staffing levels, and quality measures. Health inspections carry the most weight. Staffing and quality scores can increase or decrease the final rating based on performance compared to state and national standards.

The Oaks of Pasadena

Nursing Home, Independent Living & Assisted Living · Pasadena, CA
CMS overall rating Info The Overall CMS Rating is scored from 1 to 5 stars and combines results from health inspections, staffing levels, and quality measures. Health inspections carry the most weight. Staffing and quality scores can increase or decrease the final rating based on performance compared to state and national standards.
Calculator: See prices in your area
The Oaks of Pasadena accepts Medicare, Medicaid, and private pay.

Overview of The Oaks of Pasadena

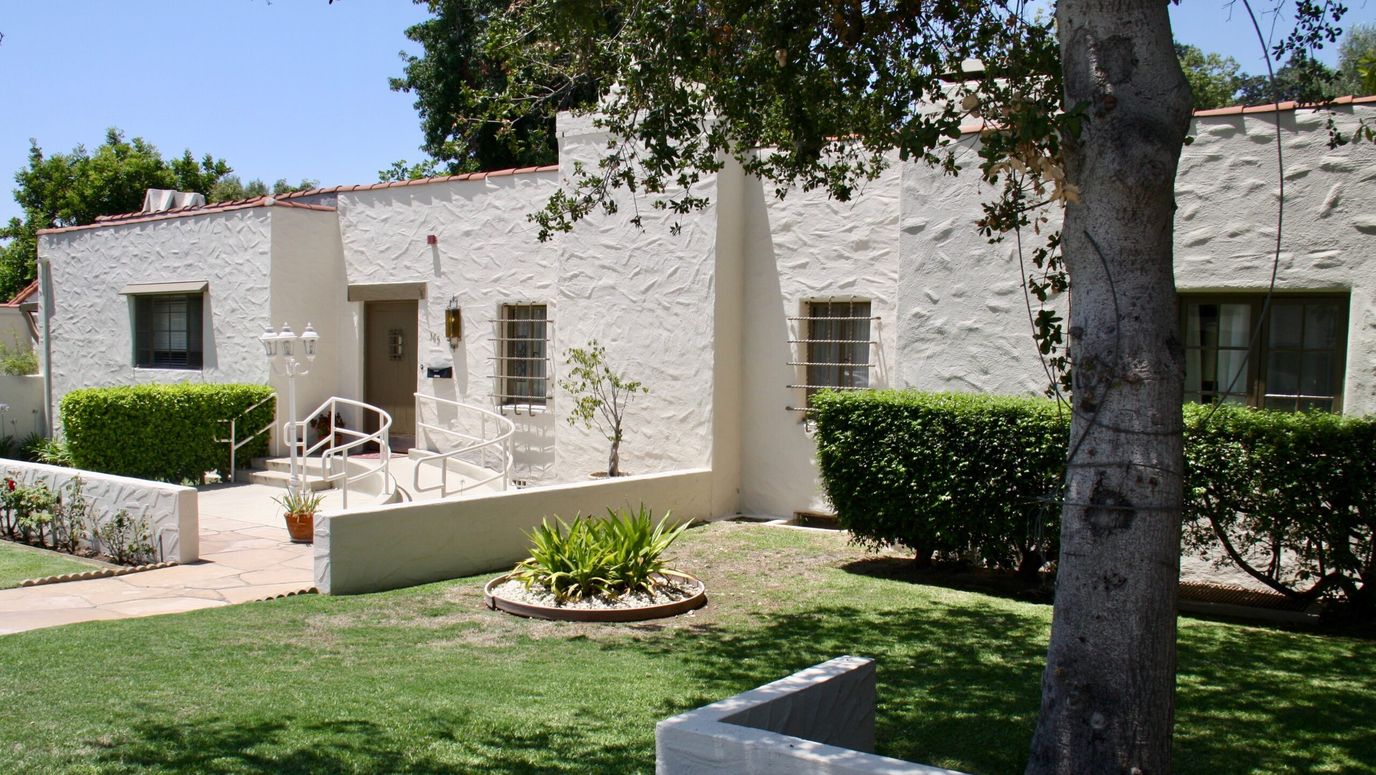
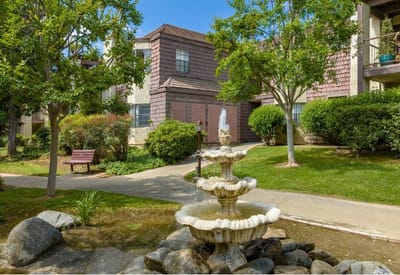
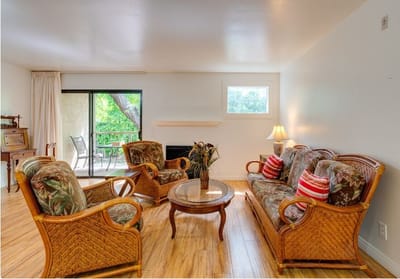
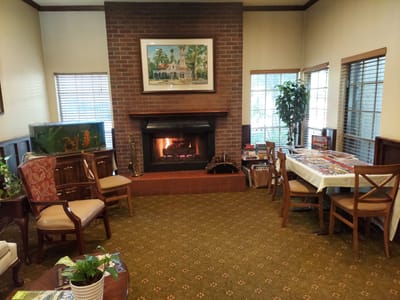
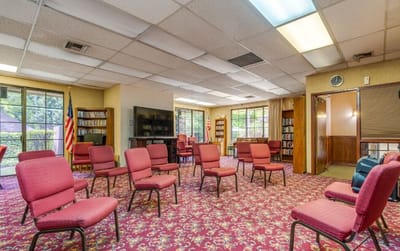
Providing care since 1981, The Oaks of Pasadena is an idyllic retreat in East Del Mar Boulevard, Pasadena, CA, that focuses on independent living and assisted living. With its dedication to improving residents’ living experiences, the community features beautifully designed and cozy studio to two-bedroom floor plans. Residents also receive the highest quality of life with round-the-clock care and assistance tailored to their specific needs from a compassionate and well-trained team.

Fun activities and engaging programs are also conducted to foster belongingness and activeness. Here, residents enjoy delightful and healthy meals catering to dietary needs and preferences. Housekeeping, laundry, and maintenance services are provided to ensure a worry-free retirement. The community has plenty of amenities designed to optimize residents’ recreation and safety including an arts and crafts room, a swimming pool, a library, and serene walking paths.

(626) 356-2600

Quality ratings

Measured by Centers for Medicare & Medicaid Services (CMS)

Overall rating Info The Overall CMS Rating combines results from health inspections, staffing levels and quality measures. Health inspections carry the most weight. Staffing and quality scores can increase or decrease the final rating based on performance compared to state and national standards.
▲ 27.0% Above CA avg. ▲ 27.0% Above CA avg.Click the badge to see the full State ranking.Click here to see the full State ranking.
Health Inspection Info Based on the results of the facility's three most recent standard inspections and any complaint investigations. CMS reviews the number, scope, and severity of deficiencies, with more recent findings weighted more heavily.
▲ 78.8% Above CA avg. ▲ 78.8% Above CA avg.Click the badge to see the full State ranking.Click here to see the full State ranking.
Staffing Info Measures average nursing staff hours per resident per day, including Registered Nurses (RNs) and total nursing staff. Ratings are adjusted based on the level of care residents require and are compared to state and national benchmarks.
▼ 68.1% Below CA avg. ▼ 68.1% Below CA avg.Click the badge to see the full State ranking.Click here to see the full State ranking.
Quality Measures Info Based on clinical and physical health indicators reported to CMS, such as hospital readmissions, falls, pressure ulcers, and improvements in mobility. These measures reflect how well residents' health needs are being managed.
▼ 2.1% Below CA avg. ▼ 2.1% Below CA avg.Click the badge to see the full State ranking.Click here to see the full State ranking.

Staffing hours breakdown

Info Daily nursing hours per resident by staff type, reported to CMS. Higher is generally better — compare this facility to state and national averages to see where staffing stands.

Hours per resident per day — compared to California state averages

Total nursing care / resident Info Total adjusted nursing hours per resident per day, combining RN, LPN, and aide time. CMS adjusts this for case-mix so facilities can be fairly compared.
3h 34m per day
This facility California avg (4h 13m per day)
vs California avg
-15%
Staff typeHours / Day / Residentvs state avg
Total Nursing (Weekend) Info Combined nursing hours (RN + LPN + Nurse Aide) per resident per day on weekends. Staffing often drops on weekends — this figure reveals whether the facility maintains adequate coverage outside of weekday hours. 3h 55m per day

Types of Care at The Oaks of Pasadena

Independent Living Assisted Living

Capacity and availability

This home usually has limited availability

Occupancy between 85% and 95% suggests balanced demand.

Higher occupancy than the California average: 84.7%
Occupancy rate 90.3%
Avg. Length of Stay 53 days
Occupancy rate
90.3%
Avg. Length of Stay
53 days
Walk Score
Walk Score: 70 / 100
Very walkable. Most errands can be accomplished on foot, and many essentials are within a short walk.

Contact The Oaks of Pasadena

Staffing Data

Reporting period: April 1 – June 30, 2025 (Q2 2025). Source: CMS Payroll-Based Journal report.

Total staff 170
Employees 71
Contractors 99
Staff to resident ratio 3.86:1
3863536% better than California average
California average ratio: 0.00:1 California average ratio: 0.00:1See full California ranking
Avg staff/day 32
Average shift 7.7 hours
0% compared with California average
California average: 7.7 hours California average shift: 7.7 hoursSee full California ranking
Total staff hours (quarter) 22,416

Nursing staff breakdown

Q2 2025 · Apr 1 – Jun 30 More info This data comes from the CMS Payroll-Based Journal report covering April 1 – June 30, 2025.
Registered Nurse

Manages medical care and health needs.

Total count 4
Average shift length Info Average shift length. Calculated as total hours divided by days worked and average staff per day. 7 hours

No contractors work on this role.

Licensed Practical Nurse

Assists with medical care and medications.

Total count 26
Average shift length Info Average shift length. Calculated as total hours divided by days worked and average staff per day. 7.9 hours

This role is partially covered by contractors.

Certified Nursing Assistant

Helps with daily care and mobility.

Total count 121
Average shift length Info Average shift length. Calculated as total hours divided by days worked and average staff per day. 8 hours

This role is partially covered by contractors.

Contractor staffing

Q2 2025 · Apr 1 – Jun 30 More info This data comes from the CMS Payroll-Based Journal report covering April 1 – June 30, 2025.

Total hours from contractors

5.8%

1,307 contractor hours this quarter

Certified Nursing Assistant: 87 Licensed Practical Nurse: 9 Medical Director: 2 Occupational Therapy Assistant: 1

Staff by category

Q2 2025 · Apr 1 – Jun 30 More info This data comes from the CMS Payroll-Based Journal report covering April 1 – June 30, 2025.
Certified Nursing Assistant348712110,47191100%8
Licensed Practical Nurse179266,07391100%7.9
RN Director of Nursing2021,0166470%8
Physical Therapy Aide2028826875%7.7
Administrator1015126470%8
Nurse Practitioner1015126470%8
Speech Language Pathologist1014896268%7.9
Dental Services Staff1014835864%8.3
Dietitian1014786268%7.7
Registered Nurse4044085156%7
Qualified Social Worker1012726470%4.2
Respiratory Therapy Technician3032614651%5.6
Physical Therapy Assistant2022184448%4
Occupational Therapy Aide1011862426%7.7
Medical Director0221483134%4
Occupational Therapy Assistant011822%4
121 Certified Nursing Assistant
% of Days 100%
26 Licensed Practical Nurse
% of Days 100%
2 RN Director of Nursing
% of Days 70%
2 Physical Therapy Aide
% of Days 75%
1 Administrator
% of Days 70%
1 Nurse Practitioner
% of Days 70%
1 Speech Language Pathologist
% of Days 68%
1 Dental Services Staff
% of Days 64%
1 Dietitian
% of Days 68%
4 Registered Nurse
% of Days 56%
1 Qualified Social Worker
% of Days 70%
3 Respiratory Therapy Technician
% of Days 51%
2 Physical Therapy Assistant
% of Days 48%
1 Occupational Therapy Aide
% of Days 26%
2 Medical Director
% of Days 34%
1 Occupational Therapy Assistant
% of Days 2%

Penalties and fines

Federal penalties imposed by CMS for regulatory violations, including civil money penalties (fines) and denials of payment for new Medicare/Medicaid admissions.

Source: CMS Penalties Database

No penalties in the past 3 years

No civil money penalties or payment denials were reported in the last 3 years.

Quality of care over time

These measures show how residents usually do over time at this home, based on health outcomes and preventive care.

High-risk clinical events score Info A composite score based on pressure ulcers, falls with injury, weight loss, walking ability decline, and activities of daily living decline. 3.0
55% better than California average

California average: 6.6

Functional decline score Info A composite score based on activities of daily living decline, walking ability decline, and incontinence. 3.1
73% better than California average

California average: 11.3

Long-stay resident measures
Need for Help with Daily Activities Increased Info Percent of long-stay residents whose need for help with daily activities has increased 0.0%
100% better than California average

California average: 11.1%

Walking Ability Worsened Info Percent of long-stay residents whose ability to move independently worsened 6.5%
46% better than California average

California average: 12.0%

Low Risk Residents with Bowel/Bladder Incontinence Info Percent of low risk long-stay residents who lose control of their bowels or bladder 2.8%
75% better than California average

California average: 11.3%

Falls with Major Injury Info Percent of long-stay residents experiencing one or more falls with major injury 3.3%
99% worse than California average

California average: 1.7%

High Risk Residents with Pressure Ulcers Info Percent of long-stay high risk residents with pressure ulcers 4.0%
19% better than California average

California average: 5.0%

Urinary Tract Infection Info Percent of long-stay residents with a urinary tract infection 1.2%
5% better than California average

California average: 1.2%

Lost Too Much Weight Info Percent of long-stay residents who lose too much weight 1.3%
69% better than California average

California average: 4.2%

Depressive Symptoms Info Percent of long-stay residents who have depressive symptoms 4.8%
28% better than California average

California average: 6.7%

Antipsychotic Use Info Percent of long-stay residents who received an antipsychotic medication 7.2%
28% better than California average

California average: 10.1%

Pneumococcal Vaccine Info Percent of long-stay residents assessed and appropriately given the pneumococcal vaccine 100.0%
In line with California average

California average: 98.5%

Influenza Vaccine Info Percent of long-stay residents assessed and appropriately given the seasonal influenza vaccine 100.0%
In line with California average

California average: 98.2%

Short-stay resident measures
Pneumococcal Vaccine Info Percent of short-stay residents assessed and appropriately given the pneumococcal vaccine 99.7%
6% better than California average

California average: 94.0%

Antipsychotic medication increase Info Percent of short-stay residents who newly received an antipsychotic medication 1.2%
17% better than California average

California average: 1.5%

Influenza Vaccine Info Percent of short-stay residents assessed and appropriately given the seasonal influenza vaccine 98.7%
6% better than California average

California average: 93.2%

Breakdown by payment type

Medicare

51% of new residents, usually for short-term rehab.

Typical stay 1 - 2 months

Private pay

47% of new residents, often for short stays.

Typical stay 2 - 3 months

Medicaid

2% of new residents, often for long-term daily care.

Typical stay 6 - 7 months

Facility Characteristics

Source: CMS Long-Term Care Facility Characteristics (Data as of Jan 2026)

Total residents 44
Medicare
9
20.5% of residents
Medicaid
24
54.5% of residents
Private pay or other
11
25% of residents

Finances and operations

Privately-owned community
Home revenue
$13.5M
Profit
$1.3M
Privately-owned community
Home revenue
$13.5M
Profit
$1.3M
Payroll costs Info The portion of the home's budget spent on staff, including nurses, caregivers, and other employees who support care and operations.
$5.2M
38.1% of revenue
Other operating costs Info All remaining costs needed to run the home, such as food, utilities, building maintenance, supplies and administrative expenses.
$7.0M
Total costs $12.2M

What does this home offer?

Minimum age icon
Minimum age icon

Minimum Age: 55 Years Old

Pets allowed icon
Pets allowed icon

Pets Allowed

Room sizes icon
Room sizes icon

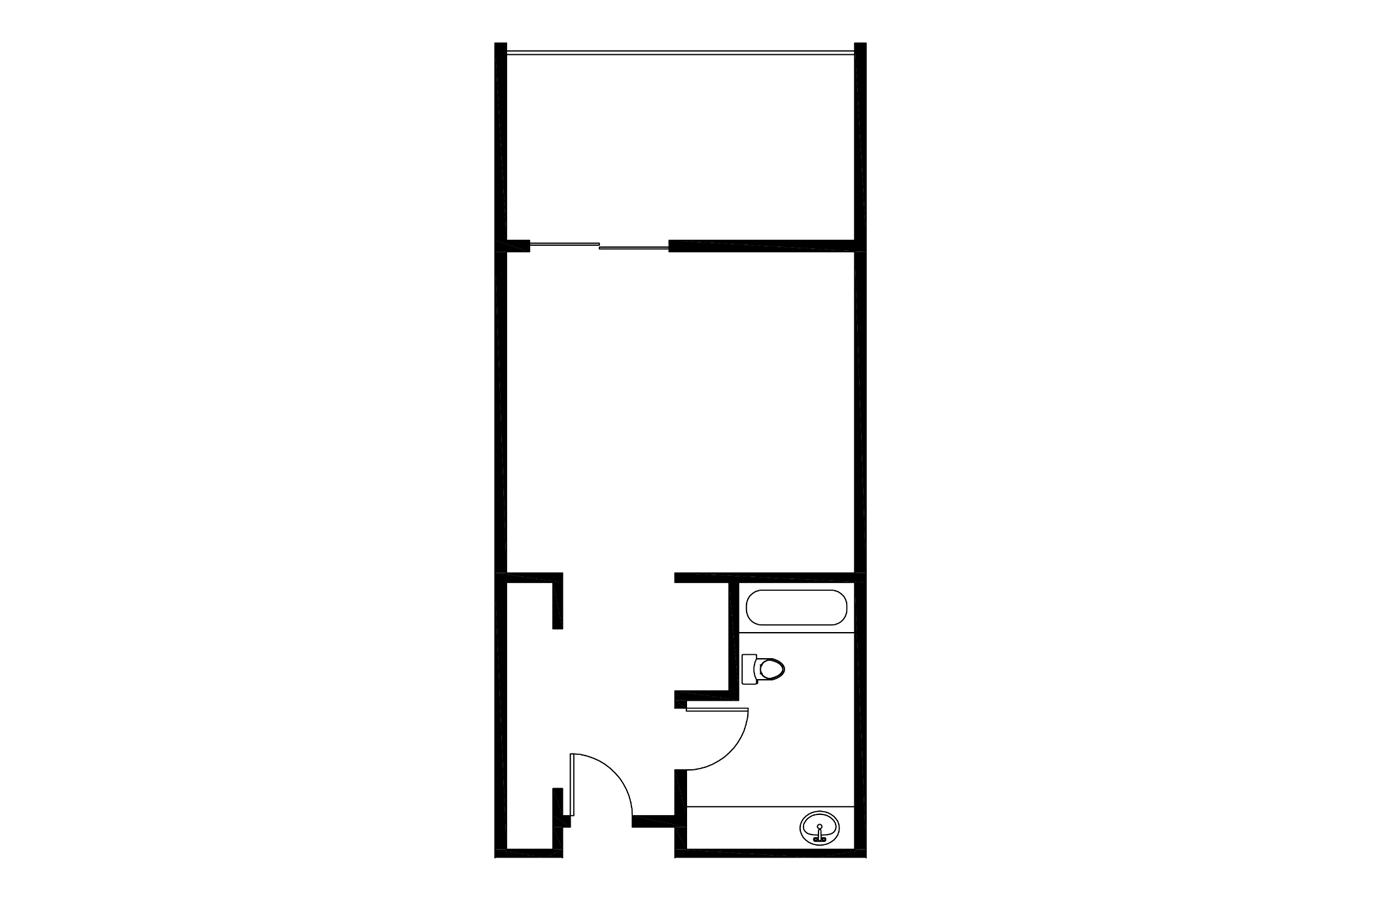
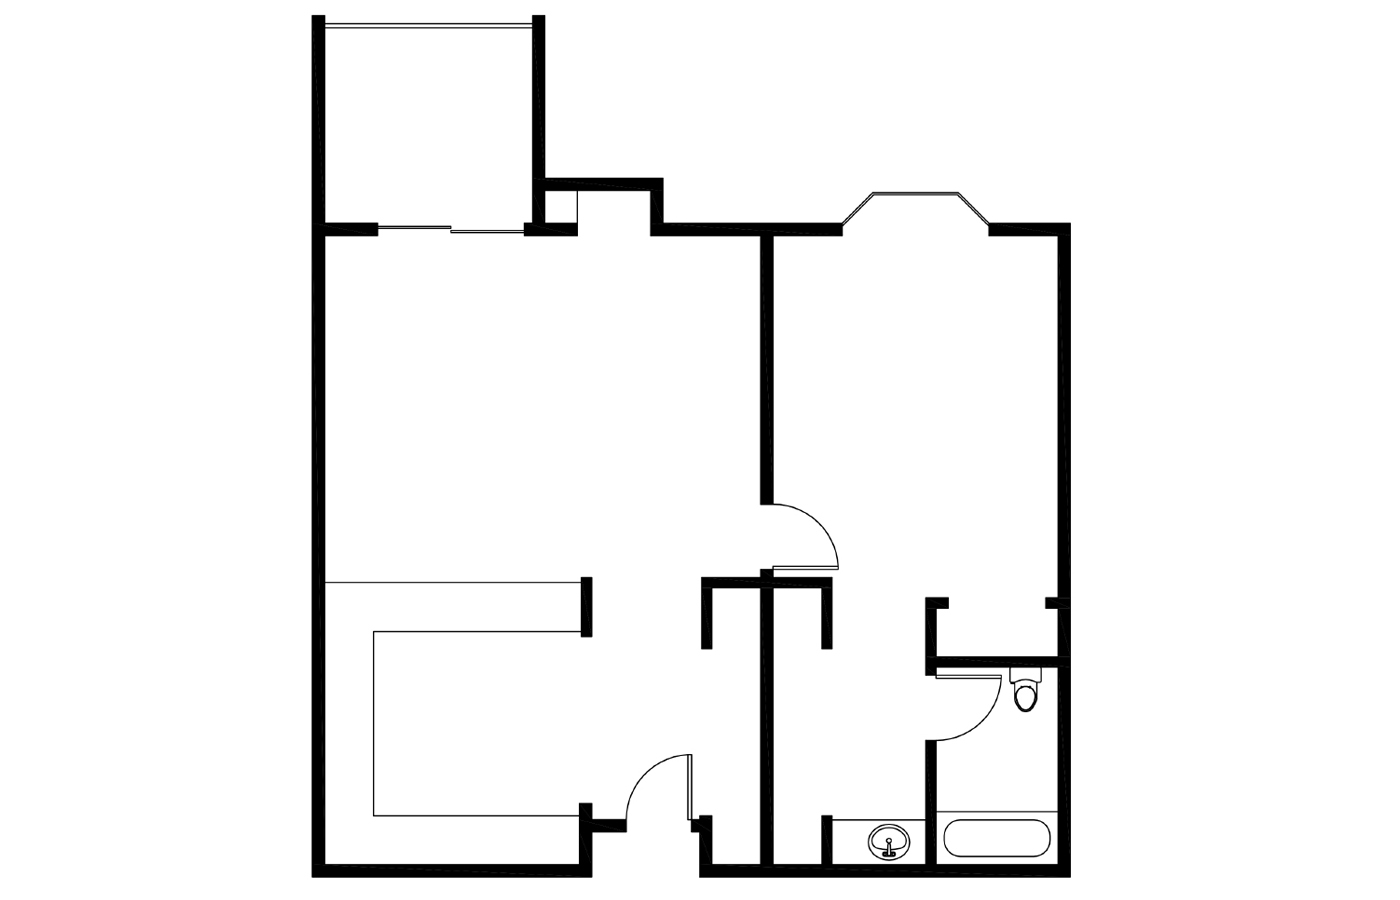
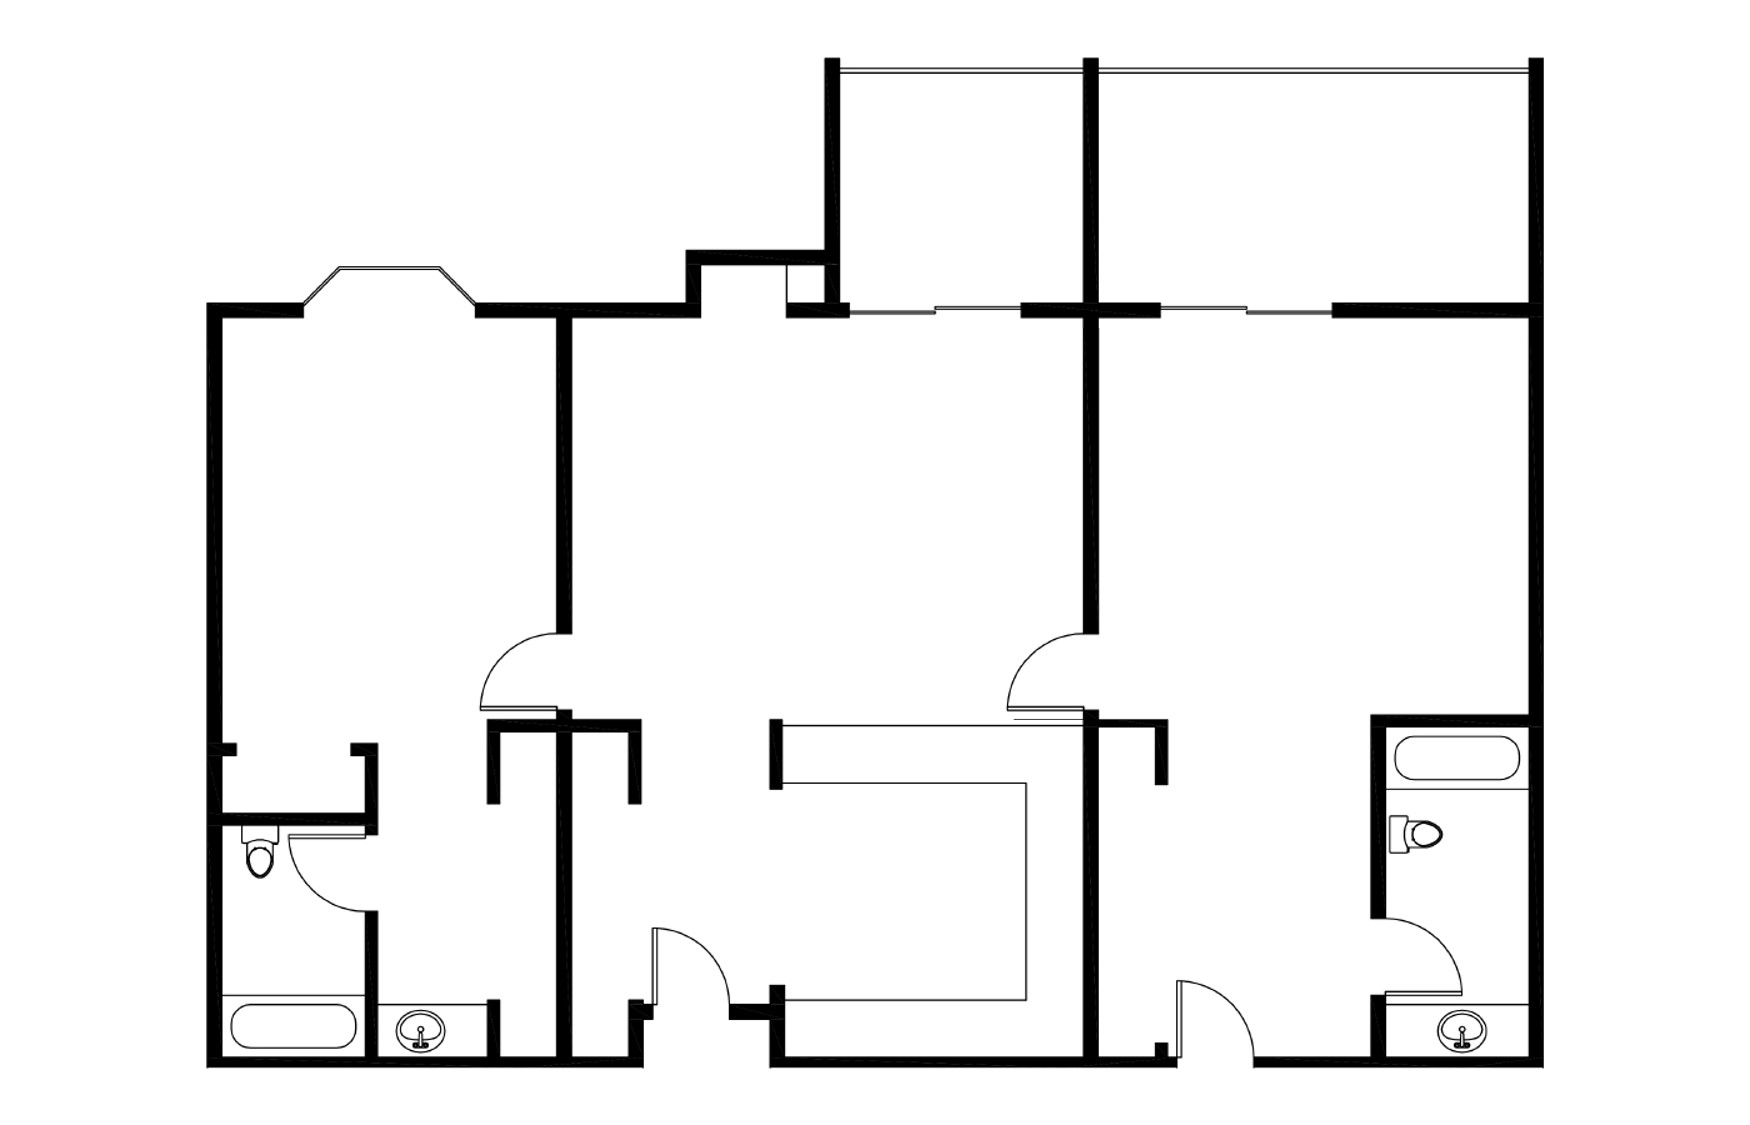
Room Sizes: 480 / 740 / 1,220 / 1,480 sq. ft

Housing options icon

Housing Options: Studio / 1 Bed / 2 Bed Apartments

Building type icon
Building type icon

Building Type: 2-story

Dining services icon

Dining Services

Housekeeping icon
Housekeeping icon

Housekeeping Services

Transportation services icon

Transportation Services

Parking Available icon

Parking Available

Recreational activities icon

Recreational Activities

Exercise program icon

Exercise Programs

Who this home usually serves

TYPE OF STAY

Mostly short-term rehab stays

Most residents typically stay for a few weeks or months before returning home or moving on.

Living Spaces & Floor Plans for The Oaks of Pasadena

Studio Floorplan
One Bedroom 3
Two Bedroom Revised Website Version With Door Between Units

Places of interest near The Oaks of Pasadena

Address 3.8 miles from city center Info Estimated distance in miles from Pasadena's city center to The Oaks of Pasadena's address, calculated via Google Maps.

Calculate Travel Distance to The Oaks of Pasadena

Add your location

Address

Financial Assistance for
Nursing Home in California

The Oaks of Pasadena is located in Pasadena, California.
Here are the financial assistance programs available to residents in California.

Get Financial aid guidance

Multipurpose Senior Services Program

MSSP (Medi-Cal Waiver)

Age 65+
General California resident, Medi-Cal eligible, nursing home risk.
Income Limits (2025) ~$2,829/month 300% FBR, individual
Asset Limits $2,000 (individual), $3,000 (couple).
CA

County-managed; waitlists possible.

Benefits
In-home support (4-6 hours/day) Respite care (14 days/year) Meals (~$6/meal) Transportation (8 trips/month) Care management

In-Home Supportive Services (IHSS)

California IHSS

Age 65+
General California resident, Medicaid-eligible or low-income.
Income Limits ~$1,732/month individual, Medi-Cal threshold
Asset Limits $2,000 individual
CA

Can hire family as caregivers.

Benefits
Personal care (up to 283 hours/month) Homemaker services Respite (varies)

Multipurpose Senior Services Program (MSSP)

CA MSSP

Age 65+
General California resident, Medi-Cal-eligible, nursing home-eligible but community-capable.
Income Limits ~$2,829/month 300% FBR, individual
Asset Limits $2,000 individual
CA

Available in 38 counties; waitlists common.

Benefits
Case management Respite care (up to 10 days/year) Minor home mods (avg. $500) Adult day care (~$50/day)

Property Tax Postponement Program (PTP)

CA PTP

Age 62+
General California resident, own and live in home, 40% equity.
Income Limits (2025) ~$51,500/year household, adjusted annually
Asset Limits Equity-based; no strict asset cap.
CA

Deferred taxes accrue interest (5% as of 2024); repaid upon sale/death.

Benefits
Property tax deferral (avg. $1,000-$3,000/year, varies by county)

Assisted Living Waiver (ALW)

CA ALW

Age 65+ or disabled
General California resident, Medi-Cal-eligible, nursing home-eligible.
Income Limits ~$2,829/month 300% FBR, individual
Asset Limits $2,000 individual
CA

Available in 15 counties (e.g., LA, Sacramento); waitlists common.

Benefits
Personal care in ALFs (5-7 hours/day) Medication management Social services

California CARES Program

CA CARES

Age
General Caregivers of California residents 60+ needing help with 3+ daily activities; no caregiver age limit.
Income Limits No strict limit; cost-sharing above ~$2,500/month threshold.
Asset Limits Not applicable; need-based.
CA

High demand in urban areas; complements IHSS respite.

Benefits
Respite care (up to 10 days/year) Counseling (4-6 sessions/year) Training (2-3 workshops/year) Supplies (~$200/year)

Frequently Asked Questions about The Oaks of Pasadena

What neighborhood is The Oaks of Pasadena in?

The Oaks of Pasadena is in the Lamanda Park neighborhood of Pasadena.

Is The Oaks of Pasadena in a walkable area?

The Oaks of Pasadena has a walk score of 70. Very walkable. Most errands can be accomplished on foot, and many essentials are within a short walk.

What is the address of The Oaks of Pasadena?

The Oaks of Pasadena is located at 2954 E. Del Mar Blvd., Pasadena, CA 91107.

What is the phone number of The Oaks of Pasadena?

(626) 356-2600 will put you in contact with the team at The Oaks of Pasadena.

Is The Oaks of Pasadena Medicare or Medicaid certified?

Yes — The Oaks of Pasadena is a CMS-certified provider of Medicare and Medicaid.

Guides for Better Senior Living

Care Cost Calculator: See Prices in Your Area

Nursing Home Data Explorer

Don’t Wait Too Long: 7 Red Flag Signs Your Parent Needs Assisted Living Now

The True Cost of Assisted Living in 2025 – And How Families Are Paying For It

Understanding Senior Living Costs: Pricing Models, Discounts & Financial Assistance

Explore Open Rooms
1 Contact details
2 What type of senior care service are you looking for?
3 What budget do you have in mind for senior care?
4 How soon do you need to find care?
5 Additional details

Thank you for your interest!

Our team will be in touch shortly to help with next steps.