Explore Open Rooms

1 Contact details
2 What type of senior care service are you looking for?
3 What budget do you have in mind for senior care?
4 How soon do you need to find care?
5 Additional details

Thank you for your interest!

Our team will be in touch shortly to help with next steps.

Nursing Home in Phoenix

CMS overall rating Info The Overall CMS Rating combines results from health inspections, staffing levels and quality measures. Health inspections carry the most weight. Staffing and quality scores can increase or decrease the final rating based on performance compared to state and national standards.

The Palazzo

6250 N 19th Ave, Phoenix, AZ 85015 View map
Overview of The Palazzo

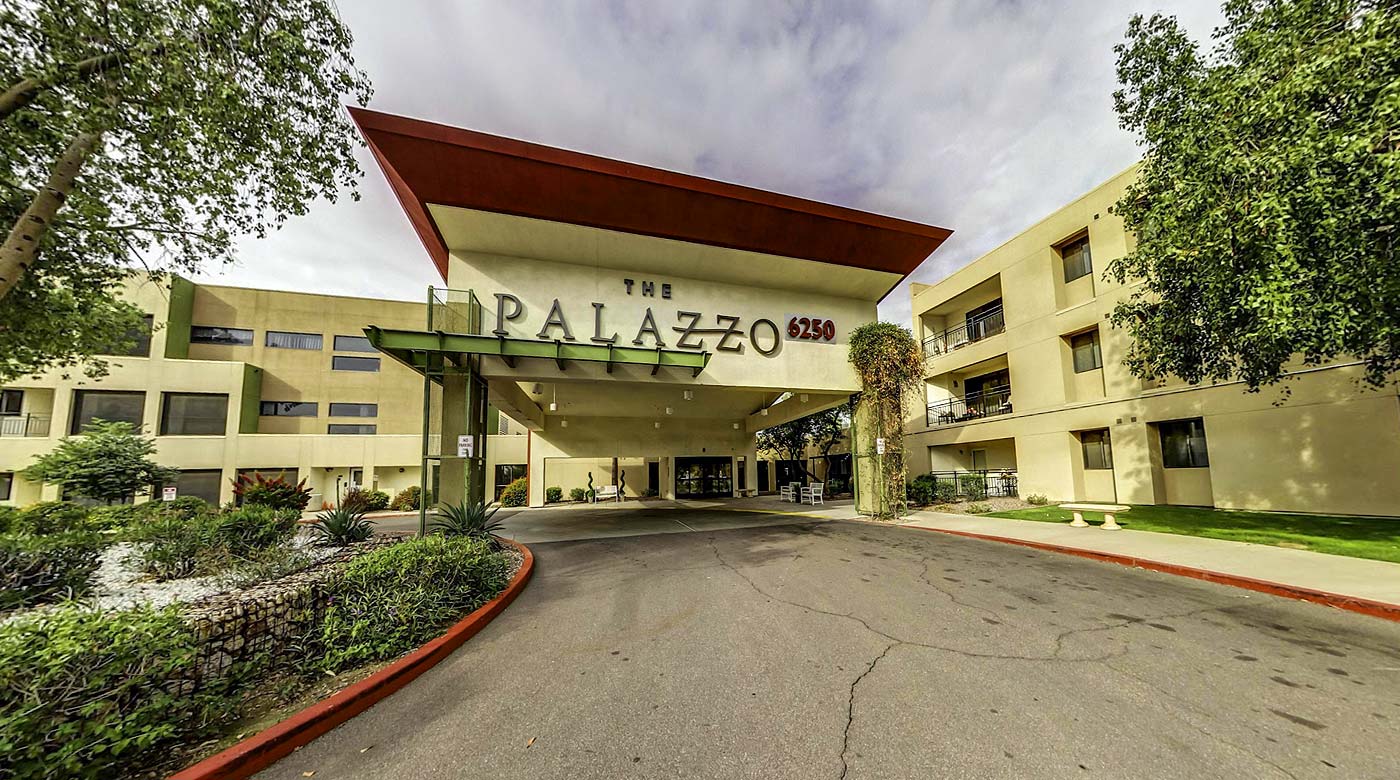
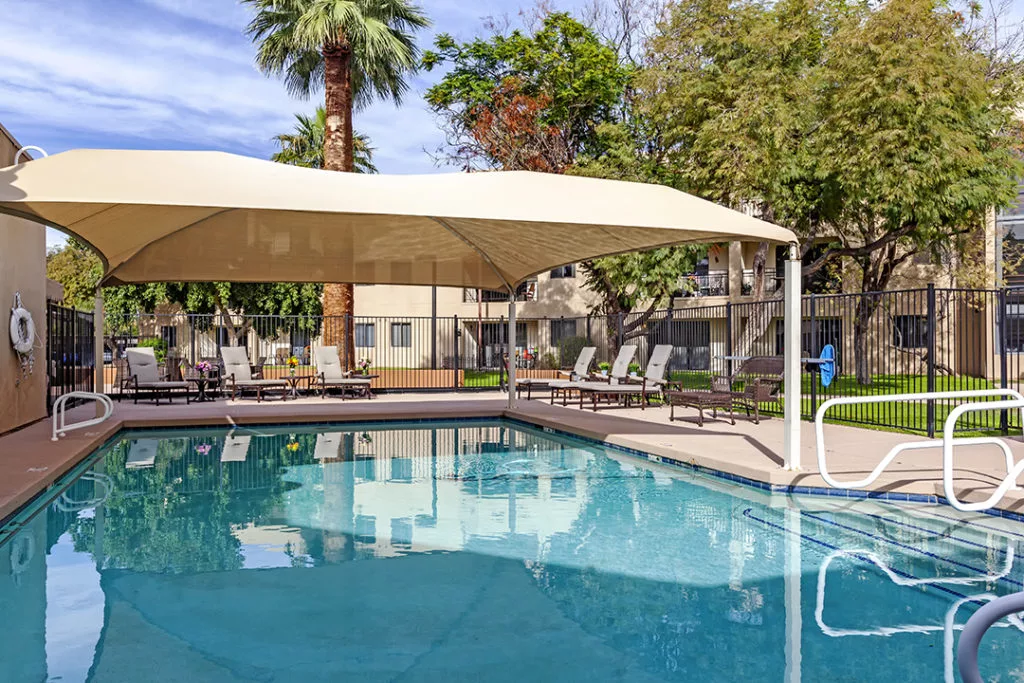
An upscale senior living community in Phoenix,  The Palazzo provides services for independent living, assisted living, memory care, and skilled nursing residents. The skilled nursing department of the senior living home keeps an open mind in the community, ensuring the highest level of support for the residents. The Palazzo understands the importance of meaningful relationships and the importance of family, which is why it highly practices a resident-centered approach to holistic wellness for seniors; where building new friendships and staying close to family is one of the top priorities of the management.
The upscale nursing homes provide state-of-the-art facilities that cater to short-term or long-term residents; they also are guaranteed to feel comfortable and know that they belong in a home that offers 24-hour nursing care with inpatient and outpatient care in a resort-like community with the utmost level of hospitality. The Palazzo boasts a team of in-house medical experts and rehabilitation specialists ready to assist and accommodate any necessary needs that may arise.

(702) 607-7777

Quality ratings

Measured by Centers for Medicare & Medicaid Services (CMS)

Overall rating Info The Overall CMS Rating combines results from health inspections, staffing levels and quality measures. Health inspections carry the most weight. Staffing and quality scores can increase or decrease the final rating based on performance compared to state and national standards.
1/5
Arizona average: 3.5/5
Health Inspection Info Based on the results of the facility's three most recent standard inspections and any complaint investigations. CMS reviews the number, scope, and severity of deficiencies, with more recent findings weighted more heavily.
2/5
Arizona average: 2.8/5
Staffing Info Measures average nursing staff hours per resident per day, including Registered Nurses (RNs) and total nursing staff. Ratings are adjusted based on the level of care residents require and are compared to state and national benchmarks.
1/5
Arizona average: 3.5/5
Quality Measures Info Based on clinical and physical health indicators reported to CMS, such as hospital readmissions, falls, pressure ulcers, and improvements in mobility. These measures reflect how well residents' health needs are being managed.
4/5
Arizona average: 4.6/5

Nursing care per resident

Info This shows how many total hours of nursing staff time are available per resident each day. Higher numbers usually mean more staff support.
3h 29m per day

This home provides 17% less nursing time per resident than the Arizona average.

Arizona average: 4h 11m per day

Staffing hours breakdown

Info Hours of care per resident per day, broken down by staff type. Data from CMS Medicare.
Staff type Facility State avg National avg
Registered Nurse (RN) Info Registered nurse hours per resident per day. 29m per day 43m per day 41m per day
Nurse Aide Info Nurse aide hours per resident per day. 2h 11m per day 2h 22m per day 2h 21m per day
Total Nursing (Weekend) Info Total number of nurse staff hours per resident per day on weekends. 3h 20m per day 3h 38m per day 3h 26m per day
Physical Therapist Info Physical therapist staff hours per resident per day. 10m per day 6m per day 4m per day
RN (Weekend) Info Registered nurse hours per resident per day on weekends. 26m per day 31m per day 29m per day

Capacity and availability

Smaller home

May offer a more intimate, personalized care environment.

Total beds 66

This home usually has availability

Lower occupancy suggests more openings may be available.

Lower demand than the Arizona average
Occupancy rate 79.6%
Residents per day (avg) 54
Occupancy rate
79.6%
Residents per day (avg)
54

Who this home usually serves

TYPE OF STAY

Primarily long-term care, limited rehab

Most residents stay long-term, while a smaller portion are admitted for short-term rehab.

Might be optimal for
Long-term residence Daily assistance Occasional rehab needs

Breakdown by payment type

Medicare

18% of new residents, usually for short-term rehab.

Typical stay 17 days

Private pay

61% of new residents, often for short stays.

Typical stay 26 days

Medicaid

22% of new residents, often for long-term daily care.

Typical stay 9 - 10 months

Finances and operations

Privately-owned community
Operated by a business corporation.
Home revenue
$5.7M
Operating loss
-$2.9M
Privately-owned community Operated by a business corporation.
Home revenue
$5,713,303.00
Operating loss
$-2,948,107.00
Payroll costs Info The portion of the home's budget spent on staff, including nurses, caregivers, and other employees who support care and operations.
$3.4M
59.1% of revenue
Other operating costs Info All remaining costs needed to run the home, such as food, utilities, building maintenance, supplies and administrative expenses.
$4.0M
Total costs $7.4M
Bed community size
66-bed community
A moderately sized community that may balance personal attention with shared amenities and social activities.
Years in operation
1 year in operation
A newer community that may feature more recent facilities and programs.
Walk Score
Walk Score: 68 / 100
Moderately walkable. Some errands can be accomplished on foot, with a mix of nearby amenities.

Services

Directed Care Services (capacity: 236)
Directed Care Services (capacity: 66)
Personal Care Services
Supervisory Care Services

About this community

Occupancy

Occupancy rate
80%
In line with Arizona average
Occupied beds
53 / 66
Average residents 84 per day

License Details

Facility TypeAssisted Living Center
StatusActive
IssuanceSeptember 26, 2024
ExpirationSeptember 25, 2026

Additional Licensing Details

License NumberAL13211C
CMS Certification Number35116
QualificationHealth Care

Ownership & Operating Entity

The Palazzo is administrated by Charles B Kerby.

Types of Care at The Palazzo

Independent Living Assisted Living Nursing Home Memory Care
Contact The Palazzo

Inspection History

In Arizona, the Department of Health Services, Bureau of Long Term Care Licensing performs regular onsite inspections and investigates complaints for all licensed residential and nursing facilities.

5 visits/inspections

3 complaint inspections

Arizona average: 6 complaint visits

Arizona average: 5 inspections

3 complaints

Formal expressions of dissatisfaction or concern made by residents, or their families regarding various aspects of the care, services, and environment provided.

Arizona average: 6 complaints

Latest inspection

Date October 16, 2025
Complaint;Compliance (Annual)
Results No deficiencies

Inspection Report Summary for The Palazzo

The most recent inspection on October 16, 2025, found no deficiencies during the complaint investigation. Earlier inspections also showed no deficiencies, including complaint investigations and reviews related to capacity changes and ownership. Inspectors did not cite any issues related to resident care, safety, or documentation in these reports. Complaint investigations were consistently unsubstantiated, with no enforcement actions or fines listed in the available reports. This pattern indicates stable compliance with regulatory requirements over time.

Health Inspection History

Inspections
Total health inspections 3

Arizona average 6.3


Last Health inspection on Jun 2025

Total health citations 30

Arizona average 23.2

Citations per inspection
10

Arizona average 3.82


Health citations are formal notices following inspections when they fail to comply with safety and care standards.

23 of 30 citations resulted from standard inspections; 5 of 30 resulted from complaint investigations; and 2 of 30 came from combined inspections (standard and complaint).

Breakdown of citation severity (last 3 years)
Critical Health citations More info 0
100% better than Arizona average

Arizona average: 0.1


Serious Health citations More info 0
100% better than Arizona average

Arizona average: 0.6

0 critical citations More info Arizona average: 0.1

0 serious citations More info Arizona average: 0.6

30 moderate citations More info Arizona average: 22.3

0 minor citations More info Arizona average: 0.2
Citations history (last 3 years)
Abuse/Neglect moderate citation Info Issues related to protecting resident's from harm, including abuse, neglect, or mistreatment. Jun 27, 2025
Corrected

Abuse/Neglect moderate citation Info Issues related to protecting resident's from harm, including abuse, neglect, or mistreatment. Jun 27, 2025
Corrected

Infection Control moderate citation Info Issues related to preventing and controlling infections, including hygiene practices and safety protocols. Jun 27, 2025
Corrected

Nursing Services moderate citation Info Issues related to the availability and quality of nursing staff and the care they provide. Jun 27, 2025
Corrected

Compare Nursing Homes around Phoenix The information below is reported by the Arizona Department of Health Services, Bureau of Long Term Care Licensing.

5 facilities compared · CMS & AZ Dept. of Health data · Updated Apr 2026

Filter by care type
Acacia Health Center at Sagewood
AL

Assisted Living A licensed, long-term care setting for seniors or individuals with disabilities who need help with daily activities — like bathing, dressing, and medication management — but not 24-hour skilled nursing. Offers housing, meals, and around-the-clock support while aiming to maximize resident independence.

IL

Independent Living Lifestyle-focused communities for older adults offering dining, activities, and transportation with minimal personal care. Best for active, independent seniors who want community without medical support.

MC

Memory Care Secured, specialized care for people living with Alzheimer's or dementia. Staff trained in cognitive impairment, with higher staff-to-resident ratios and an environment designed to reduce confusion and wandering risk.

NH

Nursing Home Licensed facility providing 24/7 skilled nursing care for residents with complex, ongoing medical needs. Staffed by RNs, LPNs, and CNAs. Inspected and star-rated annually by CMS. Accepts Medicare (short-term rehab) and Medicaid (long-term care).

Phoenix (Desert Ridge West)
156
85.3%
+17%
5.51
+87%
+36%
0
3
3.0
0
73
A+
15
Lcs Desert Ridge Llc
$22.3M
$17.6M
78.9%
35279
Christian Care Nursing Center
AL

Assisted Living A licensed, long-term care setting for seniors or individuals with disabilities who need help with daily activities — like bathing, dressing, and medication management — but not 24-hour skilled nursing. Offers housing, meals, and around-the-clock support while aiming to maximize resident independence.

MC

Memory Care Secured, specialized care for people living with Alzheimer's or dementia. Staff trained in cognitive impairment, with higher staff-to-resident ratios and an environment designed to reduce confusion and wandering risk.

NH

Nursing Home Licensed facility providing 24/7 skilled nursing care for residents with complex, ongoing medical needs. Staffed by RNs, LPNs, and CNAs. Inspected and star-rated annually by CMS. Accepts Medicare (short-term rehab) and Medicaid (long-term care).

Phoenix (North Mountain Village)
68
25.5%
-65%
-
-
-
-
0
10
3.3
0
4
A+
50
Christian Care Managment Inc
$2.0M
$1.3M
69%
35173
Desert Highlands Care Center
NH

Nursing Home Licensed facility providing 24/7 skilled nursing care for residents with complex, ongoing medical needs. Staffed by RNs, LPNs, and CNAs. Inspected and star-rated annually by CMS. Accepts Medicare (short-term rehab) and Medicaid (long-term care).

Kingman
120
62.1%
-15%
4.08
+3%
0%
0
30
3.3
0
71
-
54
Kinney, Patrick
$8.2M
$3.4M
41.3%
35169
La Estancia Nursing and Rehabilitation Center
AL

Assisted Living A licensed, long-term care setting for seniors or individuals with disabilities who need help with daily activities — like bathing, dressing, and medication management — but not 24-hour skilled nursing. Offers housing, meals, and around-the-clock support while aiming to maximize resident independence.

IL

Independent Living Lifestyle-focused communities for older adults offering dining, activities, and transportation with minimal personal care. Best for active, independent seniors who want community without medical support.

MC

Memory Care Secured, specialized care for people living with Alzheimer's or dementia. Staff trained in cognitive impairment, with higher staff-to-resident ratios and an environment designed to reduce confusion and wandering risk.

NH

Nursing Home Licensed facility providing 24/7 skilled nursing care for residents with complex, ongoing medical needs. Staffed by RNs, LPNs, and CNAs. Inspected and star-rated annually by CMS. Accepts Medicare (short-term rehab) and Medicaid (long-term care).

Phoenix (Ahwatukee Foothills Village)
159
55.9%
-23%
3.17
-80%
-22%
0
43
4.8
0
116
A+
81
Qamar, Waqas
$4.7M
$2.0M
42.7%
35270
The Palazzo
AL

Assisted Living A licensed, long-term care setting for seniors or individuals with disabilities who need help with daily activities — like bathing, dressing, and medication management — but not 24-hour skilled nursing. Offers housing, meals, and around-the-clock support while aiming to maximize resident independence.

IL

Independent Living Lifestyle-focused communities for older adults offering dining, activities, and transportation with minimal personal care. Best for active, independent seniors who want community without medical support.

MC

Memory Care Secured, specialized care for people living with Alzheimer's or dementia. Staff trained in cognitive impairment, with higher staff-to-resident ratios and an environment designed to reduce confusion and wandering risk.

NH

Nursing Home Licensed facility providing 24/7 skilled nursing care for residents with complex, ongoing medical needs. Staffed by RNs, LPNs, and CNAs. Inspected and star-rated annually by CMS. Accepts Medicare (short-term rehab) and Medicaid (long-term care).

Phoenix (Leescroft)
60
79.6%
+9%
3.49
-33%
-14%
0
30
10.0
0
54
-
68
Lifehouse Investors V Llc
$4.9M
$3.4M
68.6%
35116

Places of interest near The Palazzo

Address 8.2 miles from city center — 3.43 miles to nearest hospital (HonorHealth John C. Lincoln Medical Center)

Address 6250 N 19th Ave, Phoenix, AZ 85015

Calculate Travel Distance to The Palazzo

Add your location

Address

Staffing Data (Q2 2025)

This data corresponds to Q2 2025 and is based on CMS Payroll-Based Journal.

Total staff 90
Employees 90
Contractors 0
Staff to resident ratio 1.55:1
15% worse than Arizona average

Arizona average ratio: 1.83:1

Avg staff/day 30
Average shift 8.5 hours
0% compared with Arizona average

Arizona average: 8.5 hours

Total staff hours (quarter) 23,304
Nursing staff breakdown
Registered Nurse

Manages medical care and health needs.

Total count 6
Average shift length Info Average shift length. Calculated as total hours divided by days worked and average staff per day. 9.2 hours

No contractors work on this role.

Licensed Practical Nurse

Assists with medical care and medications.

Total count 22
Average shift length Info Average shift length. Calculated as total hours divided by days worked and average staff per day. 10.3 hours

No contractors work on this role.

Certified Nursing Assistant

Helps with daily care and mobility.

Total count 43
Average shift length Info Average shift length. Calculated as total hours divided by days worked and average staff per day. 8.5 hours

No contractors work on this role.

Contractor staffing

Total hours from contractors

0%

0 contractor hours this quarter

No contractor roles were reported this quarter.

Staff by category
Certified Nursing Assistant4304310,81291100%8.5
Licensed Practical Nurse220225,46091100%10.3
Registered Nurse6061,3688391%9.2
Other Dietary Services Staff4041,3188998%7.5
Dental Services Staff2021,0456774%8.4
Respiratory Therapy Technician3037797481%6
Physical Therapy Assistant3036278593%5.5
Administrator1015126470%8
Nurse Practitioner1015126470%8
RN Director of Nursing1015005662%8.9
Qualified Social Worker1012735257%5.3
Speech Language Pathologist202731011%7.3
Clinical Nurse Specialist1012433%8
43 Certified Nursing Assistant
% of Days 100%
22 Licensed Practical Nurse
% of Days 100%
6 Registered Nurse
% of Days 91%
4 Other Dietary Services Staff
% of Days 98%
2 Dental Services Staff
% of Days 74%
3 Respiratory Therapy Technician
% of Days 81%
3 Physical Therapy Assistant
% of Days 93%
1 Administrator
% of Days 70%
1 Nurse Practitioner
% of Days 70%
1 RN Director of Nursing
% of Days 62%
1 Qualified Social Worker
% of Days 57%
2 Speech Language Pathologist
% of Days 11%
1 Clinical Nurse Specialist
% of Days 3%

Facility Characteristics

Source: CMS Long-Term Care Facility Characteristics (Data as of Jan 2026)

Total census
58 residents
Residents by payment source
Medicare
18 residents (31%)
Medicaid
33 residents (56.9%)
Private pay or other
7 residents (12.1%)
Programs & Services
Residents' Group

Residents meet regularly to discuss policies, care quality, and activities

Active Resident Council

Organized group of residents that meets regularly to discuss facility policies, quality of life, and activities.

Quality of care over time

These measures show how residents usually do over time at this home, based on health outcomes and preventive care.

High-risk clinical events score Info A composite score based on pressure ulcers, falls with injury, weight loss, walking ability decline, and activities of daily living decline. 4.1
46% better than Arizona average

Arizona average: 7.6

Functional decline score Info A composite score based on activities of daily living decline, walking ability decline, and incontinence. 9.7
40% better than Arizona average

Arizona average: 16.1

Long-stay resident measures
Significantly above average Arizona avg: 3.7 Info CMS star rating based on long-stay quality measure performance. 5 stars = significantly above average, 1 star = significantly below average.
Need for Help with Daily Activities Increased Info Percent of long-stay residents whose need for help with daily activities has increased 5.9%
47% better than Arizona average

Arizona average: 11.2%

Walking Ability Worsened Info Percent of long-stay residents whose ability to move independently worsened 5.8%
64% better than Arizona average

Arizona average: 15.8%

Low Risk Residents with Bowel/Bladder Incontinence Info Percent of low risk long-stay residents who lose control of their bowels or bladder 17.3%
17% better than Arizona average

Arizona average: 20.8%

Falls with Major Injury Info Percent of long-stay residents experiencing one or more falls with major injury 4.3%
105% worse than Arizona average

Arizona average: 2.1%

High Risk Residents with Pressure Ulcers Info Percent of long-stay high risk residents with pressure ulcers 2.2%
56% better than Arizona average

Arizona average: 5.1%

Urinary Tract Infection Info Percent of long-stay residents with a urinary tract infection 3.2%
137% worse than Arizona average

Arizona average: 1.3%

Lost Too Much Weight Info Percent of long-stay residents who lose too much weight 2.2%
60% better than Arizona average

Arizona average: 5.4%

Depressive Symptoms Info Percent of long-stay residents who have depressive symptoms 0.7%
84% better than Arizona average

Arizona average: 4.5%

Antipsychotic Use Info Percent of long-stay residents who received an antipsychotic medication 7.4%
28% better than Arizona average

Arizona average: 10.3%

Pneumococcal Vaccine Info Percent of long-stay residents assessed and appropriately given the pneumococcal vaccine 97.5%
In line with Arizona average

Arizona average: 97.2%

Influenza Vaccine Info Percent of long-stay residents assessed and appropriately given the seasonal influenza vaccine 88.1%
7% worse than Arizona average

Arizona average: 94.6%

Short-stay resident measures
Significantly above average Arizona avg: 4.3 Info CMS star rating based on short-stay quality measure performance. 5 stars = much above average, 1 star = much below average.
Pneumococcal Vaccine Info Percent of short-stay residents assessed and appropriately given the pneumococcal vaccine 89.4%
In line with Arizona average

Arizona average: 91.5%

Antipsychotic medication increase Info Percent of short-stay residents who newly received an antipsychotic medication 0.5%
50% better than Arizona average

Arizona average: 1.0%

Influenza Vaccine Info Percent of short-stay residents assessed and appropriately given the seasonal influenza vaccine 78.6%
10% worse than Arizona average

Arizona average: 87.3%

Re-hospitalized after SNF stay Info Percentage of short-stay residents who were re-hospitalized after their nursing home admission. 22.1%
10% better than Arizona average

Arizona average: 24.6%

Emergency department visits Info Percentage of short-stay residents who had an outpatient emergency department visit. 12.9%
21% worse than Arizona average

Arizona average: 10.7%

Falls with major injury Info Percentage of SNF residents who experience falls with major injury during their stay. 2.7%
251% worse than Arizona average

Arizona average: 0.8%

Ability to care for self at discharge Info Percentage of residents at or above expected ability to care for themselves at discharge. 43.8%
19% worse than Arizona average

Arizona average: 53.7%

Successful return to home or community Info Rate of successful return to home or community from a skilled nursing facility. 64.3%
27% better than Arizona average

Arizona average: 50.6%

Guides for Better Senior Living

Care Cost Calculator: See Prices in Your Area

Nursing Home Data Explorer

Don’t Wait Too Long: 7 Red Flag Signs Your Parent Needs Assisted Living Now

The True Cost of Assisted Living in 2025 – And How Families Are Paying For It

Understanding Senior Living Costs: Pricing Models, Discounts & Financial Assistance

Financial Aid for Arizona Seniors

Get financial aid guidance

Arizona Long Term Care System

ALTCS

Age 65+ or disabled, Arizona resident, Medicaid-eligible, nursing home-level care need.

~$2,829/month (300% FBR, individual).

$2,000 (individual), $3,000 (couple).

Covers tribal members; rural outreach.

Non-Medical Home and Community Based Services

AZ DES Non-Medical HCBS

Age 60+, Arizona resident, at risk of institutionalization.

~$2,000/month (individual, varies).

$10,000 (individual).

Limited funding; waitlists common.

Senior Community Service Employment Program (SCSEP)

AZ SCSEP

Age 55+, Arizona resident, unemployed, low-income.

~$1,519/month (125% of poverty level, individual).

Not specified; income-driven.

Wages at highest of federal/state/local minimum ($14.35/hour in 2025).

Weatherization Assistance Program (WAP)

AZ WAP

Age 60+ priority, Arizona resident, own/rent home, low-income.

~$2,510/month (200% of poverty level, individual).

Not applicable; income-focused.

High demand in rural desert areas; limited annual funds.

Section 202 Supportive Housing for the Elderly

AZ Section 202

Age 62+, Arizona resident, very low income, able to live independently with support.

~$1,645/month (50% of area median income, individual, varies by county).

$10,000 (individual, excludes home if owned).

Limited units; high demand in metro areas like Phoenix.

Arizona CARES Program

AZ CARES

Caregivers of Arizona residents 60+ needing help with 3+ daily activities; no caregiver age limit.

No strict limit; cost-sharing above ~$2,500/month threshold.

Not applicable; need-based.

Focus on rural access; complements ALTCS respite.

AZ DES Non-Medical Home and Community Based Services (HCBS)

AZ DES Non-Medical HCBS

Age 60+ or disabled, Arizona resident, need assistance with daily activities, not eligible for Medicaid/ALTCS.

Above Medicaid threshold but low-income (~$1,500-$2,500/month, varies by region).

Not specified; income-driven eligibility.

Targets those ineligible for ALTCS; prioritizes rural and tribal areas.

Tour Icon
Planning a tour? Check our touring checklist.
Chat Icon
Thinking of living here? We can help you speak to a current resident