The Pavilion Senior Living
CMS overall rating Info CMS (the Centers for Medicare & Medicaid Services) is the federal agency that rates nursing home quality. Its Overall Rating runs from 1 to 5 stars, combining health inspections, staffing, and quality measures, with inspections weighted most heavily.

The Pavilion Senior Living

CMS overall rating Info CMS (the Centers for Medicare & Medicaid Services) is the federal agency that rates nursing home quality. Its Overall Rating runs from 1 to 5 stars, combining health inspections, staffing, and quality measures, with inspections weighted most heavily.
Calculator: See prices in your area
The Pavilion Senior Living accepts Medicare, Medicaid, and private pay.

Overview of The Pavilion Senior Living

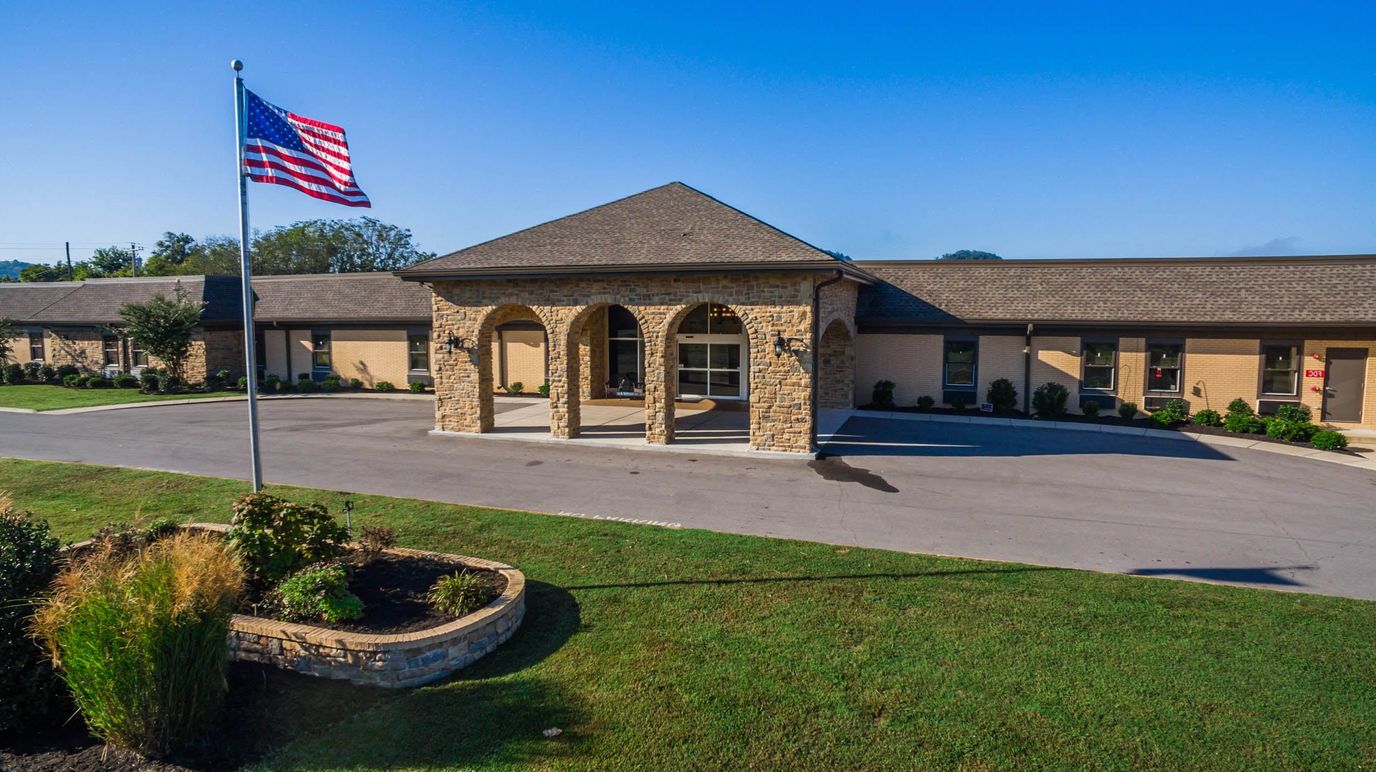
The Pavilion Senior Living is a 74-bed senior living community in Lebanon, Tennessee, offering a wide continuum of care that includes independent living, assisted living, memory care, rehabilitation services, skilled nursing, and respite care. This broad range of support makes the community one of the more comprehensive care options in the area for older adults whose needs may change over time.

One of the community’s key advantages is the ability to provide multiple levels of care within the same setting, which can reduce the stress and disruption often associated with moving between separate care communities as medical or personal care requirements evolve. The community also maintains licensed nurses and certified nursing assistants on staff, supporting both long-term residents and individuals recovering from surgery, illness, or hospitalization. Rehabilitation services and respite stays are also available, making the community a practical option for families seeking temporary recovery support or short-term caregiver relief.

Located on Medical Center Drive in Lebanon, the community sits in a largely car-dependent area with limited walkability to nearby errands or services. Transportation planning may therefore be an important consideration for residents and visiting family members.

The Pavilion Senior Living is a practical option for older adults and families looking for flexibility and long-term continuity in care planning. For families navigating post-acute recovery, progressive memory loss, or future care uncertainty, the community’s broad service model offers a level of adaptability that is not always available in smaller or single-focus senior living settings.

(615) 444-5556

Quality ratings

Measured by Centers for Medicare & Medicaid Services (CMS)

Overall rating Info The Overall CMS Rating combines results from health inspections, staffing levels and quality measures. Health inspections carry the most weight. Staffing and quality scores can increase or decrease the final rating based on performance compared to state and national standards.
▲ 63.4% Above TN avg. ▲ 63.4% Above TN avg.Click the badge to see the full State ranking.Click here to see the full State ranking.
Health Inspection Info Based on the results of the facility's three most recent standard inspections and any complaint investigations. CMS reviews the number, scope, and severity of deficiencies, with more recent findings weighted more heavily.
▲ 37.0% Above TN avg. ▲ 37.0% Above TN avg.Click the badge to see the full State ranking.Click here to see the full State ranking.
Staffing Info Measures average nursing staff hours per resident per day, including Registered Nurses (RNs) and total nursing staff. Ratings are adjusted based on the level of care residents require and are compared to state and national benchmarks.
▲ 63.3% Above TN avg. ▲ 63.3% Above TN avg.Click the badge to see the full State ranking.Click here to see the full State ranking.
Quality Measures Info Based on clinical and physical health indicators reported to CMS, such as hospital readmissions, falls, pressure ulcers, and improvements in mobility. These measures reflect how well residents' health needs are being managed.
▲ 34.0% Above TN avg. ▲ 34.0% Above TN avg.Click the badge to see the full State ranking.Click here to see the full State ranking.

Staffing hours breakdown

Info Daily nursing hours per resident by staff type, reported to CMS. Higher is generally better — compare this facility to state and national averages to see where staffing stands.

Hours per resident per day — compared to Tennessee state averages

Total nursing care / resident Info This home is ranked 19th out of 172 homes in Tennessee for nurse hours. Total adjusted nursing hours per resident per day, combining RN, LPN, and aide time. CMS adjusts this for case-mix so facilities can be fairly compared.
4h 21m per day
Rank #19 / 172Nurse hours — State benchmarkedThis home is ranked 19th out of 172 homes in Tennessee for nurse hours. Shows adjusted nurse hours per resident per day benchmarked to the Tennessee average, with a ranking across 172 Tennessee SNFs. More hours mean more direct care. The national average is about 3.5 hrs; below 3.0 is a red flag.Click the rank badge to see the full State ranking.Click here to see the full State ranking.
This facility Tennessee avg (3h 40m per day)
vs Tennessee avg
+19%

0 of 1 metrics below state avg

Standout metric Weekend Total Nursing is +8% above state avg
Staff typeHours / Day / Residentvs state avg
Weekend Total Nursing Info Combined nursing hours (RN + LPN + Nurse Aide) per resident per day on weekends. Staffing often drops on weekends — this figure reveals whether the facility maintains adequate coverage outside of weekday hours. 3h 36m per day ▲ 8% State avg: 3h 20m per day · National avg: 3h 25m per day

Capacity and availability

This home usually has limited availability

Higher occupancy than the Tennessee average: 73%
Occupancy rate
89.3% Rank #63 / 303Occupancy rate — State benchmarkedThis home is ranked 63rd out of 303 homes in Tennessee for occupancy rate. Shows this facility's occupancy rate versus the Tennessee average, with its Statewide rank out of 303. Higher occupancy signals strong local demand and financial stability.Click the rank badge to see the full State ranking.Click here to see the full State ranking.
Avg. Length of Stay
74 days
Bed community size
74-bed community Rank #231 / 427Bed count — State benchmarkedThis home is ranked 231st out of 427 homes in Tennessee for bed count. Shows this facility's certified or reported bed count compared to other Tennessee SNFs. Larger communities may offer more amenities, programs, and on-site services for residents and families.Click the rank badge to see the full State ranking.Click here to see the full State ranking.
A moderately sized community that may balance personal attention with shared amenities and social activities.
Walk Score
Walk Score: 2 / 100 Rank #508 / 554Walk Score — State benchmarkedThis home is ranked 508th out of 554 homes in Tennessee for walk score. Shows how walkable this facility's neighborhood is compared to the average Walk Score across Tennessee SNFs. Higher scores benefit residents, families, and staff.Click the rank badge to see the full State ranking.Click here to see the full State ranking.
Car-dependent. Most errands require a car, with limited nearby walkable options.

About this community

License Details

Facility TypeAssisted Care Living Facility
StatusAppl In Process

Ownership & Operating Entity

The Pavilion Senior Living is administrated by Victoria Harrison.

Owner NameThe Pavilion Senior Living At Lebanon

Therapy & Rehabilitation

2 services
Rehabilitation Services
Respite Care

Contact The Pavilion Senior Living

Inspection History

In Tennessee, the Department of Health, Division of Health Care Facilities performs unannounced inspections and investigations to ensure facilities provide high-quality resident care.

Health Inspection History

Inspections since 2018
Total health inspections 3

Tennessee average 3.5


Last Health inspection on Mar 2025

Total health citations
8 Rank #39 / 176Health citations — State benchmarkedThis home is ranked 39th out of 176 homes in Tennessee for health citations. Shows this facility's total health deficiency citations benchmarked to the Tennessee State average, with a ranking across all 176 TN SNFs. Lower citation counts earn a better rank.Click the rank badge to see the full State ranking.Click here to see the full State ranking.

Tennessee average 15.4

Citations per inspection
2.67 Rank #34 / 176Citations per inspection — State benchmarkedThis home is ranked 34th out of 176 homes in Tennessee for citations per inspection. Shows average deficiency citations per CMS inspection for this facility versus the Tennessee mean across 176 SNFs with citation data. Lower is better.Click the rank badge to see the full State ranking.Click here to see the full State ranking.

Tennessee average 4.39


Health citations are formal notices following inspections when they fail to comply with safety and care standards.

All 8 citations resulted from standard inspections.

Breakdown of citation severity (last 8 years)
Critical health citations
0
100% better than Tennessee average

Tennessee average: 1.1


Serious health citations
0
100% better than Tennessee average

Tennessee average: 0.6

0 critical citations Tennessee average: 1.1

0 serious citations Tennessee average: 0.6

8 moderate citations Tennessee average: 13.7

0 minor citations Tennessee average: 0.1
Citations history (last 8 years)
Environmental moderate citation Mar 27, 2025
Corrected

Quality of Care moderate citation Mar 27, 2025
Corrected

Care Planning moderate citation Mar 27, 2025
Corrected

Resident Rights moderate citation Mar 27, 2025
Corrected

Staffing Data

Reporting period: October 1 – December 31, 2025 (Q4 2025). Source: CMS Payroll-Based Journal report.

Total staff 94
Employees 60
Contractors 34
Staff to resident ratio 1.74 : 1
0% compared with Tennessee average
Tennessee average ratio: 1.75 : 1 Tennessee average ratio: 1.75 : 1See full Tennessee ranking
Avg staff/day 37
Average shift 7.7 hours
7% worse than Tennessee average
Tennessee average: 8.3 hours Tennessee average shift: 8.3 hoursSee full Tennessee ranking
Total staff hours (quarter) 26,067

Nursing staff breakdown

Q4 2025 · Oct 1 – Dec 31 More info This data comes from the CMS Payroll-Based Journal report covering October 1 – December 31, 2025.
Registered Nurse

Manages medical care and health needs.

RN Staff Info All 6 RN Staff are full-time employees. No contractors work on this role. 6
Average shift length Info Average shift length. Calculated as total hours divided by days worked and average staff per day. 8.4 hours
Licensed Practical Nurse

Assists with medical care and medications.

LPN Staff Info 15 total: 9 full-time employees and 6 contractors. 15
Average shift length Info Average shift length. Calculated as total hours divided by days worked and average staff per day. 8.4 hours
Certified Nursing Assistant

Helps with daily care and mobility.

CNA Staff Info 47 total: 35 full-time employees and 12 contractors. 47
Average shift length Info Average shift length. Calculated as total hours divided by days worked and average staff per day. 7.4 hours

Contractor staffing

Q4 2025 · Oct 1 – Dec 31 More info This data comes from the CMS Payroll-Based Journal report covering October 1 – December 31, 2025.

Total hours from contractors

12.8%

3,329 contractor hours this quarter

Certified Nursing Assistant: 12 Licensed Practical Nurse: 6 Respiratory Therapy Technician: 5 Physical Therapy Assistant: 3 Qualified Social Worker: 2 Speech Language Pathologist: 2 Physical Therapy Aide: 2 Occupational Therapy Assistant: 1 Medical Director: 1

Staff by category

Q4 2025 · Oct 1 – Dec 31 More info This data comes from the CMS Payroll-Based Journal report covering October 1 – December 31, 2025.
Certified Nursing Assistant35124712,07392100%7.4
Licensed Practical Nurse96153,98692100%8.4
Registered Nurse6062,54492100%8.4
RN Director of Nursing4042,0448188%8.7
Respiratory Therapy Technician0558347683%6.2
Physical Therapy Aide0225156368%8.2
Nurse Practitioner1015046368%8
Physical Therapy Assistant0334987379%6.5
Clinical Nurse Specialist1014895054%9.8
Other Dietary Services Staff1014886166%8
Occupational Therapy Aide1014725964%8
Administrator1014645863%8
Mental Health Service Worker1014626065%7.7
Speech Language Pathologist0224296368%6.8
Qualified Social Worker0222326267%3.7
Occupational Therapy Assistant0113389%4.1
Medical Director011322%1.5
47 Certified Nursing Assistant
% of Days 100%
15 Licensed Practical Nurse
% of Days 100%
6 Registered Nurse
% of Days 100%
4 RN Director of Nursing
% of Days 88%
5 Respiratory Therapy Technician
% of Days 83%
2 Physical Therapy Aide
% of Days 68%
1 Nurse Practitioner
% of Days 68%
3 Physical Therapy Assistant
% of Days 79%
1 Clinical Nurse Specialist
% of Days 54%
1 Other Dietary Services Staff
% of Days 66%
1 Occupational Therapy Aide
% of Days 64%
1 Administrator
% of Days 63%
1 Mental Health Service Worker
% of Days 65%
2 Speech Language Pathologist
% of Days 68%
2 Qualified Social Worker
% of Days 67%
1 Occupational Therapy Assistant
% of Days 9%
1 Medical Director
% of Days 2%

Penalties and fines

Federal penalties imposed by CMS for regulatory violations, including civil money penalties (fines) and denials of payment for new Medicare/Medicaid admissions.

Source: CMS Penalties Database

No penalties in the past 3 years

No civil money penalties or payment denials were reported in the last 3 years.

Quality of care over time

These measures show how residents usually do over time at this home, based on health outcomes and preventive care.

High-risk clinical events score Info A composite score based on pressure ulcers, falls with injury, weight loss, walking ability decline, and activities of daily living decline. 15.3
46% worse than Tennessee average

Tennessee average: 10.5

Functional decline score Info A composite score based on activities of daily living decline, walking ability decline, and incontinence. 30.7
57% worse than Tennessee average

Tennessee average: 19.5

Long-stay resident measures
Need for Help with Daily Activities Increased Info Percent of long-stay residents whose need for help with daily activities has increased 22.8%
42% worse than Tennessee average

Tennessee average: 16.0%

Walking Ability Worsened Info Percent of long-stay residents whose ability to move independently worsened 36.0%
66% worse than Tennessee average

Tennessee average: 21.7%

Low Risk Residents with Bowel/Bladder Incontinence Info Percent of low risk long-stay residents who lose control of their bowels or bladder 33.2%
60% worse than Tennessee average

Tennessee average: 20.7%

Falls with Major Injury Info Percent of long-stay residents experiencing one or more falls with major injury 3.5%
In line with Tennessee average

Tennessee average: 3.7%

High Risk Residents with Pressure Ulcers Info Percent of long-stay high risk residents with pressure ulcers 4.1%
25% better than Tennessee average

Tennessee average: 5.4%

Urinary Tract Infection Info Percent of long-stay residents with a urinary tract infection 1.4%
30% better than Tennessee average

Tennessee average: 2.1%

Lost Too Much Weight Info Percent of long-stay residents who lose too much weight 10.3%
64% worse than Tennessee average

Tennessee average: 6.3%

Depressive Symptoms Info Percent of long-stay residents who have depressive symptoms 0.9%
92% better than Tennessee average

Tennessee average: 11.0%

Antipsychotic Use Info Percent of long-stay residents who received an antipsychotic medication 16.7%
In line with Tennessee average

Tennessee average: 16.5%

Pneumococcal Vaccine Info Percent of long-stay residents assessed and appropriately given the pneumococcal vaccine 97.9%
9% better than Tennessee average

Tennessee average: 89.9%

Influenza Vaccine Info Percent of long-stay residents assessed and appropriately given the seasonal influenza vaccine 94.9%
In line with Tennessee average

Tennessee average: 94.5%

Short-stay resident measures
Pneumococcal Vaccine Info Percent of short-stay residents assessed and appropriately given the pneumococcal vaccine 89.8%
13% better than Tennessee average

Tennessee average: 79.7%

Antipsychotic medication increase Info Percent of short-stay residents who newly received an antipsychotic medication 0.0%
100% better than Tennessee average

Tennessee average: 1.7%

Influenza Vaccine Info Percent of short-stay residents assessed and appropriately given the seasonal influenza vaccine 63.1%
21% worse than Tennessee average

Tennessee average: 79.8%

Breakdown by payment type

Medicare

59% of new residents, usually for short-term rehab.

Typical stay 29 days

Private pay

39% of new residents, often for short stays.

Typical stay 3 - 4 months

Medicaid

1% of new residents, often for long-term daily care.

Typical stay 7 years

Facility Characteristics

Source: CMS Long-Term Care Facility Characteristics (Data as of Jan 2026)

Total residents 54
Medicare
16
29.6% of residents
Medicaid
21
38.9% of residents
Private pay or other
17
31.5% of residents
Programs & Services
Residents Group

Residents meet regularly to discuss policies, care quality, and activities

Active Resident Council

Organized group of residents that meets regularly to discuss facility policies, quality of life, and activities.

Finances and operations

Privately-owned community
Home revenue
$7.2M
Operating loss
-$191.3K
Privately-owned community
Home revenue
$7.2M Rank #152 / 176Revenue — State benchmarkedThis home is ranked 152nd out of 176 homes in Tennessee for revenue. Shows this facility's annual revenue compared to the Tennessee SNF average. Higher revenue generally means more resources for staffing and capital — read alongside Payroll %.Click the rank badge to see the full State ranking.Click here to see the full State ranking.
Operating loss
-$191.3K
Payroll costs Info The portion of the home's budget spent on staff, including nurses, caregivers, and other employees who support care and operations. Rank #143 / 176Payroll — State benchmarkedThis home is ranked 143rd out of 176 homes in Tennessee for payroll. Shows total annual staff payroll benchmarked to the Tennessee average. Higher payroll investment relative to peers often signals better staffing and less reliance on cheaper contract labor.Click the rank badge to see the full State ranking.Click here to see the full State ranking.
$3.5M
49.3% of revenue Rank #64 / 176Payroll % — State benchmarkedThis home is ranked 64th out of 176 homes in Tennessee for payroll %. Shows payroll as a percentage of revenue versus the Tennessee average. Well-run Tennessee SNFs typically land around 50–60% — the top third Statewide. Below 25% may signal understaffing or heavy agency use — read with Staffing ratings.Click the rank badge to see the full State ranking.Click here to see the full State ranking.
Other operating costs Info All remaining costs needed to run the home, such as food, utilities, building maintenance, supplies and administrative expenses.
$3.8M
Total costs $7.4M

Who this home usually serves

TYPE OF STAY

Mostly short-term rehab stays

Most residents typically stay for a few weeks or months before returning home or moving on.

Places of interest near The Pavilion Senior Living

Address 4.4 miles from city center Info Estimated distance in miles from Lebanon's city center to The Pavilion Senior Living's address, calculated via Google Maps.

Calculate Travel Distance to The Pavilion Senior Living

Add your location

Address

Financial Assistance for
Nursing Home in Tennessee

The Pavilion Senior Living is located in Lebanon, Tennessee.
Here are the financial assistance programs available to residents in Tennessee.

Get Financial aid guidance

CHOICES Program

TN Medicaid CHOICES

Age 65+ or disabled
General Tennessee resident, Medicaid-eligible, nursing home-level care need.
Income Limits (2025) ~$2,829/month 300% FBR, individual
Asset Limits $2,000 (individual), $3,000 (couple).
TN

Managed care model; high rural demand.

Benefits
Personal care (5-7 hours/day) Respite (240 hours/year) Adult day care ($65/day) Home modifications ($1,500 avg.)

Tennessee Options for Community Living

TN Options

Age 60+
General Tennessee resident, at risk of nursing home.
Income Limits ~$2,000/month individual, varies
Asset Limits $5,000 individual
TN

Limited funding; rural/urban balance.

Benefits
In-home care (3-5 hours/week) Respite (up to 10 days/year) Transportation (~5 trips/month)

Medicare Savings Program (MSP)

Tennessee Medicare Savings Program

Age 65+ or disabled
General TN resident, Medicare Part A/B.
Income Limits (2025) ~$2,510/month (QMB), ~$3,380/month (SLMB), ~$3,598/month (QI)—individual.
Asset Limits $9,430 (individual), $14,130 (couple).
TN

Three tiers; includes Extra Help for Part D; no waitlist.

Benefits
Covers Part B premiums ($174.70/month) Deductibles ($240/year) Copays (~20%)

Family Caregiver Support Program (FCSP)

Tennessee Family Caregiver Support Program

Age
General Caregivers of 60+ needing care or 55+ caregivers of others; TN resident; functional needs (2+ ADLs).
Income Limits (2025) No strict cap; prioritizes low-income ~$24,980/year
Asset Limits Not assessed; need-based.
TN

Includes grandparent caregivers; high rural demand.

Benefits
Respite (4-6 hours/week or 5 days/year) Adult day care ($60/day) Training Supplies (~$500/year)

VA Aid and Attendance (A&A) and Housebound Benefits

Tennessee VA Aid and Attendance/Housebound

Age 65+ or disabled veteran/spouse
General TN resident, wartime service, need for ADL help (A&A) or homebound.
Income Limits (2025) Net income < ~$1,984/month (veteran with dependent, A&A); pension offsets income.
Asset Limits ~$155,356 net worth limit
TN

High veteran population; supports rural/urban care needs.

Benefits
Cash (~$1,433-$2,642/month veteran, ~$951-$1,318 spouse) for care costs (e.g., in-home, assisted living)

Elderly Nutrition Program

Tennessee Elderly Nutrition Program

Age 60+
General TN resident; no income limit but prioritizes low-income.
Income Limits (2025) None; donations encouraged.
Asset Limits Not assessed.
TN

Serves ~50,000 annually; 200+ congregate sites plus Meals on Wheels.

Benefits
Congregate meals ($5-$7/meal value) at senior centers Home-delivered meals ($5-$7/meal)

Property Tax Relief Program

Tennessee Property Tax Relief Program

Age 65+
General TN resident, homeowner/renter (or widow/er 50+, disabled 18+).
Income Limits (2025) ~$45,000/year household, excludes half of Social Security
Asset Limits Not assessed; income-focused.
TN

Rebates up to $1,000; serves ~100,000 annually.

Benefits
Tax rebates (~$250-$1,000 based on income; e.g., $1,000 if income < $8,000)

Frequently Asked Questions about The Pavilion Senior Living

Who is the owner of The Pavilion Senior Living?

The legal owner and operator of The Pavilion Senior Living is The Pavilion Senior Living at Lebanon.

Is The Pavilion Senior Living in a walkable area?

The Pavilion Senior Living has a walk score of 2. Car-dependent. Most errands require a car, with limited nearby walkable options.

Who is the administrator of The Pavilion Senior Living?

Victoria Harrison is the administrator of The Pavilion Senior Living.

How many beds does The Pavilion Senior Living have?

The Pavilion Senior Living has 74 beds.

Are there photos of The Pavilion Senior Living?

Yes — there are 2 photos of The Pavilion Senior Living in the photo gallery on this page.

What is the address of The Pavilion Senior Living?

The Pavilion Senior Living is located at 1409 Medical Center Drive.

What is the phone number of The Pavilion Senior Living?

(615) 444-5556 will put you in contact with the team at The Pavilion Senior Living.

Guides for Better Senior Living

Care Cost Calculator: See Prices in Your Area

Nursing Home Data Explorer

Don’t Wait Too Long: 7 Red Flag Signs Your Parent Needs Assisted Living Now

The True Cost of Assisted Living in 2025 – And How Families Are Paying For It

Understanding Senior Living Costs: Pricing Models, Discounts & Financial Assistance

Explore Open Rooms
1 Contact details
2 What type of senior care service are you looking for?
3 What budget do you have in mind for senior care?
4 How soon do you need to find care?
5 Additional details

Thank you for your interest!

Our team will be in touch shortly to help with next steps.