The Pointe of North Gables
Nursing Home & Assisted Living · Miami, FL
CMS overall rating Info CMS (the Centers for Medicare & Medicaid Services) is the federal agency that rates nursing home quality. Its Overall Rating runs from 1 to 5 stars, combining health inspections, staffing, and quality measures, with inspections weighted most heavily.

The Pointe of North Gables

Nursing Home & Assisted Living · Miami, FL
CMS overall rating Info CMS (the Centers for Medicare & Medicaid Services) is the federal agency that rates nursing home quality. Its Overall Rating runs from 1 to 5 stars, combining health inspections, staffing, and quality measures, with inspections weighted most heavily.
Calculator: See prices in your area
The Pointe of North Gables accepts Medicare, Medicaid, and private pay.

Overview of The Pointe of North Gables

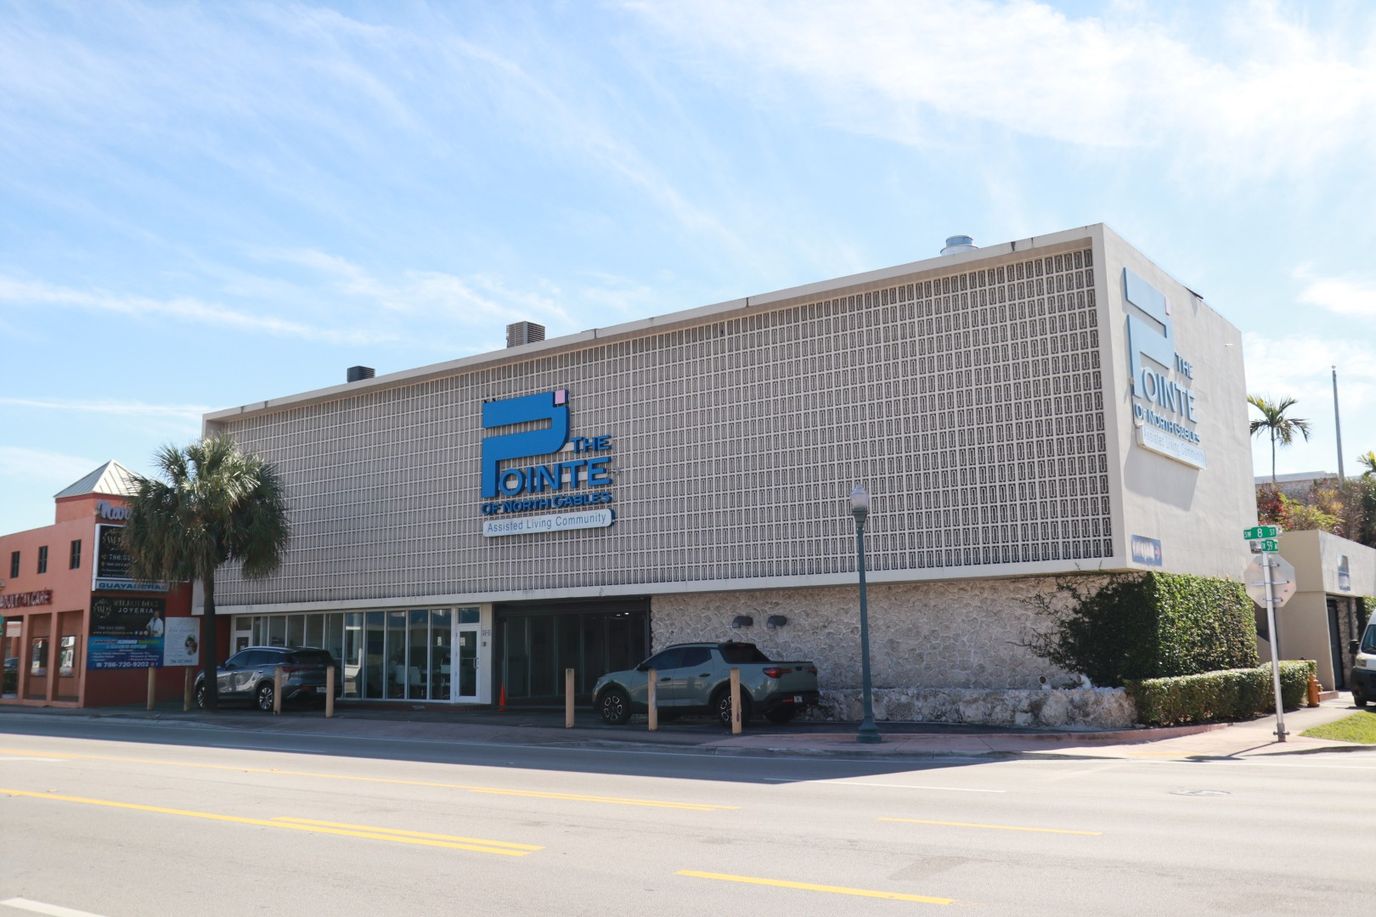
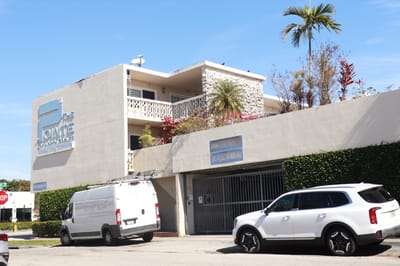
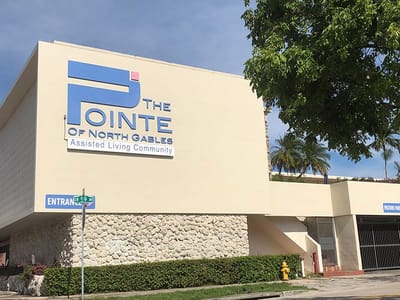
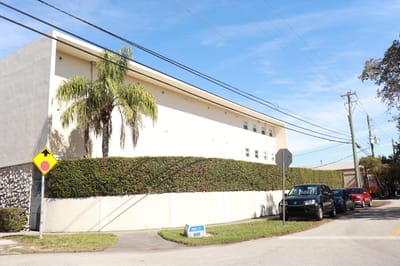
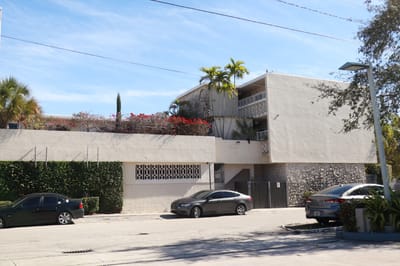
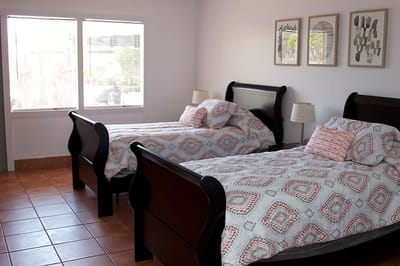
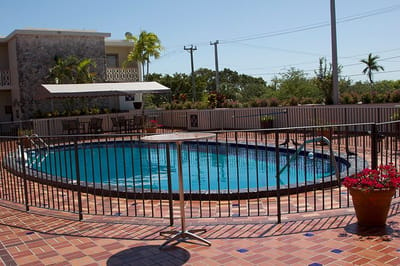
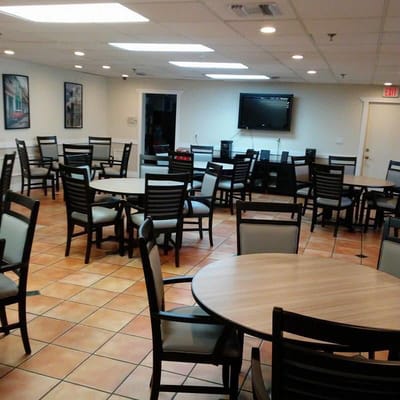
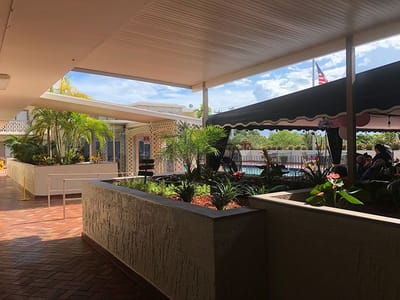
At 5890 SW 8th St in Miami’s Flagami neighborhood, The Pointe of North Gables is a 99-bed nursing home and assisted living facility licensed for Medicare and Medicaid, 6.6 miles from downtown. Privately operated, the community benefits from its very walkable setting (walk score 85) with mixed errands and essential services on foot.

The facility operates primarily as a short-stay model: average stay of 89 days, occupancy at 93.4% (ranked 51st of 255 Florida SNFs), significantly above the average of 84.3%. This occupancy level indicates sustained local demand and operational stability.

Current resident census totals 96: 30.2% Medicare, 61.5% Medicaid, 8.3% private pay. Medicare admissions comprise 27% of new entries, typically staying 2–3 months for post-acute rehabilitation. Private-pay admissions account for 66%, with average stays of just 7 days. Medicaid represents 6% of admissions despite comprising 61.5% of the current census, reflecting longer tenure among Medicaid residents (typical 3-year stays).

Nursing hours/resident/day total 3 hours 42 minutes; 8% below Florida’s 4 hours 2 minutes benchmark, positioning the facility 174th among 252 state nursing homes. Staffing comprises 31 registered nurses, 8 licensed practical nurses, 54 certified nursing aides, supplemented by 5 speech pathologists, 3 respiratory technicians, dental services, and mental health workers. Weekend nursing averages 3 hours 26 minutes/day. Contractors account for 6.8% of total staffing.

Overall rating: 2 stars, 37% below average. Health inspection rating: 2 stars, 28.9% below average. Staffing rating: 4 stars, 18.2% above average. Quality measures: 2 stars, 1.4% below average.

Critically, the facility recorded zero federal penalties over the past three years, indicating sustained regulatory compliance.

Functional decline scores 7.2; 42% better than state benchmark, while activities of daily living degradation affects 9.7% of long-stay residents (8% better than state). Falls with major injury occur in 1.3%, 51% better than average.

Conversely, depressive symptoms appear in 20.1% of residents, 500% worse than the 3.3% average. Pressure ulcers in high-risk residents stand at 7.6%, 42% worse than state. Weight loss reaches 8.4% of residents, 40% above baseline. Short-stay residents newly receiving antipsychotic medication jump to 8.7%, 475% above the average of 1.5%.

The facility reports a net profit of $751.5 thousand on $20.3 million gross revenue, with payroll at 34.4% of revenue; well below the typical 49–56% for financially stable Florida nursing homes.

The Pointe of North Gables accommodates short-term and longer-stay residents across multiple payers with above-average staffing ratings, though with behavioral and mood disorder prevalence.

(305) 441-9700
What you will love about this neighborhood
  • Located west of downtown Miami in Flagami, this neighborhood is known for its Cuban heritage and proximity to the Calle Ocho Walk of Fame.
  • Retirees enjoy vibrant living with its proximity to fun recreational sites like the Coral Gables Museum (3 miles away) and the Venetian Pool (4 miles away).
  • With its Latin American heritage, Flagami has become a dynamic neighborhood that seamlessly blends quiet residential areas and diverse restaurants.

Quality ratings

Measured by Centers for Medicare & Medicaid Services (CMS)

Overall rating Info The Overall CMS Rating combines results from health inspections, staffing levels and quality measures. Health inspections carry the most weight. Staffing and quality scores can increase or decrease the final rating based on performance compared to state and national standards.
▼ 5.5% Below FL avg. ▼ 5.5% Below FL avg.Click the badge to see the full State ranking.Click here to see the full State ranking.
Health Inspection Info Based on the results of the facility's three most recent standard inspections and any complaint investigations. CMS reviews the number, scope, and severity of deficiencies, with more recent findings weighted more heavily.
▲ 6.7% Above FL avg. ▲ 6.7% Above FL avg.Click the badge to see the full State ranking.Click here to see the full State ranking.
Staffing Info Measures average nursing staff hours per resident per day, including Registered Nurses (RNs) and total nursing staff. Ratings are adjusted based on the level of care residents require and are compared to state and national benchmarks.
▲ 18.2% Above FL avg. ▲ 18.2% Above FL avg.Click the badge to see the full State ranking.Click here to see the full State ranking.
Quality Measures Info Based on clinical and physical health indicators reported to CMS, such as hospital readmissions, falls, pressure ulcers, and improvements in mobility. These measures reflect how well residents' health needs are being managed.
▼ 1.4% Below FL avg. ▼ 1.4% Below FL avg.Click the badge to see the full State ranking.Click here to see the full State ranking.

Staffing hours breakdown

Info Daily nursing hours per resident by staff type, reported to CMS. Higher is generally better — compare this facility to state and national averages to see where staffing stands.

Hours per resident per day — compared to Florida state averages

Total nursing care / resident Info This home is ranked 174th out of 252 homes in Florida for nurse hours. Total adjusted nursing hours per resident per day, combining RN, LPN, and aide time. CMS adjusts this for case-mix so facilities can be fairly compared.
3h 42m per day
Rank #174 / 252Nurse hours — State benchmarkedThis home is ranked 174th out of 252 homes in Florida for nurse hours. Shows adjusted nurse hours per resident per day benchmarked to the Florida average, with a ranking across 252 Florida SNFs. More hours mean more direct care. The national average is about 3.5 hrs; below 3.0 is a red flag.Click the rank badge to see the full State ranking.Click here to see the full State ranking.
This facility Florida avg (4h 2m per day)
vs Florida avg
-8%

2 of 6 metrics below state avg

Standout metric Weekend RN is +83% above state avg
Staff typeHours / Day / Residentvs state avg
Registered Nurse (RN) Info RNs hold the highest nursing license and can assess residents, interpret test results, and direct care plans. More RN hours per day often signals stronger clinical oversight and faster response to health changes. 1h 12m per day ▲ 64% State avg: 44m per day · National avg: 41m per day
LPN / LVN Info Licensed Practical Nurses (LPNs) or Licensed Vocational Nurses (LVNs) deliver routine hands-on care — medication administration, wound dressing, and monitoring vital signs. They work under RN supervision and make up a large share of daily bedside care. 20m per day ▼ 58% State avg: 47m per day · National avg: 52m per day
Nurse Aide Info Certified Nurse Aides (CNAs) provide the most direct day-to-day assistance: bathing, dressing, feeding, and mobility. Nurse aide hours are typically the largest staffing category and directly affect residents' quality of life. 2h 35m per day ▲ 10% State avg: 2h 20m per day · National avg: 2h 20m per day
Weekend Total Nursing Info Combined nursing hours (RN + LPN + Nurse Aide) per resident per day on weekends. Staffing often drops on weekends — this figure reveals whether the facility maintains adequate coverage outside of weekday hours. 3h 39m per day ▲ 3% State avg: 3h 32m per day · National avg: 3h 27m per day
Physical Therapist Info Hours per resident per day provided by licensed Physical Therapists (PTs) or PT Assistants. PT services help residents recover mobility after injury or illness and are especially important for post-acute (short-stay) rehabilitation. 5m per day ▼ 15% State avg: 6m per day · National avg: 4m per day
Weekend RN Info Registered nurse hours specifically on weekends. Facilities sometimes reduce RN presence on Saturdays and Sundays — a low weekend RN figure compared to weekday hours can indicate reduced clinical oversight when most administrative staff are absent. 59m per day ▲ 83% State avg: 32m per day · National avg: 29m per day

Capacity and availability

This home usually has limited availability

Higher occupancy than the Florida average: 84.3%
Occupancy rate
93.4% Rank #52 / 256Occupancy rate — State benchmarkedThis home is ranked 52nd out of 256 homes in Florida for occupancy rate. Shows this facility's occupancy rate versus the Florida average, with its Statewide rank out of 256. Higher occupancy signals strong local demand and financial stability.Click the rank badge to see the full State ranking.Click here to see the full State ranking.
Avg. Length of Stay
89 days
Walk Score
Walk Score: 85 / 100 Rank #67 / 1485Walk Score — State benchmarkedThis home is ranked 67th out of 1485 homes in Florida for walk score. Shows how walkable this facility's neighborhood is compared to the average Walk Score across Florida SNFs. Higher scores benefit residents, families, and staff.Click the rank badge to see the full State ranking.Click here to see the full State ranking.
Very walkable. Most errands can be accomplished on foot, and many essentials are within a short walk.

Contact The Pointe of North Gables

Staffing Data

Reporting period: October 1 – December 31, 2025 (Q4 2025). Source: CMS Payroll-Based Journal report.

Total staff 125
Employees 106
Contractors 19
Staff to resident ratio 1.30 : 1
12% fewer staff per resident than Florida average
Florida average ratio: 1.47 : 1 Florida average ratio: 1.47 : 1See full Florida ranking
Avg staff/day 62
Average shift 7.5 hours
5% worse than Florida average
Florida average: 7.9 hours Florida average shift: 7.9 hoursSee full Florida ranking
Total staff hours (quarter) 42,895

Nursing staff breakdown

Q4 2025 · Oct 1 – Dec 31 More info This data comes from the CMS Payroll-Based Journal report covering October 1 – December 31, 2025.
Registered Nurse

Manages medical care and health needs.

RN Staff Info All 31 RN Staff are full-time employees. No contractors work on this role. 31
Average shift length Info Average shift length. Calculated as total hours divided by days worked and average staff per day. 8.2 hours
Licensed Practical Nurse

Assists with medical care and medications.

LPN Staff Info All 8 LPN Staff are full-time employees. No contractors work on this role. 8
Average shift length Info Average shift length. Calculated as total hours divided by days worked and average staff per day. 7.6 hours
Certified Nursing Assistant

Helps with daily care and mobility.

CNA Staff Info All 54 CNA Staff are full-time employees. No contractors work on this role. 54
Average shift length Info Average shift length. Calculated as total hours divided by days worked and average staff per day. 7.7 hours

Contractor staffing

Q4 2025 · Oct 1 – Dec 31 More info This data comes from the CMS Payroll-Based Journal report covering October 1 – December 31, 2025.

Total hours from contractors

6.8%

2,897 contractor hours this quarter

Speech Language Pathologist: 5 Medical Director: 5 Respiratory Therapy Technician: 3 Physical Therapy Aide: 3 Physical Therapy Assistant: 1 Qualified Social Worker: 1 Occupational Therapy Assistant: 1

Staff by category

Q4 2025 · Oct 1 – Dec 31 More info This data comes from the CMS Payroll-Based Journal report covering October 1 – December 31, 2025.
Certified Nursing Assistant5405422,14692100%7.7
Registered Nurse310319,27992100%8.2
Licensed Practical Nurse8082,85492100%7.6
Physical Therapy Aide1341,4687986%7
Dental Services Staff3031,4237885%8
Other Dietary Services Staff3031,2307379%8.1
Speech Language Pathologist0557037177%6.1
Respiratory Therapy Technician0336947582%5.3
Mental Health Service Worker2026726267%8
Administrator1014966267%8
Nurse Practitioner1014966267%8
Clinical Nurse Specialist1014935863%8.5
Dietitian1014325459%8
Qualified Social Worker0113044043%7.6
Medical Director0551295964%1.4
Physical Therapy Assistant011532022%2.6
Occupational Therapy Assistant0112578%3.6
54 Certified Nursing Assistant
% of Days 100%
31 Registered Nurse
% of Days 100%
8 Licensed Practical Nurse
% of Days 100%
4 Physical Therapy Aide
% of Days 86%
3 Dental Services Staff
% of Days 85%
3 Other Dietary Services Staff
% of Days 79%
5 Speech Language Pathologist
% of Days 77%
3 Respiratory Therapy Technician
% of Days 82%
2 Mental Health Service Worker
% of Days 67%
1 Administrator
% of Days 67%
1 Nurse Practitioner
% of Days 67%
1 Clinical Nurse Specialist
% of Days 63%
1 Dietitian
% of Days 59%
1 Qualified Social Worker
% of Days 43%
5 Medical Director
% of Days 64%
1 Physical Therapy Assistant
% of Days 22%
1 Occupational Therapy Assistant
% of Days 8%

Penalties and fines

Federal penalties imposed by CMS for regulatory violations, including civil money penalties (fines) and denials of payment for new Medicare/Medicaid admissions.

Source: CMS Penalties Database

No penalties in the past 3 years

No civil money penalties or payment denials were reported in the last 3 years.

Quality of care over time

These measures show how residents usually do over time at this home, based on health outcomes and preventive care.

High-risk clinical events score Info A composite score based on pressure ulcers, falls with injury, weight loss, walking ability decline, and activities of daily living decline. 7.4
In line with Florida average

Florida average: 7.4

Functional decline score Info A composite score based on activities of daily living decline, walking ability decline, and incontinence. 7.2
42% better than Florida average

Florida average: 12.4

Long-stay resident measures
Need for Help with Daily Activities Increased Info Percent of long-stay residents whose need for help with daily activities has increased 9.7%
8% better than Florida average

Florida average: 10.5%

Walking Ability Worsened Info Percent of long-stay residents whose ability to move independently worsened 10.0%
23% better than Florida average

Florida average: 12.9%

Low Risk Residents with Bowel/Bladder Incontinence Info Percent of low risk long-stay residents who lose control of their bowels or bladder 1.9%
86% better than Florida average

Florida average: 13.5%

Falls with Major Injury Info Percent of long-stay residents experiencing one or more falls with major injury 1.3%
51% better than Florida average

Florida average: 2.6%

High Risk Residents with Pressure Ulcers Info Percent of long-stay high risk residents with pressure ulcers 7.6%
42% worse than Florida average

Florida average: 5.4%

Urinary Tract Infection Info Percent of long-stay residents with a urinary tract infection 0.7%
23% better than Florida average

Florida average: 0.9%

Lost Too Much Weight Info Percent of long-stay residents who lose too much weight 8.4%
40% worse than Florida average

Florida average: 6.0%

Depressive Symptoms Info Percent of long-stay residents who have depressive symptoms 20.1%
500% worse than Florida average

Florida average: 3.3%

Antipsychotic Use Info Percent of long-stay residents who received an antipsychotic medication 6.8%
15% better than Florida average

Florida average: 8.0%

Pneumococcal Vaccine Info Percent of long-stay residents assessed and appropriately given the pneumococcal vaccine 100.0%
In line with Florida average

Florida average: 97.7%

Influenza Vaccine Info Percent of long-stay residents assessed and appropriately given the seasonal influenza vaccine 100.0%
In line with Florida average

Florida average: 99.2%

Short-stay resident measures
Pneumococcal Vaccine Info Percent of short-stay residents assessed and appropriately given the pneumococcal vaccine 99.7%
6% better than Florida average

Florida average: 94.0%

Antipsychotic medication increase Info Percent of short-stay residents who newly received an antipsychotic medication 8.7%
475% worse than Florida average

Florida average: 1.5%

Influenza Vaccine Info Percent of short-stay residents assessed and appropriately given the seasonal influenza vaccine 98.0%
In line with Florida average

Florida average: 94.7%

Breakdown by payment type

Medicare

27% of new residents, usually for short-term rehab.

Typical stay 2 - 3 months

Private pay

66% of new residents, often for short stays.

Typical stay 7 days

Medicaid

6% of new residents, often for long-term daily care.

Typical stay 3 years

Facility Characteristics

Source: CMS Long-Term Care Facility Characteristics (Data as of Jan 2026)

Total residents 96
Medicare
29
30.2% of residents
Medicaid
59
61.5% of residents
Private pay or other
8
8.3% of residents
Programs & Services
Residents Group

Residents meet regularly to discuss policies, care quality, and activities

Family Member Group

Family members meet regularly to discuss policies, care quality, and activities

Active Family Council

Organized group of family members that meets regularly to discuss facility policies, resident care, and activities.

Active Resident Council

Organized group of residents that meets regularly to discuss facility policies, quality of life, and activities.

Finances and operations

Privately-owned community
Operated by a single business entity.
Home revenue
$20.3M
Profit
$751.5K
Privately-owned community Operated by a single business entity.
Home revenue
$20.3M Rank #112 / 256Revenue — State benchmarkedThis home is ranked 112th out of 256 homes in Florida for revenue. Shows this facility's annual revenue compared to the Florida SNF average. Higher revenue generally means more resources for staffing and capital — read alongside Payroll %.Click the rank badge to see the full State ranking.Click here to see the full State ranking.
Profit
$751.5K
Payroll costs Info The portion of the home's budget spent on staff, including nurses, caregivers, and other employees who support care and operations. Rank #164 / 256Payroll — State benchmarkedThis home is ranked 164th out of 256 homes in Florida for payroll. Shows total annual staff payroll benchmarked to the Florida average. Higher payroll investment relative to peers often signals better staffing and less reliance on cheaper contract labor.Click the rank badge to see the full State ranking.Click here to see the full State ranking.
$7.0M
34.4% of revenue Rank #209 / 256Payroll % — State benchmarkedThis home is ranked 209th out of 256 homes in Florida for payroll %. Shows payroll as a percentage of revenue versus the Florida average. Well-run Florida SNFs typically land around 49–56% — the top third Statewide. Below 25% may signal understaffing or heavy agency use — read with Staffing ratings.Click the rank badge to see the full State ranking.Click here to see the full State ranking.
Other operating costs Info All remaining costs needed to run the home, such as food, utilities, building maintenance, supplies and administrative expenses.
$12.6M
Total costs $19.5M

What does this home offer?

Building type icon
Building type icon

Building Type: 3-story

Who this home usually serves

TYPE OF STAY

Primarily short stays

Residents typically stay for brief periods, with frequent admissions and discharges throughout the year.

Video

Get to know the community with a high-definition video tour
Video tour: The Pointe of North Gables
Watch this video about life at The Pointe of North Gables
icon

Places of interest near The Pointe of North Gables

Address 6.6 miles from city center Info Estimated distance in miles from Miami's city center to The Pointe of North Gables's address, calculated via Google Maps. — 1.51 miles to nearest hospital (Miami Childrens Hospital Derm)

Calculate Travel Distance to The Pointe of North Gables

Add your location

Address

Financial Assistance for
Nursing Home in Florida

The Pointe of North Gables is located in Miami, Florida.
Here are the financial assistance programs available to residents in Florida.

Get Financial aid guidance

Long-Term Care Waiver

Florida Medicaid LTC Waiver

Age 65+ or 21+ disabled
General Florida resident, Medicaid- eligible, nursing home-level care need.
Income Limits (2025) ~$2,829/month 300% FBR, individual
Asset Limits $2,000 (individual), $3,000 (couple).
FL

High demand; waitlists common.

Benefits
In-home care (6-8 hours/day) Assisted living Respite (240 hours/year) Case management

Community Care for the Elderly (CCE)

Florida CCE

Age 60+
General Florida resident, at risk of nursing home.
Income Limits ~$2,000/month varies
Asset Limits $5,000 individual
FL

Limited funding; regional variation.

Benefits
Homemaker services (3-5 hours/week) Adult day care (~$60/day) Respite (up to 10 days/year)

Home Care for the Elderly (HCE)

Florida Home Care for the Elderly

Age 60+
General Florida resident, at risk of nursing home placement; caregiver must be approved.
Income Limits (2025) ~$2,829/month individual, aligned with Medicaid thresholds
Asset Limits ~$2,000 (individual); varies by case manager discretion.
FL

Limited funding (~3,500 served annually); prioritizes low-income frail seniors.

Benefits
Basic subsidy (~$160/month) for housing/medical costs; special subsidies for supplies/services (e.g., incontinence supplies, ~$50-$200/month)

Program of All-Inclusive Care for the Elderly (PACE)

Florida Medicaid PACE

Age 55+
General Florida resident, nursing home-level care need, safe with PACE support.
Income Limits (2025) ~$2,829/month 300% FBR
Asset Limits $2,000 (individual), $3,000 (couple).
FL

Limited to specific counties (e.g., Hillsborough, Miami-Dade); ~10 sites statewide.

Benefits
Personal care (5-7 hours/day) Medical care Meals Transportation Therapy

Optional State Supplementation (OSS)

Florida Optional State Supplementation

Age 65+ or disabled
General Florida resident, living in approved facility, receiving SSI or low-income.
Income Limits (2025) ~$1,004/month individual, including SSI
Asset Limits $2,000 (individual), $3,000 (couple).
FL

Limited to specific facility types; ~$78.40/month max supplement.

Benefits
Cash payment (~$78.40/month) for room/board or personal needs in facilities

Frequently Asked Questions about The Pointe of North Gables

Is The Pointe of North Gables in a walkable area?

The Pointe of North Gables has a walk score of 85. Very walkable. Most errands can be accomplished on foot, and many essentials are within a short walk.

Are there photos of The Pointe of North Gables?

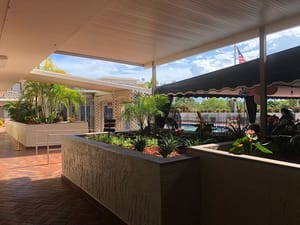
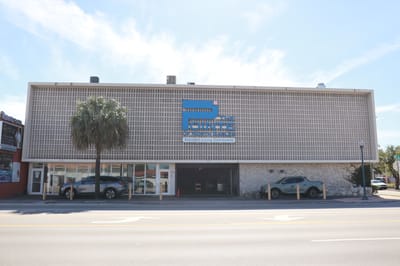
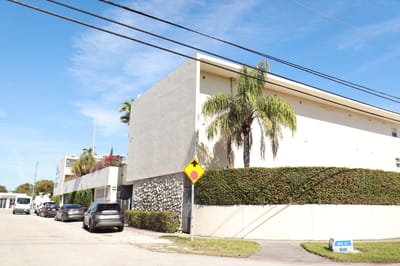
Yes — there are 11 photos of The Pointe of North Gables in the photo gallery on this page.

What is the address of The Pointe of North Gables?

The Pointe of North Gables is located at 5890 SW 8th St, Miami, FL 33144, United States.

What is the phone number of The Pointe of North Gables?

(305) 441-9700 will put you in contact with the team at The Pointe of North Gables.

Is The Pointe of North Gables Medicare or Medicaid certified?

Yes — The Pointe of North Gables is a CMS-certified provider of Medicare and Medicaid.

Guides for Better Senior Living

Care Cost Calculator: See Prices in Your Area

Nursing Home Data Explorer

Don’t Wait Too Long: 7 Red Flag Signs Your Parent Needs Assisted Living Now

The True Cost of Assisted Living in 2025 – And How Families Are Paying For It

Understanding Senior Living Costs: Pricing Models, Discounts & Financial Assistance

Explore Open Rooms
1 Contact details
2 What type of senior care service are you looking for?
3 What budget do you have in mind for senior care?
4 How soon do you need to find care?
5 Additional details

Thank you for your interest!

Our team will be in touch shortly to help with next steps.