The Springs of Premier
Nursing Home & Memory Care · North Little Rock, AR
CMS overall rating Info The Overall CMS Rating is scored from 1 to 5 stars and combines results from health inspections, staffing levels, and quality measures. Health inspections carry the most weight. Staffing and quality scores can increase or decrease the final rating based on performance compared to state and national standards.

The Springs of Premier

Nursing Home & Memory Care · North Little Rock, AR
CMS overall rating Info The Overall CMS Rating is scored from 1 to 5 stars and combines results from health inspections, staffing levels, and quality measures. Health inspections carry the most weight. Staffing and quality scores can increase or decrease the final rating based on performance compared to state and national standards.
Calculator: See prices in your area
The Springs of Premier accepts Medicare, Medicaid, and private pay.

Overview of The Springs of Premier

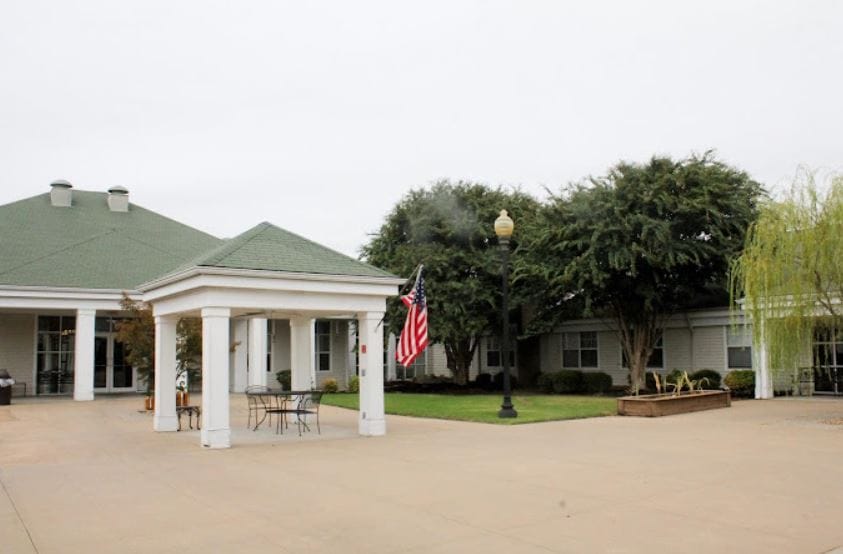
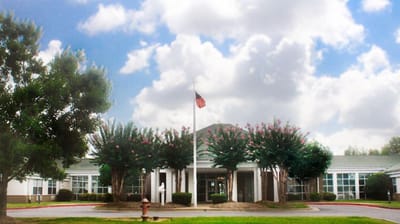
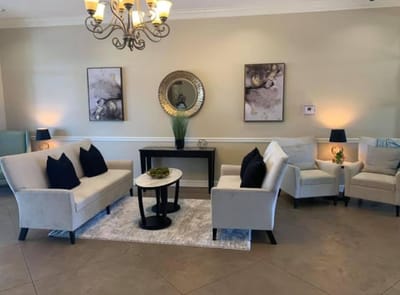
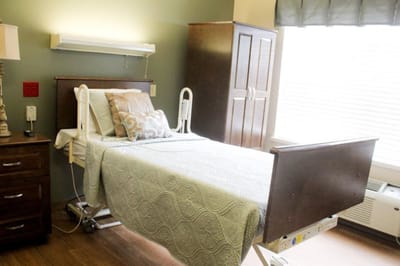
The Springs Premier in Little Rock boasts its services are delivered with only the best in its class brought by its premier level of care entrusted to residents. The nursing home is composed of a professional care staff who brings excellence to the recovery of every senior; residents can genuinely feel the high-end quality of care in a nurturing environment. Offering skilled nursing, rehabilitation, and memory care, The Springs provides a home-like setting where residents and staff value the importance of a rejuvenating recovery period.
The nursing home is dedicated to upholding passion and peace of mind in the lifestyles of its residents. It offers its exclusive Serenity at The Springs, a specialized program unit for memory care residents; it also has a Telemedicine service that encompasses health monitoring by the immediate call of physicians to assess medical conditions as a preventive measure to rush to the hospital. Other clinical services include stroke recovery, IV therapy, orthopedic therapy, post-surgical care, pain management, technical therapy programs, and diabetic care.

(501) 834-3100

Quality ratings

Measured by Centers for Medicare & Medicaid Services (CMS)

Overall rating Info The Overall CMS Rating combines results from health inspections, staffing levels and quality measures. Health inspections carry the most weight. Staffing and quality scores can increase or decrease the final rating based on performance compared to state and national standards.
▼ 36.3% Below AR avg. ▼ 36.3% Below AR avg.Click the badge to see the full State ranking.Click here to see the full State ranking.
Health Inspection Info Based on the results of the facility's three most recent standard inspections and any complaint investigations. CMS reviews the number, scope, and severity of deficiencies, with more recent findings weighted more heavily.
▼ 30.8% Below AR avg. ▼ 30.8% Below AR avg.Click the badge to see the full State ranking.Click here to see the full State ranking.
Staffing Info Measures average nursing staff hours per resident per day, including Registered Nurses (RNs) and total nursing staff. Ratings are adjusted based on the level of care residents require and are compared to state and national benchmarks.
▼ 37.2% Below AR avg. ▼ 37.2% Below AR avg.Click the badge to see the full State ranking.Click here to see the full State ranking.
Quality Measures Info Based on clinical and physical health indicators reported to CMS, such as hospital readmissions, falls, pressure ulcers, and improvements in mobility. These measures reflect how well residents' health needs are being managed.
▼ 18.0% Below AR avg. ▼ 18.0% Below AR avg.Click the badge to see the full State ranking.Click here to see the full State ranking.

Staffing hours breakdown

Info Daily nursing hours per resident by staff type, reported to CMS. Higher is generally better — compare this facility to state and national averages to see where staffing stands.

Hours per resident per day — compared to Arkansas state averages

Total nursing care / resident Info This home is ranked 151st out of 182 homes in Arkansas. Total adjusted nursing hours per resident per day, combining RN, LPN, and aide time. CMS adjusts this for case-mix so facilities can be fairly compared.
4h 4m per day
Rank #151 / 182Nurse hours — State benchmarkedThis home is ranked 151st out of 182 homes in Arkansas. Shows adjusted nurse hours per resident per day benchmarked to the Arkansas average, with a ranking across 182 Arkansas SNFs. More hours mean more direct care. The national average is about 3.5 hrs; below 3.0 is a red flag.Click the rank badge to see the full State ranking.Click here to see the full State ranking.
This facility Arkansas avg (4h 40m per day)
vs Arkansas avg
-13%

2 of 6 metrics below state avg

Standout metric Physical Therapist is +50% above state avg
Staff typeHours / Day / Residentvs state avg
Registered Nurse (RN) Info RNs hold the highest nursing license and can assess residents, interpret test results, and direct care plans. More RN hours per day often signals stronger clinical oversight and faster response to health changes. 22m per day ▼ 8% State avg: 24m per day · National avg: 41m per day
LPN / LVN Info Licensed Practical Nurses (LPNs) or Licensed Vocational Nurses (LVNs) deliver routine hands-on care — medication administration, wound dressing, and monitoring vital signs. They work under RN supervision and make up a large share of daily bedside care. 56m per day ■ Avg State avg: 57m per day · National avg: 52m per day
Nurse Aide Info Certified Nurse Aides (CNAs) provide the most direct day-to-day assistance: bathing, dressing, feeding, and mobility. Nurse aide hours are typically the largest staffing category and directly affect residents' quality of life. 2h 51m per day ▲ 4% State avg: 2h 44m per day · National avg: 2h 21m per day
Total Nursing (Weekend) Info Combined nursing hours (RN + LPN + Nurse Aide) per resident per day on weekends. Staffing often drops on weekends — this figure reveals whether the facility maintains adequate coverage outside of weekday hours. 3h 14m per day ▼ 7% State avg: 3h 29m per day · National avg: 3h 26m per day
Physical Therapist Info Hours per resident per day provided by licensed Physical Therapists (PTs) or PT Assistants. PT services help residents recover mobility after injury or illness and are especially important for post-acute (short-stay) rehabilitation. 3m per day ▲ 50% State avg: 2m per day · National avg: 4m per day
RN (Weekend) Info Registered nurse hours specifically on weekends. Facilities sometimes reduce RN presence on Saturdays and Sundays — a low weekend RN figure compared to weekday hours can indicate reduced clinical oversight when most administrative staff are absent. 19m per day ▲ 19% State avg: 16m per day · National avg: 29m per day

Types of Care at The Springs of Premier

Memory Care Nursing Home

Capacity and availability

This home usually has availability

Occupancy lower than 85% suggests more openings may be available.

Higher occupancy than the Arkansas average: 71.3%
Occupancy rate 79.3% Rank #61 / 182Occupancy rate — State benchmarkedThis home is ranked 61st out of 182 homes in Arkansas. Shows this facility's occupancy rate versus the Arkansas average, with its Statewide rank out of 182. Higher occupancy signals strong local demand and financial stability.Click the rank badge to see the full State ranking.Click here to see the full State ranking.
Avg. Length of Stay 95 days
Occupancy rate
79.3% Rank #61 / 182Occupancy rate — State benchmarkedThis home is ranked 61st out of 182 homes in Arkansas. Shows this facility's occupancy rate versus the Arkansas average, with its Statewide rank out of 182. Higher occupancy signals strong local demand and financial stability.Click the rank badge to see the full State ranking.Click here to see the full State ranking.
Avg. Length of Stay
95 days
Walk Score
Walk Score: 31 / 100 Rank #112 / 187Walk Score — State benchmarkedThis home is ranked 112th out of 187 homes in Arkansas. Shows how walkable this facility's neighborhood is compared to the average Walk Score across Arkansas SNFs. Higher scores benefit residents, families, and staff.Click the rank badge to see the full State ranking.Click here to see the full State ranking.
Somewhat walkable. A few nearby services may be reachable on foot, but most trips require transportation.

Contact The Springs of Premier

Staffing Data

Reporting period: October 1 – December 31, 2025 (Q4 2025). Source: CMS Payroll-Based Journal report.

Total staff 172
Employees 169
Contractors 3
Staff to resident ratio 1.34:1
17% worse than Arkansas average
Arkansas average ratio: 1.61:1 Arkansas average ratio: 1.61:1See full Arkansas ranking
Avg staff/day 65
Average shift 8 hours
0% compared with Arkansas average
Arkansas average: 8 hours Arkansas average shift: 8 hoursSee full Arkansas ranking
Total staff hours (quarter) 47,850

Nursing staff breakdown

Q4 2025 · Oct 1 – Dec 31 More info This data comes from the CMS Payroll-Based Journal report covering October 1 – December 31, 2025.
Registered Nurse

Manages medical care and health needs.

Total count 13
Average shift length Info Average shift length. Calculated as total hours divided by days worked and average staff per day. 10.3 hours

No contractors work on this role.

Licensed Practical Nurse

Assists with medical care and medications.

Total count 27
Average shift length Info Average shift length. Calculated as total hours divided by days worked and average staff per day. 9.4 hours

No contractors work on this role.

Certified Nursing Assistant

Helps with daily care and mobility.

Total count 86
Average shift length Info Average shift length. Calculated as total hours divided by days worked and average staff per day. 7.7 hours

No contractors work on this role.

Contractor staffing

Q4 2025 · Oct 1 – Dec 31 More info This data comes from the CMS Payroll-Based Journal report covering October 1 – December 31, 2025.

Total hours from contractors

0.3%

130 contractor hours this quarter

Occupational Therapy Aide: 1 Medical Director: 1 Occupational Therapy Assistant: 1

Staff by category

Q4 2025 · Oct 1 – Dec 31 More info This data comes from the CMS Payroll-Based Journal report covering October 1 – December 31, 2025.
Certified Nursing Assistant8608626,66992100%7.7
Licensed Practical Nurse270278,37092100%9.4
Medication Aide/Technician100103,22892100%10.5
RN Director of Nursing7072,4217683%7.7
Registered Nurse130131,2395661%10.3
Physical Therapy Aide5051,0066975%6.7
Clinical Nurse Specialist3039897480%7.9
Respiratory Therapy Technician4046956773%6.2
Qualified Social Worker4046787076%5.7
Dental Services Staff1015226672%7.9
Nurse Practitioner1014806065%8
Administrator1014786065%8
Other Dietary Services Staff1014235964%7.2
Therapeutic Recreation Specialist3033667885%3.9
Physical Therapy Assistant2021264448%2.9
Occupational Therapy Aide011801820%4.4
Occupational Therapy Assistant011441314%3.4
Respiratory Therapist1013067%5
Medical Director011744%1.8
86 Certified Nursing Assistant
% of Days 100%
27 Licensed Practical Nurse
% of Days 100%
10 Medication Aide/Technician
% of Days 100%
7 RN Director of Nursing
% of Days 83%
13 Registered Nurse
% of Days 61%
5 Physical Therapy Aide
% of Days 75%
3 Clinical Nurse Specialist
% of Days 80%
4 Respiratory Therapy Technician
% of Days 73%
4 Qualified Social Worker
% of Days 76%
1 Dental Services Staff
% of Days 72%
1 Nurse Practitioner
% of Days 65%
1 Administrator
% of Days 65%
1 Other Dietary Services Staff
% of Days 64%
3 Therapeutic Recreation Specialist
% of Days 85%
2 Physical Therapy Assistant
% of Days 48%
1 Occupational Therapy Aide
% of Days 20%
1 Occupational Therapy Assistant
% of Days 14%
1 Respiratory Therapist
% of Days 7%
1 Medical Director
% of Days 4%

Penalties and fines

Federal penalties imposed by CMS for regulatory violations, including civil money penalties (fines) and denials of payment for new Medicare/Medicaid admissions.

Source: CMS Penalties Database

No penalties in the past 3 years

No civil money penalties or payment denials were reported in the last 3 years.

Quality of care over time

These measures show how residents usually do over time at this home, based on health outcomes and preventive care.

High-risk clinical events score Info A composite score based on pressure ulcers, falls with injury, weight loss, walking ability decline, and activities of daily living decline. 4.9
37% better than Arkansas average

Arkansas average: 7.7

Functional decline score Info A composite score based on activities of daily living decline, walking ability decline, and incontinence. 6.6
50% better than Arkansas average

Arkansas average: 13.3

Long-stay resident measures
Significantly above average Info CMS star rating based on long-stay quality measure performance. 5 stars = significantly above average, 1 star = significantly below average.
Need for Help with Daily Activities Increased Info Percent of long-stay residents whose need for help with daily activities has increased 4.5%
61% better than Arkansas average

Arkansas average: 11.5%

Walking Ability Worsened Info Percent of long-stay residents whose ability to move independently worsened 6.0%
55% better than Arkansas average

Arkansas average: 13.4%

Low Risk Residents with Bowel/Bladder Incontinence Info Percent of low risk long-stay residents who lose control of their bowels or bladder 9.4%
38% better than Arkansas average

Arkansas average: 15.1%

Falls with Major Injury Info Percent of long-stay residents experiencing one or more falls with major injury 2.1%
47% better than Arkansas average

Arkansas average: 3.9%

High Risk Residents with Pressure Ulcers Info Percent of long-stay high risk residents with pressure ulcers 5.8%
22% worse than Arkansas average

Arkansas average: 4.7%

Urinary Tract Infection Info Percent of long-stay residents with a urinary tract infection 0.0%
100% better than Arkansas average

Arkansas average: 1.3%

Lost Too Much Weight Info Percent of long-stay residents who lose too much weight 6.0%
20% worse than Arkansas average

Arkansas average: 5.0%

Depressive Symptoms Info Percent of long-stay residents who have depressive symptoms 0.0%
100% better than Arkansas average

Arkansas average: 1.5%

Antipsychotic Use Info Percent of long-stay residents who received an antipsychotic medication 11.0%
5% worse than Arkansas average

Arkansas average: 10.5%

Pneumococcal Vaccine Info Percent of long-stay residents assessed and appropriately given the pneumococcal vaccine 98.7%
5% better than Arkansas average

Arkansas average: 94.4%

Influenza Vaccine Info Percent of long-stay residents assessed and appropriately given the seasonal influenza vaccine 98.1%
In line with Arkansas average

Arkansas average: 96.2%

Hospitalizations per 1,000 days Info Number of hospitalizations per 1,000 long-stay resident days. 1.28
35% better than Arkansas average

Arkansas average: 1.97

ED visits per 1,000 days Info Number of outpatient emergency department visits per 1,000 long-stay resident days. 1.30
40% better than Arkansas average

Arkansas average: 2.18

Short-stay resident measures
Significantly below average Info CMS star rating based on short-stay quality measure performance. 5 stars = much above average, 1 star = much below average.
Pneumococcal Vaccine Info Percent of short-stay residents assessed and appropriately given the pneumococcal vaccine 90.2%
12% better than Arkansas average

Arkansas average: 80.9%

Antipsychotic medication increase Info Percent of short-stay residents who newly received an antipsychotic medication 2.6%
69% worse than Arkansas average

Arkansas average: 1.5%

Influenza Vaccine Info Percent of short-stay residents assessed and appropriately given the seasonal influenza vaccine 80.0%
In line with Arkansas average

Arkansas average: 77.7%

Re-hospitalized after SNF stay Info Percentage of short-stay residents who were re-hospitalized after their nursing home admission. 29.5%
17% worse than Arkansas average

Arkansas average: 25.2%

Emergency department visits Info Percentage of short-stay residents who had an outpatient emergency department visit. 13.0%
6% better than Arkansas average

Arkansas average: 13.8%

Falls with major injury Info Percentage of SNF residents who experience falls with major injury during their stay. 0.0%
100% better than Arkansas average

Arkansas average: 0.8%

Ability to care for self at discharge Info Percentage of residents at or above expected ability to care for themselves at discharge. 27.6%
49% worse than Arkansas average

Arkansas average: 53.7%

Successful return to home or community Info Rate of successful return to home or community from a skilled nursing facility. 47.9%
5% worse than Arkansas average

Arkansas average: 50.6%

Breakdown by payment type

Medicare

29% of new residents, usually for short-term rehab.

Typical stay 23 days

Private pay

59% of new residents, often for short stays.

Typical stay 2 - 3 months

Medicaid

12% of new residents, often for long-term daily care.

Typical stay 1 years

Facility Characteristics

Source: CMS Long-Term Care Facility Characteristics (Data as of Jan 2026)

Total residents 128
Medicare
9
7% of residents
Medicaid
61
47.7% of residents
Private pay or other
58
45.3% of residents

Finances and operations

Privately-owned community
Home revenue
$13.2M
Profit
$1.3M
Privately-owned community
Home revenue
$13.2M Rank #33 / 181Revenue — State benchmarkedThis home is ranked 33rd out of 181 homes in Arkansas. Shows this facility's annual revenue compared to the Arkansas SNF average. Higher revenue generally means more resources for staffing and capital — read alongside Payroll %.Click the rank badge to see the full State ranking.Click here to see the full State ranking.
Profit
$1.3M
Payroll costs Info The portion of the home's budget spent on staff, including nurses, caregivers, and other employees who support care and operations. Rank #35 / 181Payroll — State benchmarkedThis home is ranked 35th out of 181 homes in Arkansas. Shows total annual staff payroll benchmarked to the Arkansas average. Higher payroll investment relative to peers often signals better staffing and less reliance on cheaper contract labor.Click the rank badge to see the full State ranking.Click here to see the full State ranking.
$5.7M
43.7% of revenue Rank #103 / 181Payroll % — State benchmarkedThis home is ranked 103rd out of 181 homes in Arkansas. Shows payroll as a percentage of revenue versus the Arkansas average. Well-run Arkansas SNFs typically land around 47–60% — the top third Statewide. Below 25% may signal understaffing or heavy agency use — read with Staffing ratings.Click the rank badge to see the full State ranking.Click here to see the full State ranking.
Other operating costs Info All remaining costs needed to run the home, such as food, utilities, building maintenance, supplies and administrative expenses.
$6.1M
Total costs $11.8M

Who this home usually serves

TYPE OF STAY

Mix of rehab and long-term care

This home supports both short-term rehab and long-term care, with residents staying for a wide range of durations.

Places of interest near The Springs of Premier

Address 4.9 miles from city center Info Estimated distance in miles from North Little Rock's city center to The Springs of Premier's address, calculated via Google Maps. — 1.61 miles to nearest hospital (North Little Rock Women's Clinic)

Calculate Travel Distance to The Springs of Premier

Add your location

Address

Financial Assistance for
Nursing Home in Arkansas

The Springs of Premier is located in North Little Rock, Arkansas.
Here are the financial assistance programs available to residents in Arkansas.

Get Financial aid guidance

ARChoices

Arkansas Medicaid ARChoices

Age 65+ or 21+ with disability
General Arkansas resident, Medicaid- eligible, nursing home-level care need.
Income Limits (2025) ~$2,829/month 300% FBR, individual
Asset Limits $2,000 (individual), $3,000 (couple).
AR

Rural focus; possible waitlists.

Benefits
Personal care (5-7 hours/day) Meals ($7/meal) Respite care (240 hours/year) Adult day services ($60/day)

Choices in Living Resource Center

Arkansas Choices in Living

Age 60+
General Arkansas resident.
Income Limits No strict limit; prioritizes low-income.
Asset Limits Not applicable.
AR

Limited direct funding; mostly referral-based.

Benefits
Care coordination Limited respite (up to 5 days/year) Transportation assistance (~5 trips/month)

Living Choices Assisted Living Waiver

Arkansas Medicaid Living Choices Assisted Living Waiver

Age 65+
General Arkansas resident, requires nursing home-level care, lives in a Level II assisted living facility.
Income Limits (2025) ~$2,829/month 300% FBR, individual
Asset Limits $2,000 (individual), $3,000 (couple); spousal rules apply.
AR

Limited provider network; excludes Level I facilities (no nursing services).

Benefits
Personal care (~5 hours/day) Medication management Nursing Activities Transportation

Program of All-Inclusive Care for the Elderly (PACE)

Arkansas Medicaid PACE

Age 55+
General Arkansas resident, nursing home-level care, safe with PACE support.
Income Limits (2025) ~$2,829/month 300% FBR
Asset Limits $2,000 (individual), $3,000 (couple).
AR

Limited geographic availability.

Benefits
Primary/preventive care Personal care (5-7 hours/day) Meals Transportation Therapy

Arkansas State Plan Personal Care

Arkansas Medicaid Personal Care Program

Age
General Any age, Arkansas resident, needs ADL/IADL help, Medicaid-eligible.
Income Limits (2025) ~$1,004/month individual
Asset Limits $9,660 (individual), $14,470 (couple).
AR

No nursing home-level care requirement.

Benefits
Personal care (~4-6 hours/day) Homemaker services (e.g., meal prep)

Compare Nursing Home around North Little Rock

The information below is reported by the Arkansas Department of Human Services, Office of Long Term Care.

3 facilities compared · CMS & AR Dept. of Health data

Filter by care type
Arkansas State Veterans Home
NH

Nursing Home Licensed facility providing 24/7 skilled nursing care for residents with complex, ongoing medical needs. Staffed by RNs, LPNs, and CNAs. Inspected and star-rated annually by CMS. Accepts Medicare (short-term rehab) and Medicaid (long-term care).

AL

Assisted Living A licensed, long-term care setting for seniors or individuals with disabilities who need help with daily activities — like bathing, dressing, and medication management — but not 24-hour skilled nursing. Offers housing, meals, and around-the-clock support while aiming to maximize resident independence.

IL

Independent Living Lifestyle-focused communities for older adults offering dining, activities, and transportation with minimal personal care. Best for active, independent seniors who want community without medical support.

MC

Memory Care Secured, specialized care for people living with Alzheimer's or dementia. Staff trained in cognitive impairment, with higher staff-to-resident ratios and an environment designed to reduce confusion and wandering risk.

North Little Rock (North Oaks)96 95.1% +33%6.24 +7%+34%$0175.7-81 16 Phoua Lee$12.5M$9.1M72.9%45462
Lakewood Health and Rehab, LLC
NH

Nursing Home Licensed facility providing 24/7 skilled nursing care for residents with complex, ongoing medical needs. Staffed by RNs, LPNs, and CNAs. Inspected and star-rated annually by CMS. Accepts Medicare (short-term rehab) and Medicaid (long-term care).

AL

Assisted Living A licensed, long-term care setting for seniors or individuals with disabilities who need help with daily activities — like bathing, dressing, and medication management — but not 24-hour skilled nursing. Offers housing, meals, and around-the-clock support while aiming to maximize resident independence.

North Little Rock (Hill Township)85 90.1% +26%5.17 -71%+11%$0379.3-68 50 Jennifer Reichard$11.1M$4.7M41.8%45202
The Springs of Premier
NH

Nursing Home Licensed facility providing 24/7 skilled nursing care for residents with complex, ongoing medical needs. Staffed by RNs, LPNs, and CNAs. Inspected and star-rated annually by CMS. Accepts Medicare (short-term rehab) and Medicaid (long-term care).

AL

Assisted Living A licensed, long-term care setting for seniors or individuals with disabilities who need help with daily activities — like bathing, dressing, and medication management — but not 24-hour skilled nursing. Offers housing, meals, and around-the-clock support while aiming to maximize resident independence.

North Little Rock132 79.3% +11%4.07 +38%-13%$0357.0-120 31 Danny Weaver$13.2M$5.7M43.7%45357

Frequently Asked Questions about The Springs of Premier

Is The Springs of Premier in a walkable area?

The Springs of Premier has a walk score of 31. Somewhat walkable. A few nearby services may be reachable on foot, but most trips require transportation.

What is the phone number of The Springs of Premier?

(501) 834-3100 will put you in contact with the team at The Springs of Premier.

Is The Springs of Premier Medicare or Medicaid certified?

Yes — The Springs of Premier is a CMS-certified provider of Medicare and Medicaid.

Guides for Better Senior Living

Care Cost Calculator: See Prices in Your Area

Nursing Home Data Explorer

Don’t Wait Too Long: 7 Red Flag Signs Your Parent Needs Assisted Living Now

The True Cost of Assisted Living in 2025 – And How Families Are Paying For It

Understanding Senior Living Costs: Pricing Models, Discounts & Financial Assistance

Explore Open Rooms
1 Contact details
2 What type of senior care service are you looking for?
3 What budget do you have in mind for senior care?
4 How soon do you need to find care?
5 Additional details

Thank you for your interest!

Our team will be in touch shortly to help with next steps.