The Stratford
Nursing Home, Assisted Living, Independent Living & Memory Care · Carmel, IN
CMS overall rating Info CMS (the Centers for Medicare & Medicaid Services) is the federal agency that rates nursing home quality. Its Overall Rating runs from 1 to 5 stars, combining health inspections, staffing, and quality measures, with inspections weighted most heavily.

The Stratford

Nursing Home, Assisted Living, Independent Living & Memory Care · Carmel, IN
CMS overall rating Info CMS (the Centers for Medicare & Medicaid Services) is the federal agency that rates nursing home quality. Its Overall Rating runs from 1 to 5 stars, combining health inspections, staffing, and quality measures, with inspections weighted most heavily.
Calculator: See prices in your area
The Stratford accepts Medicare and private pay.

Overview of The Stratford

Live life on your terms at The Stratford, an independent living community designed for active seniors in Carmel. Residents have the freedom to choose from a variety of apartment styles, each offering a comfortable and secure environment. The Stratford provides an array of amenities to enhance residents’ lives, including a fitness center for maintaining physical well-being, a beautifully appointed library for quiet enjoyment, and landscaped courtyards for socializing outdoors.

This center for independent living prioritizes resident engagement. A dedicated activities director plans a vibrant calendar of events and outings, catering to a wide range of interests. Whether you prefer educational lectures, social gatherings, or cultural excursions, The Stratford offers something for everyone. Additionally, on-site restaurants serve delicious meals, ensuring residents can enjoy a carefree and fulfilling lifestyle.

Quality ratings

Measured by Centers for Medicare & Medicaid Services (CMS)

Overall rating Info The Overall CMS Rating combines results from health inspections, staffing levels and quality measures. Health inspections carry the most weight. Staffing and quality scores can increase or decrease the final rating based on performance compared to state and national standards.
▲ 29.7% Above IN avg. ▲ 29.7% Above IN avg.IN average: 3.1Click the badge to see the full State ranking.Click here to see the full State ranking.
Health Inspection Info Based on the results of the facility's three most recent standard inspections and any complaint investigations. CMS reviews the number, scope, and severity of deficiencies, with more recent findings weighted more heavily.
▲ 42.5% Above IN avg. ▲ 42.5% Above IN avg.IN average: 2.8Click the badge to see the full State ranking.Click here to see the full State ranking.
Staffing Info Measures average nursing staff hours per resident per day, including Registered Nurses (RNs) and total nursing staff. Ratings are adjusted based on the level of care residents require and are compared to state and national benchmarks.
▲ 62.7% Above IN avg. ▲ 62.7% Above IN avg.IN average: 2.5Click the badge to see the full State ranking.Click here to see the full State ranking.
Quality Measures Info Based on clinical and physical health indicators reported to CMS, such as hospital readmissions, falls, pressure ulcers, and improvements in mobility. These measures reflect how well residents' health needs are being managed.
▼ 26.6% Below IN avg. ▼ 26.6% Below IN avg.IN average: 4.1Click the badge to see the full State ranking.Click here to see the full State ranking.

Staffing hours breakdown

Info Daily nursing hours per resident by staff type, reported to CMS. Higher is generally better — compare this facility to state and national averages to see where staffing stands.

Hours per resident per day — compared to Indiana state averages

Total nursing care / resident Info This home is ranked 3rd out of 291 homes in Indiana for nurse hours. Total adjusted nursing hours per resident per day, combining RN, LPN, and aide time. CMS adjusts this for case-mix so facilities can be fairly compared.
7h 5m per day
Rank #3 / 291Nurse hours — State benchmarkedThis home is ranked 3rd out of 291 homes in Indiana. Shows adjusted nurse hours per resident per day benchmarked to the Indiana average, with a ranking across 291 Indiana facilities. More hours mean more direct care. The national average is about 3.5 hrs; below 3.0 is a red flag.Rankings are based only on facilities in Indiana that report data for that category. Facilities without available data are excluded from the ranking.Click the rank badge to see the full State ranking.Click here to see the full State ranking.
This facility Indiana avg (3h 26m per day)
vs Indiana avg
+106%

0 of 6 metrics below state avg

Standout metric Physical Therapist is +273% above state avg
Staff typeHours / Day / Residentvs state avg
Registered Nurse (RN) Info RNs hold the highest nursing license and can assess residents, interpret test results, and direct care plans. More RN hours per day often signals stronger clinical oversight and faster response to health changes. 1h 48m per day ▲ 177% State avg: 39m per day · National avg: 41m per day
LPN / LVN Info Licensed Practical Nurses (LPNs) or Licensed Vocational Nurses (LVNs) deliver routine hands-on care — medication administration, wound dressing, and monitoring vital signs. They work under RN supervision and make up a large share of daily bedside care. 1h 5m per day ▲ 38% State avg: 47m per day · National avg: 52m per day
Nurse Aide Info Certified Nurse Aides (CNAs) provide the most direct day-to-day assistance: bathing, dressing, feeding, and mobility. Nurse aide hours are typically the largest staffing category and directly affect residents' quality of life. 3h 30m per day ▲ 55% State avg: 2h 15m per day · National avg: 2h 20m per day
Weekend Total Nursing Info Combined nursing hours (RN + LPN + Nurse Aide) per resident per day on weekends. Staffing often drops on weekends — this figure reveals whether the facility maintains adequate coverage outside of weekday hours. 5h 47m per day ▲ 77% State avg: 3h 16m per day · National avg: 3h 27m per day
Physical Therapist Info Hours per resident per day provided by licensed Physical Therapists (PTs) or PT Assistants. PT services help residents recover mobility after injury or illness and are especially important for post-acute (short-stay) rehabilitation. 14m per day ▲ 273% State avg: 4m per day · National avg: 4m per day
Weekend RN Info Registered nurse hours specifically on weekends. Facilities sometimes reduce RN presence on Saturdays and Sundays — a low weekend RN figure compared to weekday hours can indicate reduced clinical oversight when most administrative staff are absent. 1h 23m per day ▲ 206% State avg: 27m per day · National avg: 29m per day

Capacity and availability

This home usually has availability

Lower occupancy than the Indiana average: 69.4%
Occupancy rate
65.6% Rank #225 / 434Occupancy rate — State benchmarkedThis home is ranked 225th out of 434 homes in Indiana. Shows this facility's occupancy rate versus the Indiana average, with its Statewide rank out of 434. Higher occupancy signals strong local demand and financial stability.Rankings are based only on facilities in Indiana that report data for that category. Facilities without available data are excluded from the ranking.Click the rank badge to see the full State ranking.Click here to see the full State ranking.
Avg. Length of Stay
63 days
Bed community size
18-bed community Rank #436 / 437Bed count — State benchmarkedThis home is ranked 436th out of 437 homes in Indiana. Shows this facility's certified or reported bed count compared to other Indiana facilities. Larger communities may offer more amenities, programs, and on-site services for residents and families.Rankings are based only on facilities in Indiana that report data for that category. Facilities without available data are excluded from the ranking.Click the rank badge to see the full State ranking.Click here to see the full State ranking.
A smaller, more intimate setting that may offer a quieter environment and closer staff-resident interactions.
Walk Score
Walk Score: 54 / 100 Rank #188 / 587Walk Score — State benchmarkedThis home is ranked 188th out of 587 homes in Indiana. Shows how walkable this facility's neighborhood is compared to the average Walk Score across Indiana facilities. Higher scores benefit residents, families, and staff.Rankings are based only on facilities in Indiana that report data for that category. Facilities without available data are excluded from the ranking.Click the rank badge to see the full State ranking.Click here to see the full State ranking.
Moderately walkable. Some errands can be accomplished on foot, with a mix of nearby amenities.
BBB Rating
BBB Rating: A+ (Not Accredited)
An independent rating from the Better Business Bureau based on factors such as complaint history, transparency, and business practices.
How BBB ratings work

Staffing

Key information about the people who lead and staff this community.

Leadership

ContactDonald Thompson, CEO

Contact The Stratford

Health Inspection History

Inspections since 2023
Total health inspections 4

Indiana average 6


Last Health inspection on Jun 2025

Total health citations
16 Rank #93 / 292Health citations — State benchmarkedThis home is ranked 93rd out of 292 homes in Indiana. Shows this facility's total health deficiency citations benchmarked to the Indiana State average, with a ranking across all 292 IN facilities. Lower citation counts earn a better rank.Rankings are based only on facilities in Indiana that report data for that category. Facilities without available data are excluded from the ranking.Click the rank badge to see the full State ranking.Click here to see the full State ranking.

Indiana average 25

Citations per inspection
4 Rank #153 / 292Citations per inspection — State benchmarkedThis home is ranked 153rd out of 292 homes in Indiana. Shows average deficiency citations per CMS inspection for this facility versus the Indiana mean across 292 facilities with citation data. Lower is better.Rankings are based only on facilities in Indiana that report data for that category. Facilities without available data are excluded from the ranking.Click the rank badge to see the full State ranking.Click here to see the full State ranking.

Indiana average 4.12


Health citations are formal notices following inspections when they fail to comply with safety and care standards.

12 of 16 citations resulted from standard inspections; 2 of 16 resulted from complaint investigations; and 2 of 16 came from combined inspections (standard and complaint).

Breakdown of citation severity (last 3 years)
Critical health citations
0
100% better than Indiana average

Indiana average: 0.2


Serious health citations
0
100% better than Indiana average

Indiana average: 0.6

0 critical citations Indiana average: 0.2

0 serious citations Indiana average: 0.6

16 moderate citations Indiana average: 23.8

0 minor citations Indiana average: 0.4
Citations history (last 3 years)
Abuse/Neglect moderate citation Jun 02, 2025
Corrected

Resident Rights moderate citation Jun 02, 2025
Corrected

Nutrition moderate citation Mar 07, 2025
Corrected

Pharmacy moderate citation Mar 07, 2025
Corrected

Staffing Data

Reporting period: October 1 – December 31, 2025 (Q4 2025). Source: CMS Payroll-Based Journal report.

Total staff 104
Employees 52
Contractors 52
Staff to resident ratio 8.00 : 1
7999900% more staff per resident than Indiana average
Indiana average ratio: 0.00 : 1 Indiana average ratio: 0.00 : 1See full Indiana ranking
Avg staff/day 18
Average shift 6 hours
22% worse than Indiana average
Indiana average: 7.7 hours Indiana average shift: 7.7 hoursSee full Indiana ranking
Total staff hours (quarter) 10,004

Nursing staff breakdown

Q4 2025 · Oct 1 – Dec 31 More info This data comes from the CMS Payroll-Based Journal report covering October 1 – December 31, 2025.
Registered Nurse

Manages medical care and health needs.

RN Staff Info 12 total: 5 full-time employees and 7 contractors. 12
Average shift length Info Average shift length. Calculated as total hours divided by days worked and average staff per day. 9.2 hours
Licensed Practical Nurse

Assists with medical care and medications.

LPN Staff Info 17 total: 4 full-time employees and 13 contractors. 17
Average shift length Info Average shift length. Calculated as total hours divided by days worked and average staff per day. 6.8 hours
Certified Nursing Assistant

Helps with daily care and mobility.

CNA Staff Info 48 total: 37 full-time employees and 11 contractors. 48
Average shift length Info Average shift length. Calculated as total hours divided by days worked and average staff per day. 7 hours

Contractor staffing

Q4 2025 · Oct 1 – Dec 31 More info This data comes from the CMS Payroll-Based Journal report covering October 1 – December 31, 2025.

Total hours from contractors

32.5%

3,254 contractor hours this quarter

Licensed Practical Nurse: 13 Certified Nursing Assistant: 11 Registered Nurse: 7 Respiratory Therapy Technician: 4 Speech Language Pathologist: 4 Physical Therapy Assistant: 3 Physical Therapy Aide: 3 Qualified Social Worker: 3 Occupational Therapy Assistant: 1 Nurse Practitioner: 1 Medical Director: 1 Feeding Assistant: 1

Staff by category

Q4 2025 · Oct 1 – Dec 31 More info This data comes from the CMS Payroll-Based Journal report covering October 1 – December 31, 2025.
Certified Nursing Assistant3711483,70192100%7
Registered Nurse57121,2558693%9.2
Licensed Practical Nurse413171,1459199%6.8
Other Dietary Services Staff2021,0158491%7.6
Nurse Practitioner1126566267%8
Administrator1014746166%7.8
Dental Services Staff2023344549%7.4
Physical Therapy Assistant0333316571%5.1
Physical Therapy Aide0332695964%4.2
Respiratory Therapy Technician0442436975%2.5
Speech Language Pathologist0442377480%1.7
Qualified Social Worker0331786166%2.9
Feeding Assistant0111042628%4
Medical Director011521314%4
Occupational Therapy Assistant0111133%3.7
48 Certified Nursing Assistant
% of Days 100%
12 Registered Nurse
% of Days 93%
17 Licensed Practical Nurse
% of Days 99%
2 Other Dietary Services Staff
% of Days 91%
2 Nurse Practitioner
% of Days 67%
1 Administrator
% of Days 66%
2 Dental Services Staff
% of Days 49%
3 Physical Therapy Assistant
% of Days 71%
3 Physical Therapy Aide
% of Days 64%
4 Respiratory Therapy Technician
% of Days 75%
4 Speech Language Pathologist
% of Days 80%
3 Qualified Social Worker
% of Days 66%
1 Feeding Assistant
% of Days 28%
1 Medical Director
% of Days 14%
1 Occupational Therapy Assistant
% of Days 3%

Penalties and fines

Includes penalties issued in 2025

Federal penalties imposed by CMS for regulatory violations, including civil money penalties (fines) and denials of payment for new Medicare/Medicaid admissions.

Source: CMS Penalties Database (Data as of Jan 2026)

Total fines amount $0 Rank #1 / 293Federal fines — State benchmarkedThis home is ranked 1st out of 293 homes in Indiana. Shows this facility's cumulative CMS federal fine dollars versus the Indiana average among facilities with fines, and where it ranks among 293 facilities in the pool. Lower total dollars mean a better rank.Rankings are based only on facilities in Indiana that report data for that category. Facilities without available data are excluded from the ranking.Click the rank badge to see the full State ranking.Click here to see the full State ranking.
100% lower than Indiana average

Indiana average: $27K

Number of fines 0
100% fewer fines than Indiana average

Indiana average: 1.4

Payment Denials Info Serious action where Medicare and/or Medicaid temporarily stops payments for new residents until issues are fixed. 1
152% more payment denials than Indiana average

Indiana average: 0.4

Fines amount comparison
This facility $0
Indiana average $27K
Penalty History

Penalties are imposed by CMS for violations of federal nursing home regulations.

1 penalty in the past 3 years

Mar 27, 2025 · 6 days

Payment Denial Info Serious action where Medicare and/or Medicaid temporarily stops payments for new residents until issues are fixed. Mar 27, 2025
6 days

Last updated: Jan 2026

Quality of care over time

These measures show how residents usually do over time at this home, based on health outcomes and preventive care.

High-risk clinical events score Info A composite score based on pressure ulcers, falls with injury, weight loss, walking ability decline, and activities of daily living decline. 5.1
36% better than Indiana average

Indiana average: 8.0

Functional decline score Info A composite score based on activities of daily living decline, walking ability decline, and incontinence. 22.7
33% worse than Indiana average

Indiana average: 17.1

Long-stay resident measures
Low Risk Residents with Bowel/Bladder Incontinence Info Percent of low risk long-stay residents who lose control of their bowels or bladder 22.7%
8% better than Indiana average

Indiana average: 24.6%

Falls with Major Injury Info Percent of long-stay residents experiencing one or more falls with major injury 4.2%
8% worse than Indiana average

Indiana average: 3.9%

High Risk Residents with Pressure Ulcers Info Percent of long-stay high risk residents with pressure ulcers 6.1%
39% worse than Indiana average

Indiana average: 4.4%

Urinary Tract Infection Info Percent of long-stay residents with a urinary tract infection 0.0%
100% better than Indiana average

Indiana average: 1.2%

Depressive Symptoms Info Percent of long-stay residents who have depressive symptoms 0.0%
100% better than Indiana average

Indiana average: 24.1%

Antipsychotic Use Info Percent of long-stay residents who received an antipsychotic medication 4.2%
66% better than Indiana average

Indiana average: 12.4%

Pneumococcal Vaccine Info Percent of long-stay residents assessed and appropriately given the pneumococcal vaccine 66.7%
29% worse than Indiana average

Indiana average: 93.7%

Short-stay resident measures
Pneumococcal Vaccine Info Percent of short-stay residents assessed and appropriately given the pneumococcal vaccine 51.8%
37% worse than Indiana average

Indiana average: 81.7%

Antipsychotic medication increase Info Percent of short-stay residents who newly received an antipsychotic medication 2.0%
42% worse than Indiana average

Indiana average: 1.4%

Influenza Vaccine Info Percent of short-stay residents assessed and appropriately given the seasonal influenza vaccine 82.4%
In line with Indiana average

Indiana average: 79.0%

Breakdown by payment type

Medicare

71% of new residents, usually for short-term rehab.

Typical stay 29 days

Private pay

29% of new residents, often for short stays.

Typical stay 5 - 6 months

Facility Characteristics

Source: CMS Long-Term Care Facility Characteristics (Data as of Jan 2026)

Total residents 13
Medicare
8
61.5% of residents
Private pay or other
5
38.5% of residents
Programs & Services
Residents Group

Residents meet regularly to discuss policies, care quality, and activities

Family Member Group

Family members meet regularly to discuss policies, care quality, and activities

CCRC

Part of a Continuing Care Retirement Community offering multiple care levels

Active Family Council

Organized group of family members that meets regularly to discuss facility policies, resident care, and activities.

Active Resident Council

Organized group of residents that meets regularly to discuss facility policies, quality of life, and activities.

Finances and operations

Based on CMS SNF Cost Report for fiscal year ending in 12/2023.

For-profit
LLC
Net patient revenue Info Net patient revenue — what the home actually collects for resident care, after contractual allowances, bad debt and discounts are subtracted from its gross charges (CMS cost report, Worksheet G-3). It covers resident care only; money the home earns from other sources is shown separately as "Other income."
$2.8M
Net patient income Info Net patient income: net patient revenue minus the home's total operating expenses. A positive figure means it earns more from resident care than it spends to deliver it; a negative figure means the opposite. It excludes non-operating "other income."
-$14.5M
For-profit LLC
Net patient revenue Info Net patient revenue — what the home actually collects for resident care, after contractual allowances, bad debt and discounts are subtracted from its gross charges (CMS cost report, Worksheet G-3). It covers resident care only; money the home earns from other sources is shown separately as "Other income."
$2.8M Rank #33 / 294Revenue — State benchmarkedThis home is ranked 33rd out of 294 homes in Indiana. Shows this facility's annual revenue compared to the Indiana average. Higher revenue generally means more resources for staffing and capital — read alongside Payroll %.Rankings are based only on facilities in Indiana that report data for that category. Facilities without available data are excluded from the ranking.Click the rank badge to see the full State ranking.Click here to see the full State ranking.
Net patient income Info Net patient income: net patient revenue minus the home's total operating expenses. A positive figure means it earns more from resident care than it spends to deliver it; a negative figure means the opposite. It excludes non-operating "other income."
-$14.5M
Other income Info Money the home earns outside of resident care — such as investments, grants, rentals and other non-operating sources (CMS cost report, Worksheet G-3). It is tracked separately from net patient revenue: it is not part of that figure, and it is not included in net patient income.
$15.0M
Payroll costs Info Staff salaries plus wage-related costs — benefits such as payroll taxes, health insurance and retirement — from the home's own accounting records (CMS cost report, Worksheet A). Contract or agency labor is counted separately, under other operating costs. Rank #139 / 294Payroll — State benchmarkedThis home is ranked 139th out of 294 homes in Indiana. Shows total annual staff payroll benchmarked to the Indiana average. Higher payroll investment relative to peers often signals better staffing and less reliance on cheaper contract labor.Rankings are based only on facilities in Indiana that report data for that category. Facilities without available data are excluded from the ranking.Click the rank badge to see the full State ranking.Click here to see the full State ranking.
$4.7M 167.6% of net patient revenue Info Payroll as a share of revenue: staff salaries and wage-related benefits divided by net patient revenue. A higher figure means more of each revenue dollar goes to staff pay. Rank #291 / 294Payroll % — State benchmarkedThis home is ranked 291st out of 294 homes in Indiana. Shows payroll as a percentage of revenue versus the Indiana average. Well-run Indiana facilities typically land around 54–68% — the top third Statewide. Below 25% may signal understaffing or heavy agency use — read with Staffing ratings.Rankings are based only on facilities in Indiana that report data for that category. Facilities without available data are excluded from the ranking.Click the rank badge to see the full State ranking.Click here to see the full State ranking.
Other operating costs Info Everything it costs to run the home apart from payroll — food, utilities, supplies, maintenance, contract labor and administration. Calculated as total operating expense minus payroll (staff salaries and wage-related benefits).
$12.6M
Total costs Info The home's total operating expense for the year — all the costs of running it, salaries included (CMS cost report, Worksheet G-3).
$17.3M

What does this home offer?

Pets allowed icon
Pets allowed icon

Pets Allowed

Room sizes icon
Room sizes icon

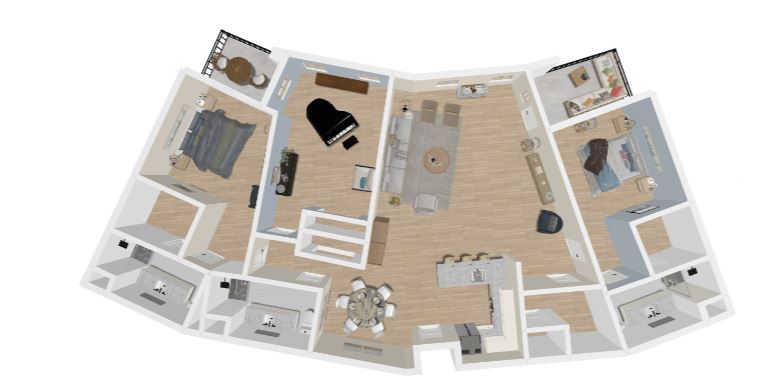
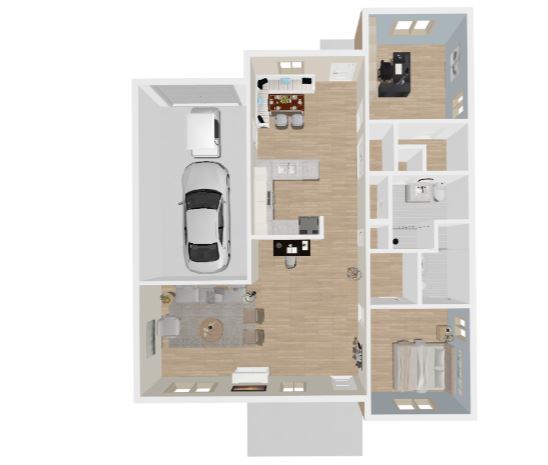
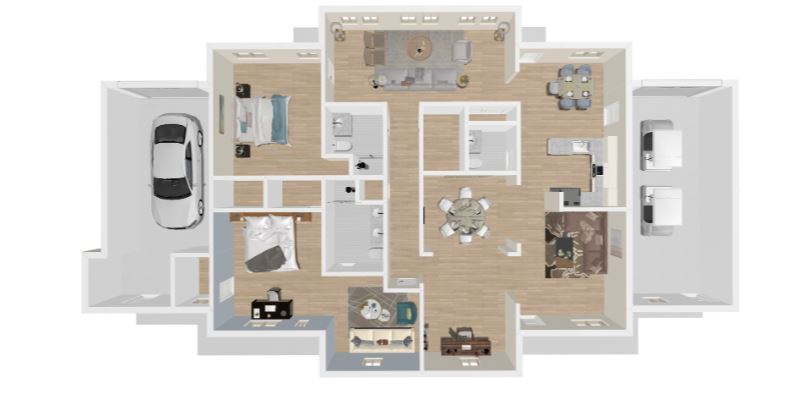
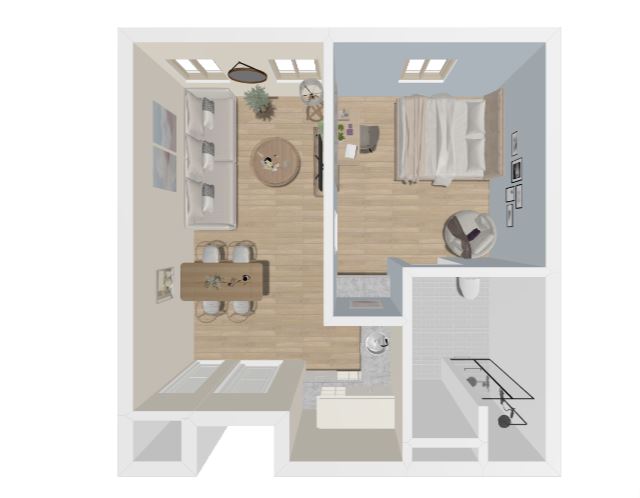
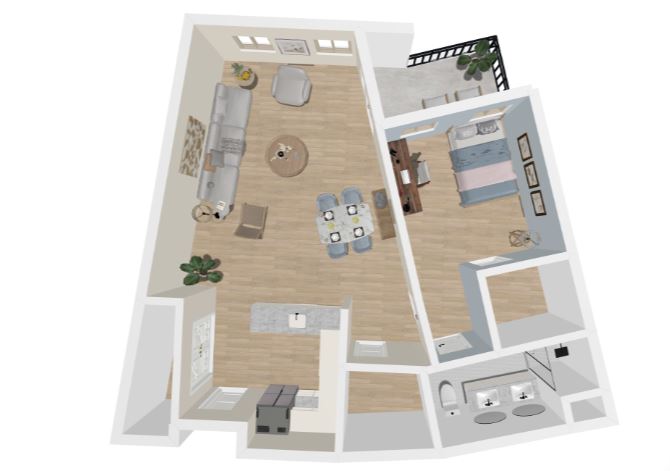
Room Sizes: 488 / 654 / 737 / 752 - 2,346 sq. ft

Housing options icon

Housing Options: Suite / 1 Bed / 2 Bed

Building type icon
Building type icon

Building Type: Mid-rise

Transportation services icon

Transportation Services

Fitness and recreation icon

Fitness and Recreation

Who this home usually serves

TYPE OF STAY

Mostly short-term rehab stays

Most residents typically stay for a few weeks or months before returning home or moving on.

Most new residents arrive under Medicare (71% of admissions), and a typical Medicare stay runs around 29 days.

Admissions
65 total

Coverage residents most often arrive under.

Medicare 71%
Private pay 29%
Discharges
68 total

Coverage residents most often leave under.

Medicare 71%
Private pay 29%

Living Spaces & Floor Plans for The Stratford

The Stratford Plan 3
The Stratford Plan 2
The Stratford Plan 1
The Stratford Plan 5
The Stratford Plan 4

Places of interest near The Stratford

Address 5.0 miles from city center Info Estimated distance in miles from Carmel's city center to The Stratford's address, calculated via Google Maps. — 4.48 miles to nearest hospital (Ascension St. Vincent Hospital - Indianapolis)

Calculate Travel Distance to The Stratford

Add your location

Address

Compare Nursing Homes around Carmel

The information below is reported by the Indiana Department of Health, Division of Long Term Care.

5 facilities compared · CMS & IN Dept. of Health data

The Barrington of Carmel
NH
AL
IL
MC
Carmel
154
Facility 154
IN AVG 116
Rank #82 / 437
71.4%
Facility 71.4%
IN AVG 69.4%
Rank #174 / 434
+3%
9.22
Facility 9.22
IN AVG 3.44
Rank #1 / 291
-61%+168%
$0
Facility $0
IN AVG $31.4k
Rank #1 / 293
94
Facility 94
IN AVG 83
Rank #47 / 384
5
Facility 5
IN AVG 25.0
Rank #11 / 292
2.5
Facility 2.5
IN AVG 4.1
Rank #52 / 292
-110A+
39
Facility 39
IN AVG 37
Rank #275 / 587
Bhi Retirement Communities Inc
$17.0M
Facility $17.0M
IN AVG $10.7M
Rank #43 / 294
$6.9M
Facility $6.9M
IN AVG $4.2M
Rank #67 / 294
40.6%
Facility 40.6%
IN AVG 42%
Rank #217 / 294
155817
The Stratford
NH
AL
IL
MC
Carmel (The Village Of West Clay)
18
Facility 18
IN AVG 116
Rank #436 / 437
65.6%
Facility 65.6%
IN AVG 69.4%
Rank #225 / 434
-6%
7.08
Facility 7.08
IN AVG 3.44
Rank #3 / 291
+17%+106%
$0
Facility $0
IN AVG $31.4k
Rank #1 / 293
-
16
Facility 16
IN AVG 25.0
Rank #93 / 292
4.0
Facility 4.0
IN AVG 4.1
Rank #153 / 292
-12A+
54
Facility 54
IN AVG 37
Rank #188 / 587
Chris Wente
$2.8M
Facility $2.8M
IN AVG $10.7M
Rank #33 / 294
$4.7M
Facility $4.7M
IN AVG $4.2M
Rank #139 / 294
167.6%
Facility 167.6%
IN AVG 42%
Rank #291 / 294
155794
The Restoracy of Carmel
NH
MC
Carmel (Carmel Arts & Design District)
72
Facility 72
IN AVG 116
Rank #344 / 437
94.4%
Facility 94.4%
IN AVG 69.4%
Rank #12 / 434
+36%
4.61
Facility 4.61
IN AVG 3.44
Rank #27 / 291
-46%+34%
$0
Facility $0
IN AVG $31.4k
Rank #1 / 293
70
Facility 70
IN AVG 83
Rank #326 / 384
44
Facility 44
IN AVG 25.0
Rank #251 / 292
6.3
Facility 6.3
IN AVG 4.1
Rank #244 / 292
269A+
77
Facility 77
IN AVG 37
Rank #30 / 587
Euson Lindsay Legacy, LLC
$10.1M
Facility $10.1M
IN AVG $10.7M
Rank #164 / 294
$4.4M
Facility $4.4M
IN AVG $4.2M
Rank #147 / 294
43.7%
Facility 43.7%
IN AVG 42%
Rank #133 / 294
155846
Bridgewater Healthcare Center
NH
HC
NC
PC
RC
Carmel (Carey Road)
120
Facility 120
IN AVG 116
Rank #167 / 437
85.0%
Facility 85.0%
IN AVG 69.4%
Rank #63 / 434
+22%
3.52
Facility 3.52
IN AVG 3.44
Rank #107 / 291
+8%+2%
$0
Facility $0
IN AVG $31.4k
Rank #1 / 293
77
Facility 77
IN AVG 83
Rank #228 / 384
23
Facility 23
IN AVG 25.0
Rank #149 / 292
5.8
Facility 5.8
IN AVG 4.1
Rank #224 / 292
-111F
49
Facility 49
IN AVG 37
Rank #214 / 587
Carey Mgt Co LLC
$14.9M
Facility $14.9M
IN AVG $10.7M
Rank #68 / 294
$6.5M
Facility $6.5M
IN AVG $4.2M
Rank #66 / 294
43.7%
Facility 43.7%
IN AVG 42%
Rank #182 / 294
155790
Carmel Health & Living Community
NH
HC
MC
RC
Carmel (Newark Village)
188
Facility 188
IN AVG 116
Rank #40 / 437
75.5%
Facility 75.5%
IN AVG 69.4%
Rank #138 / 434
+9%
3.73
Facility 3.73
IN AVG 3.44
Rank #72 / 291
+22%+8%
$0
Facility $0
IN AVG $31.4k
Rank #1 / 293
69
Facility 69
IN AVG 83
Rank #341 / 384
33
Facility 33
IN AVG 25.0
Rank #205 / 292
4.1
Facility 4.1
IN AVG 4.1
Rank #167 / 292
1138A+
78
Facility 78
IN AVG 37
Rank #25 / 587
Cardon Management Company LLC
$18.5M
Facility $18.5M
IN AVG $10.7M
Rank #11 / 294
$7.5M
Facility $7.5M
IN AVG $4.2M
Rank #17 / 294
40.6%
Facility 40.6%
IN AVG 42%
Rank #215 / 294
155181

Financial Assistance for
Nursing Home in Indiana

The Stratford is located in Carmel, Indiana.
Here are the financial assistance programs available to residents in Indiana.

Get Financial aid guidance

Aged and Disabled Waiver

Indiana Medicaid A&D Waiver

Age 65+ or disabled
General Indiana resident, Medicaid-eligible, nursing home-level care need.
Income Limits (2025) ~$2,829/month 300% FBR, individual
Asset Limits $2,000 (individual), $3,000 (couple).
IN

Requires level-of-care determination.

Benefits
Personal care (5-7 hours/day) Respite (240 hours/year) Adult day care (~$60/day) Home health services

CHOICE Program

Indiana CHOICE

Age 60+
General Indiana resident, at risk of nursing home.
Income Limits ~$2,000/month varies
Asset Limits $10,000 individual
IN

Limited funding; regional variation.

Benefits
In-home care (3-5 hours/week) Respite (up to 10 days/year) Transportation (~5 trips/month)

Residential Care Assistance Program (RCAP)

Indiana Residential Care Assistance Program

Age 65+
General or blind, or disabled, Indiana resident, in approved facility, low-income or SSI recipient.
Income Limits (2025) ~$1,004/month including SSI
Asset Limits $2,000 (individual), $3,000 (couple).
IN

~50 facilities statewide; per diem rate set by FSSA.

Benefits
Room/board Laundry Minimal care coordination (~$20-$50/day subsidy)

Medicare Savings Program (MSP)

Indiana Medicare Savings Program

Age 65+ or disabled
General Indiana resident, Medicare Part A/B.
Income Limits (2025) ~$2,510/month (QMB), ~$3,380/month (SLMB), ~$3,598/month (QI)—individual.
Asset Limits $9,430 (individual), $14,130 (couple).
IN

Three tiers; no waitlist.

Benefits
Covers Part B premiums ($174.70/month) Deductibles ($240/year) Copays (~20%)

National Family Caregiver Support Program (NFCSP) Respite

Indiana NFCSP Respite Care

Age
General Caregivers of 60+ needing care or 55+ caregivers of others; Indiana resident; functional needs (2+ ADLs).
Income Limits (2025) Prioritizes ~$24,980/year (individual); no strict cap.
Asset Limits Not assessed; need-based.
IN

16 AAAs; prioritizes low-income, rural caregivers.

Benefits
Respite (4-6 hours/week or 5 days/year) Adult day care ($60/day) Caregiver training

VA Aid and Attendance (A&A) and Housebound Benefits

Indiana VA Aid and Attendance/Housebound

Age 65+ or disabled veteran/spouse
General Indiana resident, wartime service, need for ADL help (A&A) or homebound.
Income Limits (2025) Net income < ~$1,984/month (veteran with dependent, A&A); pension offsets income.
Asset Limits ~$155,356 net worth limit
IN

High veteran demand statewide.

Benefits
Cash (~$1,433-$2,642/month veteran, ~$951-$1,318 spouse) for care costs (e.g., in-home, assisted living)

Frequently Asked Questions about The Stratford

What neighborhood is The Stratford in?

The Stratford is in the The Village of West Clay neighborhood of Carmel.

Is The Stratford in a walkable area?

The Stratford has a walk score of 54. Moderately walkable. Some errands can be accomplished on foot, with a mix of nearby amenities.

What is the occupancy rate at The Stratford?

The Stratford's occupancy is 65.6%.

Does The Stratford operate as a for-profit or non-profit?

The Stratford is registered as a for-profit in IN.

Are there photos of The Stratford?

Yes — there are 6 photos of The Stratford in the photo gallery on this page.

What is the address of The Stratford?

The Stratford is located at 2460 Glebe St, Carmel, IN 46032.

What is the phone number of The Stratford?

(317) 854-0219 will put you in contact with the team at The Stratford.

Guides for Better Senior Living

Care Cost Calculator: See Prices in Your Area

Nursing Home Data Explorer

Don’t Wait Too Long: 7 Red Flag Signs Your Parent Needs Assisted Living Now

The True Cost of Assisted Living in 2025 – And How Families Are Paying For It

Understanding Senior Living Costs: Pricing Models, Discounts & Financial Assistance