The Terrace at The Eddy Memorial
Nursing Home · New York, NY
CMS overall rating Info The Overall CMS Rating is scored from 1 to 5 stars and combines results from health inspections, staffing levels, and quality measures. Health inspections carry the most weight. Staffing and quality scores can increase or decrease the final rating based on performance compared to state and national standards.

The Terrace at The Eddy Memorial

Nursing Home · New York, NY
CMS overall rating Info The Overall CMS Rating is scored from 1 to 5 stars and combines results from health inspections, staffing levels, and quality measures. Health inspections carry the most weight. Staffing and quality scores can increase or decrease the final rating based on performance compared to state and national standards.
Calculator: See prices in your area
The Terrace at The Eddy Memorial accepts Medicare, Medicaid, and private pay.

Overview of The Terrace at the Eddy Memorial

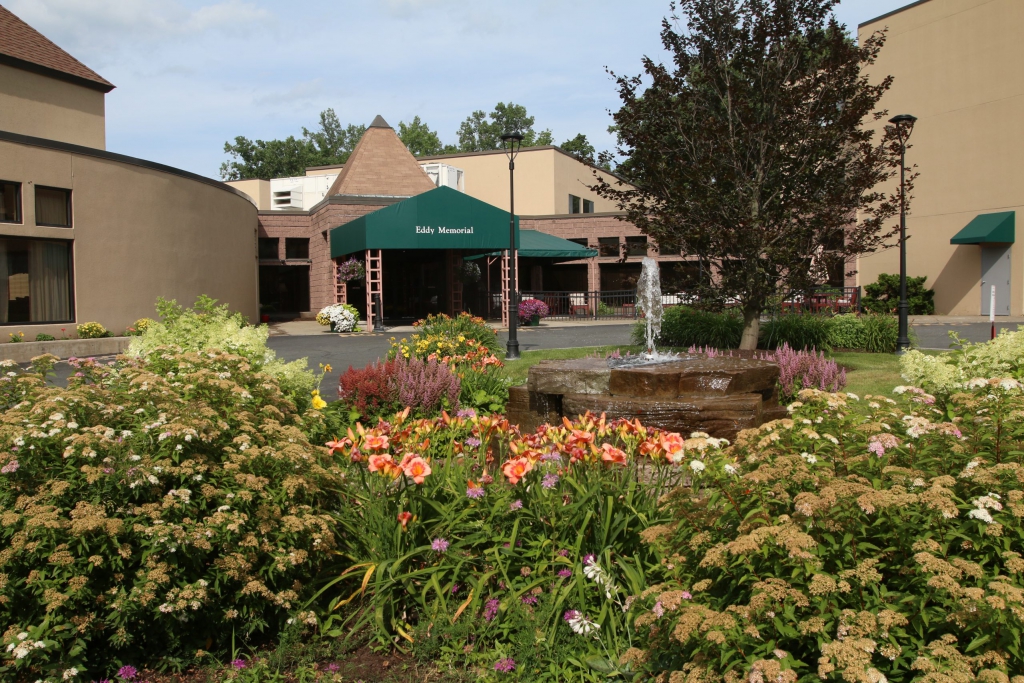
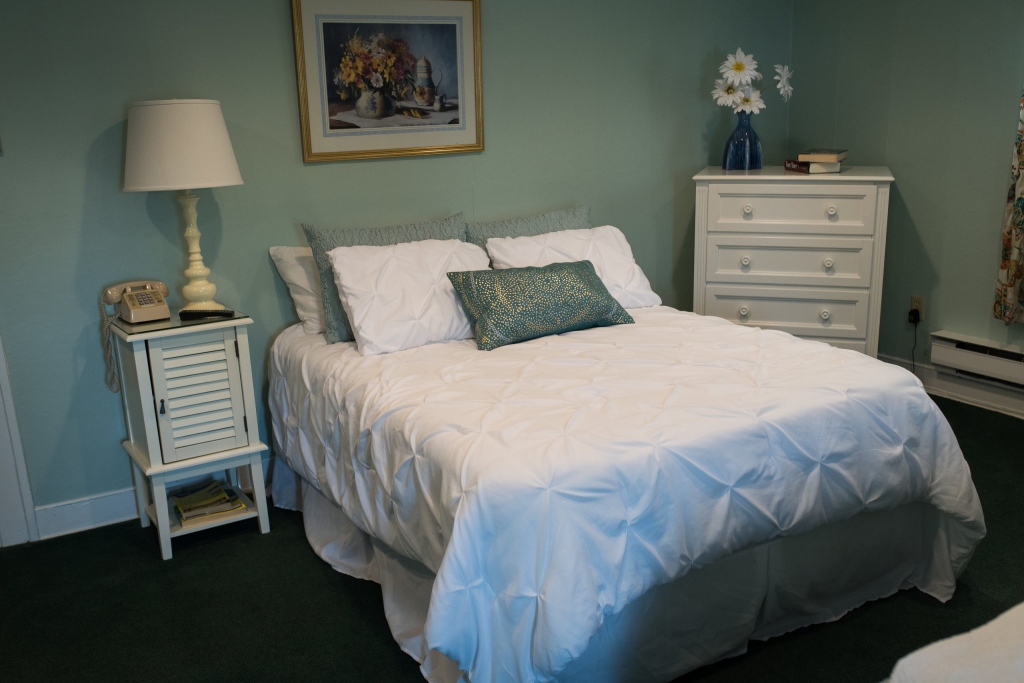
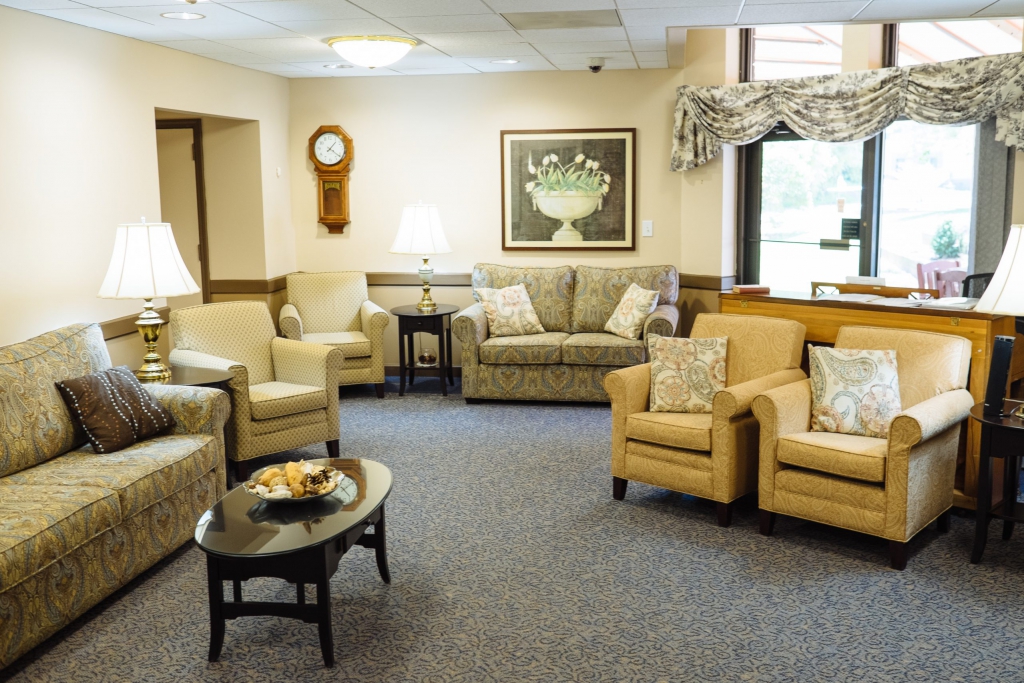
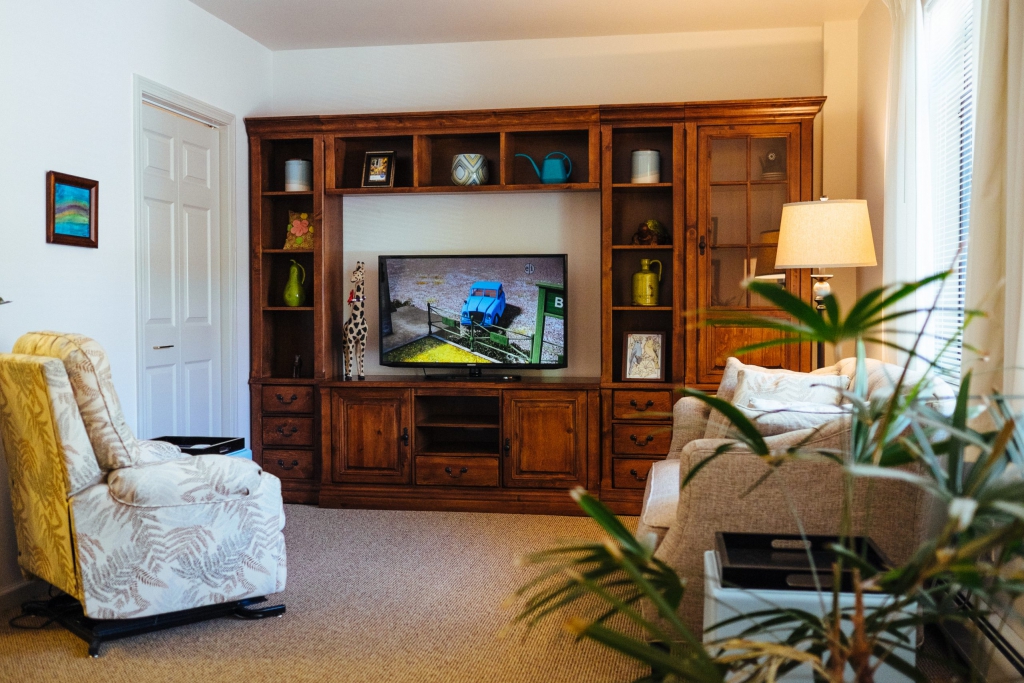
The Terrace at Eddy Memorial in Troy, NY, is an assisted living community offering comfortable studio and 1-bedroom apartments, a range of amenities, and dedicated care services. Residents can enjoy on-site activities, air-conditioning, cable TV, and access to a beautician. The community provides various care services, including diabetic care, incontinence care, and medication management.

(518) 274-9890

Quality ratings

Measured by Centers for Medicare & Medicaid Services (CMS)

Overall rating Info The Overall CMS Rating combines results from health inspections, staffing levels and quality measures. Health inspections carry the most weight. Staffing and quality scores can increase or decrease the final rating based on performance compared to state and national standards.
▼ 4.5% Below NY avg. ▼ 4.5% Below NY avg.Click the badge to see the full State ranking.Click here to see the full State ranking.
Health Inspection Info Based on the results of the facility's three most recent standard inspections and any complaint investigations. CMS reviews the number, scope, and severity of deficiencies, with more recent findings weighted more heavily.
▲ 5.6% Above NY avg. ▲ 5.6% Above NY avg.Click the badge to see the full State ranking.Click here to see the full State ranking.
Staffing Info Measures average nursing staff hours per resident per day, including Registered Nurses (RNs) and total nursing staff. Ratings are adjusted based on the level of care residents require and are compared to state and national benchmarks.
▲ 48.1% Above NY avg. ▲ 48.1% Above NY avg.Click the badge to see the full State ranking.Click here to see the full State ranking.
Quality Measures Info Based on clinical and physical health indicators reported to CMS, such as hospital readmissions, falls, pressure ulcers, and improvements in mobility. These measures reflect how well residents' health needs are being managed.
▼ 49.4% Below NY avg. ▼ 49.4% Below NY avg.Click the badge to see the full State ranking.Click here to see the full State ranking.

Staffing hours breakdown

Info Daily nursing hours per resident by staff type, reported to CMS. Higher is generally better — compare this facility to state and national averages to see where staffing stands.

Hours per resident per day — compared to New York state averages

Total nursing care / resident Info This home is ranked 31st out of 388 homes in New York. Total adjusted nursing hours per resident per day, combining RN, LPN, and aide time. CMS adjusts this for case-mix so facilities can be fairly compared.
4h 33m per day
Rank #31 / 388Nurse hours — State benchmarkedThis home is ranked 31st out of 388 homes in New York. Shows adjusted nurse hours per resident per day benchmarked to the New York average, with a ranking across 388 New York SNFs. More hours mean more direct care. The national average is about 3.5 hrs; below 3.0 is a red flag.Click the rank badge to see the full State ranking.Click here to see the full State ranking.
This facility New York avg (3h 29m per day)
vs New York avg
+30%
Staff typeHours / Day / Residentvs state avg
Weekend Total Nursing Info Combined nursing hours (RN + LPN + Nurse Aide) per resident per day on weekends. Staffing often drops on weekends — this figure reveals whether the facility maintains adequate coverage outside of weekday hours. 3h 20m per day

Capacity and availability

This home is often near full

Occupancy higher than 95% suggests steady demand, but availability may be limited.

Higher occupancy than the New York average: 88.3%
Occupancy rate 95.6% Rank #111 / 433Occupancy rate — State benchmarkedThis home is ranked 111th out of 433 homes in New York. Shows this facility's occupancy rate versus the New York average, with its Statewide rank out of 433. Higher occupancy signals strong local demand and financial stability.Click the rank badge to see the full State ranking.Click here to see the full State ranking.
Avg. Length of Stay 457 days
Occupancy rate
95.6% Rank #111 / 433Occupancy rate — State benchmarkedThis home is ranked 111th out of 433 homes in New York. Shows this facility's occupancy rate versus the New York average, with its Statewide rank out of 433. Higher occupancy signals strong local demand and financial stability.Click the rank badge to see the full State ranking.Click here to see the full State ranking.
Avg. Length of Stay
457 days
Bed community size
69-bed community Rank #626 / 752Bed count — State benchmarkedThis home is ranked 626th out of 752 homes in New York. Shows this facility's certified or reported bed count compared to other New York SNFs. Larger communities may offer more amenities, programs, and on-site services for residents and families.Click the rank badge to see the full State ranking.Click here to see the full State ranking.
A moderately sized community that may balance personal attention with shared amenities and social activities.
Walk Score
Walk Score: 91 / 100 Rank #236 / 1167Walk Score — State benchmarkedThis home is ranked 236th out of 1167 homes in New York. Shows how walkable this facility's neighborhood is compared to the average Walk Score across New York SNFs. Higher scores benefit residents, families, and staff.Click the rank badge to see the full State ranking.Click here to see the full State ranking.
Walker's paradise. Daily errands do not require a car, with many shops and services nearby.

About this community

License Details

Facility TypeEnriched Housing Program
StatusActive
CountyRensselaer
License Number600-S-001
CMS Certification Number335680

Ownership & Operating Entity

Owner NameThe James A. Eddy Memorial Geriatric Center, Inc.

Safety & Compliance

Wheelchair Accessible

Therapy & Rehabilitation

1 service
Respite Care

Additional Policies & Features

Pets Allowed

Amenities & Lifestyle

Activities Off-Site
Activities On-Site
Air-Conditioning
Beautician On-Site
Cable Or Satellite Tv
Devotional Services Off-Site
Ground Floor Units
Handicap Accessible
Indoor Common Areas
Kitchenette
Outdoor Common Areas
Respite Or Short Term Stays Offered
Wi-Fi/High-Speed Internet
ActivitiesVarious activities designed to promote mental and physical well-being, including brain fitness exercises, day trips, educational speakers, and live entertainment.

Pricing & Financial Information

Starting Price$4,700 - $6,400 per month

Dining & Nutrition

Food DescriptionMeals are served restaurant style with dietary needs in mind, including low/no sodium options and vegetarian meals prepared by a professional chef.

Contact The Terrace at The Eddy Memorial

Inspection History

In New York State, the Department of Health, Office of Aging and Long Term Care performs unannounced onsite inspections to monitor compliance with state and federal healthcare regulations.

Inspection Score Info A composite 0–100 score combining this facility's inspections, citations, complaints, and enforcement actions relative to the New York State state average. See the nursing homes benchmark below for the typical New York State score; higher is better.

B- · Above the New York State average for nursing homes.

New York State nursing homes benchmark: C 74/100

Inspection score: 81 out of 100. Letter grade B-. Above the New York State average for nursing homes.

Inspection Scorecard Info This scorecard compares key inspection, citation, and complaint metrics at this facility against the New York State state average. Metrics rated ≥15% worse than average are highlighted in red; those ≥15% better are highlighted in green.

Since 2021 vs. New York State state average
Overall vs. NY average 4 Worse Metrics worse than New York State average:
• Total citations (115% above)
• Citations per year (115% above)
• Citations per inspection (400% above)
• Inspection citation rate (127% above)
1 At Avg Metrics at New York State average:
• Inspections with citations (at NY avg)
5 Better Metrics better than New York State average:
• Total inspections (56% below)
• Total complaints (97% below)
• Complaints per year (97% below)
• Complaints per bed (94% below)
• Complaint investigations (100% below)
Latest Inspection July 23, 2025 Renewal

Citations Info Citations are formal regulatory issues recorded during state inspections.

This FacilityNY Averagevs. NY Avg
Total citations Info Formal regulatory issues recorded by inspectors across all inspection types. 2813 This facility has 115% more total citations than a typical New York State nursing home (28 vs. NY avg 13).↑ 115% worse
Citations per year Info Average citations per year since 2021. 5.62.6 This facility has 115% more citations per year than a typical New York State nursing home (5.6 vs. NY avg 2.6).↑ 115% worse
Citations per inspection Info Average citations per inspection. 71.4 This facility has 400% more citations per inspection than a typical New York State nursing home (7 vs. NY avg 1.4).↑ 400% worse

Inspections Info State inspections evaluate whether the facility meets health and safety standards.

This FacilityNY Averagevs. NY Avg
Total inspections Info Combined count of all routine and focused inspections. Excludes complaint investigations. 49 This facility has 56% fewer total inspections than a typical New York State nursing home (4 vs. NY avg 9).↓ 56% better
Inspections with citations Info Inspections that resulted in at least one regulatory citation. 44 This facility has inspections with citations in line with the New York State average (4 vs. NY avg 4).— At avg
Inspection citation rate Info Percentage of inspections that resulted in at least one citation. 100%44% This facility has 56 percentage points higher inspection citation rate than a typical New York State nursing home (100% vs. NY avg 44%).↑ 56% worse

Complaints & Investigations Info Complaints are formal concerns filed by residents, families, or staff. Investigations are on-site follow-ups.

This FacilityNY Averagevs. NY Avg
Total complaints Info Formal expressions of concern made by residents, families, or staff. 279 This facility has 97% fewer total complaints than a typical New York State nursing home (2 vs. NY avg 79).↓ 97% better
Complaints per year Info Average complaints per year since 2021. 0.415.8 This facility has 97% fewer complaints per year than a typical New York State nursing home (0.4 vs. NY avg 15.8).↓ 97% better
Complaints per bed Info Size-adjusted complaint rate based on occupied beds. 0.030.50 This facility has 94% fewer complaints per bed than a typical New York State nursing home (0.03 vs. NY avg 0.5).↓ 94% better
Complaint investigations Info On-site investigations triggered by complaints filed with New York State regulators. 015 This facility has 100% fewer complaint investigations than a typical New York State nursing home (0 vs. NY avg 15).↓ 100% better

Inspection Reports Summary Info An editor-reviewed summary of the themes and findings across this facility's recent inspection reports.

The most recent inspection on July 23, 2025, cited deficiencies related to medication assistance recording, medication storage, case management, food safety, building maintenance, equipment condition, inspection certificates, and medical evaluations for prospective residents, with a plan of correction approved. Earlier inspections showed a pattern of similar issues, including resident protections, supervision, medication management, environmental standards, and admission and retention requirements. Complaint investigations were not listed in the available reports. No fines, immediate jeopardy findings, or license actions were noted in any report. The inspection history indicates ongoing challenges in several operational areas, with some fluctuations but no clear trend of improvement or worsening over time.

Read the full inspection reports for this facility, including detailed findings and corrective actions.

Show Inspection Reports

Health Inspection History

Inspections since 2019
Total health inspections 3

New York State average 3.6


Last Health inspection on Aug 2024

Total health citations
17 Rank #203 / 394Health citations — State benchmarkedThis home is ranked 203rd out of 394 homes in New York. Shows this facility's total health deficiency citations benchmarked to the New York State average, with a ranking across all 394 NY SNFs. Lower citation counts earn a better rank.Click the rank badge to see the full State ranking.Click here to see the full State ranking.

New York State average 18.5

Citations per inspection
5.67 Rank #263 / 394Citations per inspection — State benchmarkedThis home is ranked 263rd out of 394 homes in New York. Shows average deficiency citations per CMS inspection for this facility versus the New York mean across 394 SNFs with citation data. Lower is better.Click the rank badge to see the full State ranking.Click here to see the full State ranking.

New York State average 5.05


Health citations are formal notices following inspections when they fail to comply with safety and care standards.

16 of 17 citations resulted from standard inspections; and 1 of 17 came from combined inspections (standard and complaint).

Breakdown of citation severity (last 7 years)
Critical Health citations
0
100% better than New York State average

New York State average: 0.2


Serious Health citations
0
100% better than New York State average

New York State average: 0.2

0 critical citations New York State average: 0.2

0 serious citations New York State average: 0.2

17 moderate citations New York State average: 17.4

0 minor citations New York State average: 0.7
Citations history (last 7 years)
Infection Control moderate citation Aug 09, 2024
Corrected

Nutrition moderate citation Aug 09, 2024
Corrected

Pharmacy moderate citation Aug 09, 2024
Corrected

Quality of Care moderate citation Aug 09, 2024
Corrected

Staffing Data

Reporting period: October 1 – December 31, 2025 (Q4 2025). Source: CMS Payroll-Based Journal report.

Total staff 122
Employees 106
Contractors 16
Staff to resident ratio 1.61:1
816% better than New York average
New York average ratio: 0.18:1 New York average ratio: 0.18:1See full New York ranking
Avg staff/day 47
Average shift 7.5 hours
0% compared with New York average
New York average: 7.7 hours New York average shift: 7.7 hoursSee full New York ranking
Total staff hours (quarter) 32,452

Nursing staff breakdown

Q4 2025 · Oct 1 – Dec 31 More info This data comes from the CMS Payroll-Based Journal report covering October 1 – December 31, 2025.
Registered Nurse

Manages medical care and health needs.

RN Staff 2
Average shift length Info Average shift length. Calculated as total hours divided by days worked and average staff per day. 6.1 hours

No contractors work on this role.

Licensed Practical Nurse

Assists with medical care and medications.

LPN Staff 32
Average shift length Info Average shift length. Calculated as total hours divided by days worked and average staff per day. 7.5 hours

No contractors work on this role.

Certified Nursing Assistant

Helps with daily care and mobility.

CNA Staff 43
Average shift length Info Average shift length. Calculated as total hours divided by days worked and average staff per day. 7.8 hours

No contractors work on this role.

Contractor staffing

Q4 2025 · Oct 1 – Dec 31 More info This data comes from the CMS Payroll-Based Journal report covering October 1 – December 31, 2025.

Total hours from contractors

8.6%

2,794 contractor hours this quarter

Respiratory Therapy Technician: 7 Qualified Social Worker: 3 Physical Therapy Aide: 2 Physical Therapy Assistant: 1 Occupational Therapy Aide: 1 Medical Director: 1 Feeding Assistant: 1

Staff by category

Q4 2025 · Oct 1 – Dec 31 More info This data comes from the CMS Payroll-Based Journal report covering October 1 – December 31, 2025.
Certified Nursing Assistant4304314,03792100%7.8
Licensed Practical Nurse320328,30492100%7.5
Clinical Nurse Specialist120123,2289199%7.4
Other Dietary Services Staff5051,7608997%7.7
Respiratory Therapy Technician0771,31192100%6.9
Occupational Therapy Aide0115286672%8
Nurse Practitioner1014976267%8
Nurse Aide in Training7074895459%7.5
Dietitian1014716065%7.8
Physical Therapy Assistant0114435964%7.5
Administrator1013844852%8
Mental Health Service Worker2023485054%6.1
Qualified Social Worker0332265054%3.9
Feeding Assistant0112082628%8
Registered Nurse2021412224%6.1
Medical Director011521314%4
Physical Therapy Aide02226910%2.9
43 Certified Nursing Assistant
% of Days 100%
32 Licensed Practical Nurse
% of Days 100%
12 Clinical Nurse Specialist
% of Days 99%
5 Other Dietary Services Staff
% of Days 97%
7 Respiratory Therapy Technician
% of Days 100%
1 Occupational Therapy Aide
% of Days 72%
1 Nurse Practitioner
% of Days 67%
7 Nurse Aide in Training
% of Days 59%
1 Dietitian
% of Days 65%
1 Physical Therapy Assistant
% of Days 64%
1 Administrator
% of Days 52%
2 Mental Health Service Worker
% of Days 54%
3 Qualified Social Worker
% of Days 54%
1 Feeding Assistant
% of Days 28%
2 Registered Nurse
% of Days 24%
1 Medical Director
% of Days 14%
2 Physical Therapy Aide
% of Days 10%

Penalties and fines

Federal penalties imposed by CMS for regulatory violations, including civil money penalties (fines) and denials of payment for new Medicare/Medicaid admissions.

Source: CMS Penalties Database

No penalties in the past 3 years

No civil money penalties or payment denials were reported in the last 3 years.

Quality of care over time

These measures show how residents usually do over time at this home, based on health outcomes and preventive care.

High-risk clinical events score Info A composite score based on pressure ulcers, falls with injury, weight loss, walking ability decline, and activities of daily living decline. 11.4
16% worse than New York State average

New York State average: 9.8

Functional decline score Info A composite score based on activities of daily living decline, walking ability decline, and incontinence. 25.3
39% worse than New York State average

New York State average: 18.1

Long-stay resident measures
Need for Help with Daily Activities Increased Info Percent of long-stay residents whose need for help with daily activities has increased 26.0%
58% worse than New York State average

New York State average: 16.4%

Walking Ability Worsened Info Percent of long-stay residents whose ability to move independently worsened 21.6%
30% worse than New York State average

New York State average: 16.6%

Low Risk Residents with Bowel/Bladder Incontinence Info Percent of low risk long-stay residents who lose control of their bowels or bladder 28.2%
32% worse than New York State average

New York State average: 21.4%

Falls with Major Injury Info Percent of long-stay residents experiencing one or more falls with major injury 4.0%
34% worse than New York State average

New York State average: 3.0%

High Risk Residents with Pressure Ulcers Info Percent of long-stay high risk residents with pressure ulcers 3.2%
55% better than New York State average

New York State average: 7.2%

Urinary Tract Infection Info Percent of long-stay residents with a urinary tract infection 1.0%
29% better than New York State average

New York State average: 1.4%

Lost Too Much Weight Info Percent of long-stay residents who lose too much weight 2.1%
66% better than New York State average

New York State average: 6.1%

Depressive Symptoms Info Percent of long-stay residents who have depressive symptoms 0.7%
96% better than New York State average

New York State average: 18.1%

Antipsychotic Use Info Percent of long-stay residents who received an antipsychotic medication 15.3%
22% worse than New York State average

New York State average: 12.6%

Pneumococcal Vaccine Info Percent of long-stay residents assessed and appropriately given the pneumococcal vaccine 92.7%
In line with New York State average

New York State average: 91.4%

Influenza Vaccine Info Percent of long-stay residents assessed and appropriately given the seasonal influenza vaccine 98.7%
In line with New York State average

New York State average: 95.2%

Short-stay resident measures
Pneumococcal Vaccine Info Percent of short-stay residents assessed and appropriately given the pneumococcal vaccine 88.5%
15% better than New York State average

New York State average: 76.6%

Breakdown by payment type

Medicare

23% of new residents, usually for short-term rehab.

Typical stay 2 - 3 months

Private pay

51% of new residents, often for short stays.

Typical stay 8 months

Medicaid

26% of new residents, often for long-term daily care.

Typical stay 3 years

Facility Characteristics

Source: CMS Long-Term Care Facility Characteristics (Data as of Jan 2026)

Total residents 76
Medicare
2
2.6% of residents
Medicaid
49
64.5% of residents
Private pay or other
25
32.9% of residents
Programs & Services
Residents Group

Residents meet regularly to discuss policies, care quality, and activities

Active Resident Council

Organized group of residents that meets regularly to discuss facility policies, quality of life, and activities.

Finances and operations

Voluntary non-profit community
Home revenue
$17.7M
Operating deficit
-$2.0M
Voluntary non-profit community
Home revenue
$17.7M Rank #296 / 383Revenue — State benchmarkedThis home is ranked 296th out of 383 homes in New York. Shows this facility's annual revenue compared to the New York SNF average. Higher revenue generally means more resources for staffing and capital — read alongside Payroll %.Click the rank badge to see the full State ranking.Click here to see the full State ranking.
Operating deficit
-$2.0M
Payroll costs Info The portion of the home's budget spent on staff, including nurses, caregivers, and other employees who support care and operations. Rank #280 / 383Payroll — State benchmarkedThis home is ranked 280th out of 383 homes in New York. Shows total annual staff payroll benchmarked to the New York average. Higher payroll investment relative to peers often signals better staffing and less reliance on cheaper contract labor.Click the rank badge to see the full State ranking.Click here to see the full State ranking.
$9.5M
53.5% of revenue Rank #117 / 383Payroll % — State benchmarkedThis home is ranked 117th out of 383 homes in New York. Shows payroll as a percentage of revenue versus the New York average. Well-run New York SNFs typically land around 53–65% — the top third Statewide. Below 25% may signal understaffing or heavy agency use — read with Staffing ratings.Click the rank badge to see the full State ranking.Click here to see the full State ranking.
Other operating costs Info All remaining costs needed to run the home, such as food, utilities, building maintenance, supplies and administrative expenses.
$10.3M
Total costs $19.8M

Who this home usually serves

TYPE OF STAY

Mostly long-term care residents

Most residents stay for extended periods and receive ongoing daily care.

Places of interest near The Terrace at The Eddy Memorial

Address 0.0 miles from city center Info Estimated distance in miles from Troy's city center to The Terrace at The Eddy Memorial's address, calculated via Google Maps.

Calculate Travel Distance to The Terrace at The Eddy Memorial

Add your location

Address

Financial Assistance for
Nursing Home in New York

The Terrace at The Eddy Memorial is located in Troy, New York.
Here are the financial assistance programs available to residents in New York.

Get Financial aid guidance

Community First Choice Option

NY Medicaid CFCO

Age 65+ or disabled
General New York resident, Medicaid- eligible, care need (not necessarily nursing home level).
Income Limits (2025) ~$2,829/month 300% FBR, individual
Asset Limits $30,182 individual, higher due to NY Medicaid expansion
NY

Higher asset limit; urban density increases demand.

Benefits
Personal care (5-7 hours/day) Respite care (240 hours/year) Home modifications ($1,500 avg.) Assistive technology ($500 avg.)

Expanded In-Home Services for the Elderly Program (EISEP)

NY EISEP

Age 60+
General New York resident, at risk of decline but not nursing home level.
Income Limits ~$2,500/month individual, varies
Asset Limits $15,000 individual
NY

Cost-sharing required above certain income; urban/rural balance.

Benefits
In-home care (3-5 hours/week) Respite (up to 10 days/year) Case management Transportation (~5 trips/month)

Senior Citizen Rent Increase Exemption (SCRIE)

NY SCRIE

Age 62+
General NYC resident, live in rent-controlled/stabilized apartment, spend >1/3 of income on rent.
Income Limits (2025) $50,000/year household
Asset Limits No strict asset cap, but income-focused eligibility.
NY

Limited to NYC’s rent-regulated units; high demand in urban areas.

Benefits
Rent freeze (e.g., covers increases of $50-$200+/month); tax credit for landlord

Senior Citizen Homeowners’ Exemption (SCHE)

NY SCHE

Age 65+
General NYC resident, own and live in a 1-3 family home, co-op, or condo.
Income Limits (2025) $58,399/year household
Asset Limits No strict asset cap, income-driven eligibility.
NY

Applies only in NYC; excludes large apartment buildings.

Benefits
Property tax reduction (5-50%, e.g., $500-$5,000/year based on income and property value)

New York Foundation for Senior Citizens (NYFSC) Home Sharing Program

NYFSC Home Sharing

Age One participant must be 60+ (host or guest)
General NYC resident, able to share living space.
Income Limits No strict limit, but targets those needing cost relief.
Asset Limits Not applicable; focus on housing need.
NY

Primarily NYC-focused; limited slots due to demand.

Benefits
Shared housing (reduces rent/living costs by 30-50%, e.g., $500-$1,000/month savings); optional light assistance between housemates

Frequently Asked Questions about The Terrace at The Eddy Memorial

Who is the owner of The Terrace at The Eddy Memorial?

The legal owner and operator of The Terrace at The Eddy Memorial is The James A. Eddy Memorial Geriatric Center, Inc..

Is The Terrace at The Eddy Memorial in a walkable area?

The Terrace at The Eddy Memorial has a walk score of 91. Walker's paradise. Daily errands do not require a car, with many shops and services nearby.

What is the license number of The Terrace at The Eddy Memorial?

According to NY state health department records, The Terrace at The Eddy Memorial's license number is 600-S-001.

How many beds does The Terrace at The Eddy Memorial have?

The Terrace at The Eddy Memorial has 69 beds.

Are there photos of The Terrace at The Eddy Memorial?

Yes — there is 1 photo of The Terrace at The Eddy Memorial in the photo gallery on this page.

What is the address of The Terrace at The Eddy Memorial?

The Terrace at The Eddy Memorial is located at 2256 Burdett Avenue.

What is the phone number of The Terrace at The Eddy Memorial?

(518) 274-9890 will put you in contact with the team at The Terrace at The Eddy Memorial.

Guides for Better Senior Living

Care Cost Calculator: See Prices in Your Area

Nursing Home Data Explorer

Don’t Wait Too Long: 7 Red Flag Signs Your Parent Needs Assisted Living Now

The True Cost of Assisted Living in 2025 – And How Families Are Paying For It

Understanding Senior Living Costs: Pricing Models, Discounts & Financial Assistance

Explore Open Rooms
1 Contact details
2 What type of senior care service are you looking for?
3 What budget do you have in mind for senior care?
4 How soon do you need to find care?
5 Additional details

Thank you for your interest!

Our team will be in touch shortly to help with next steps.