The Waterview Shores Assisted
Nursing Home · Minnesota, MN
CMS overall rating Info The Overall CMS Rating is scored from 1 to 5 stars and combines results from health inspections, staffing levels, and quality measures. Health inspections carry the most weight. Staffing and quality scores can increase or decrease the final rating based on performance compared to state and national standards.

The Waterview Shores Assisted

Nursing Home · Minnesota, MN
CMS overall rating Info The Overall CMS Rating is scored from 1 to 5 stars and combines results from health inspections, staffing levels, and quality measures. Health inspections carry the most weight. Staffing and quality scores can increase or decrease the final rating based on performance compared to state and national standards.
Calculator: See prices in your area
The Waterview Shores Assisted accepts Medicaid, Medicare, and private pay.

Overview of The Waterview Shores Assisted

The Waterview Shores Assisted offers a variety of services to ensure residents have enjoyable and fulfilling lives. The facility provides 24/7 nursing care, rehabilitation, and assisted living services in a comfortable environment. Residents can participate in various activities and enjoy amenities that promote wellness and social engagement.
(218) 834-8374

Quality ratings

Measured by Centers for Medicare & Medicaid Services (CMS)

Overall rating Info The Overall CMS Rating combines results from health inspections, staffing levels and quality measures. Health inspections carry the most weight. Staffing and quality scores can increase or decrease the final rating based on performance compared to state and national standards.
▼ 44.8% Below MN avg. ▼ 44.8% Below MN avg.Click the badge to see the full State ranking.Click here to see the full State ranking.
Health Inspection Info Based on the results of the facility's three most recent standard inspections and any complaint investigations. CMS reviews the number, scope, and severity of deficiencies, with more recent findings weighted more heavily.
▼ 33.3% Below MN avg. ▼ 33.3% Below MN avg.Click the badge to see the full State ranking.Click here to see the full State ranking.
Staffing Info Measures average nursing staff hours per resident per day, including Registered Nurses (RNs) and total nursing staff. Ratings are adjusted based on the level of care residents require and are compared to state and national benchmarks.
▼ 47.1% Below MN avg. ▼ 47.1% Below MN avg.Click the badge to see the full State ranking.Click here to see the full State ranking.
Quality Measures Info Based on clinical and physical health indicators reported to CMS, such as hospital readmissions, falls, pressure ulcers, and improvements in mobility. These measures reflect how well residents' health needs are being managed.
▲ 17.0% Above MN avg. ▲ 17.0% Above MN avg.Click the badge to see the full State ranking.Click here to see the full State ranking.

Staffing hours breakdown

Info Daily nursing hours per resident by staff type, reported to CMS. Higher is generally better — compare this facility to state and national averages to see where staffing stands.

Hours per resident per day — compared to Minnesota state averages

Total nursing care / resident Info This home is ranked 84th out of 85 homes in Minnesota. Total adjusted nursing hours per resident per day, combining RN, LPN, and aide time. CMS adjusts this for case-mix so facilities can be fairly compared.
3h 28m per day
Rank #84 / 85Nurse hours — State benchmarkedThis home is ranked 84th out of 85 homes in Minnesota. Shows adjusted nurse hours per resident per day benchmarked to the Minnesota average, with a ranking across 85 Minnesota SNFs. More hours mean more direct care. The national average is about 3.5 hrs; below 3.0 is a red flag.Click the rank badge to see the full State ranking.Click here to see the full State ranking.
This facility Minnesota avg (5h 7m per day)
vs Minnesota avg
-32%
Staff typeHours / Day / Residentvs state avg
Weekend Total Nursing Info Combined nursing hours (RN + LPN + Nurse Aide) per resident per day on weekends. Staffing often drops on weekends — this figure reveals whether the facility maintains adequate coverage outside of weekday hours. 3h 0m per day

Capacity and availability

This home usually has availability

Occupancy lower than 85% suggests more openings may be available.

Lower occupancy than the Minnesota average: 79.7%
Occupancy rate 79.3% Rank #168 / 328Occupancy rate — State benchmarkedThis home is ranked 168th out of 328 homes in Minnesota. Shows this facility's occupancy rate versus the Minnesota average, with its Statewide rank out of 328. Higher occupancy signals strong local demand and financial stability.Click the rank badge to see the full State ranking.Click here to see the full State ranking.
Avg. Length of Stay 187 days
Occupancy rate
79.3% Rank #168 / 328Occupancy rate — State benchmarkedThis home is ranked 168th out of 328 homes in Minnesota. Shows this facility's occupancy rate versus the Minnesota average, with its Statewide rank out of 328. Higher occupancy signals strong local demand and financial stability.Click the rank badge to see the full State ranking.Click here to see the full State ranking.
Avg. Length of Stay
187 days
Bed community size
46-bed community Rank #272 / 536Bed count — State benchmarkedThis home is ranked 272nd out of 536 homes in Minnesota. Shows this facility's certified or reported bed count compared to other Minnesota SNFs. Larger communities may offer more amenities, programs, and on-site services for residents and families.Click the rank badge to see the full State ranking.Click here to see the full State ranking.
A moderately sized community that may balance personal attention with shared amenities and social activities.
Walk Score
Walk Score: 61 / 100 Rank #159 / 633Walk Score — State benchmarkedThis home is ranked 159th out of 633 homes in Minnesota. Shows how walkable this facility's neighborhood is compared to the average Walk Score across Minnesota SNFs. Higher scores benefit residents, families, and staff.Click the rank badge to see the full State ranking.Click here to see the full State ranking.
Moderately walkable. Some errands can be accomplished on foot, with a mix of nearby amenities.

About this community

License Details

Facility TypeAssisted Living
StatusApproved
CountyLake

Safety & Compliance

Emergency Systems24-hour emergency response system.

Payment & Insurance

2 services
Accept Medicaid
Accept Medicare

Therapy & Rehabilitation

2 services
Rehabilitation Services
Respite Care

Staffing & Medical

2 services
Doctor on Staff
24-Hour Staffing

Amenities & Lifestyle

Private And Semi-Private Room Options
In-House Physical
Occupational
And Speech Therapies
24/7 Nursing Care
Physician
Nurse Practitioners
And Specialty Services
Smoke-Free Campus
Free Wifi Access
Outdoor Walking Path And Patio
Beauty And Barbershop
Social Engagement Activities
On-Site Spiritual Services
Housekeeping
Laundry
And Maintenance
Dining With Specialty Diet Offerings
ActivitiesActivities include socialization, outings, planned events, and more.
Religious ServicesOn-site spiritual services.

Dining & Nutrition

Food DescriptionRestaurant-style dining with specialty diet offerings.

Contact The Waterview Shores Assisted

Inspection History

In Minnesota, the Department of Health, Health Regulation Division is the primary authority for conducting onsite inspections and reporting on the quality of care in residential facilities.

Inspection oversight

  • Latest inspection: October 17, 2025

Health Inspection History

Inspections since 2023
Total health inspections 8

Minnesota average 6


Last Health inspection on Sep 2025

Total health citations
26 Rank #44 / 86Health citations — State benchmarkedThis home is ranked 44th out of 86 homes in Minnesota. Shows this facility's total health deficiency citations benchmarked to the Minnesota State average, with a ranking across all 86 MN SNFs. Lower citation counts earn a better rank.Click the rank badge to see the full State ranking.Click here to see the full State ranking.

Minnesota average 23.2

Citations per inspection
3.25 Rank #31 / 86Citations per inspection — State benchmarkedThis home is ranked 31st out of 86 homes in Minnesota. Shows average deficiency citations per CMS inspection for this facility versus the Minnesota mean across 86 SNFs with citation data. Lower is better.Click the rank badge to see the full State ranking.Click here to see the full State ranking.

Minnesota average 3.76


Health citations are formal notices following inspections when they fail to comply with safety and care standards.

19 of 26 citations resulted from standard inspections; and 7 of 26 resulted from complaint investigations.

Breakdown of citation severity (last 3 years)
Critical Health citations
0
100% better than Minnesota average

Minnesota average: 0.7


Serious Health citations
1 Rank #1 / 38Serious citations (G–I) — State benchmarkedThis home is ranked 1st out of 38 homes in Minnesota. Shows G–I scope serious health citations for this facility versus other Minnesota SNFs. Lower counts rank better.Click the rank badge to see the full State ranking.Click here to see the full State ranking.
100% worse than Minnesota average

Minnesota average: 0.5

0 critical citations Minnesota average: 0.7

1 serious citation Minnesota average: 0.5

25 moderate citations Minnesota average: 21.2

0 minor citations Minnesota average: 0.8
Citations history (last 3 years)
Care Planning serious citation Sep 11, 2025
Corrected

Resident Rights moderate citation Aug 22, 2025
Corrected

Administration moderate citation Jun 05, 2025
Corrected

Infection Control moderate citation Jun 05, 2025
Corrected

Staffing Data

Reporting period: October 1 – December 31, 2025 (Q4 2025). Source: CMS Payroll-Based Journal report.

Total staff 81
Employees 43
Contractors 38
Staff to resident ratio 1.93:1
12% worse than Minnesota average
Minnesota average ratio: 2.19:1 Minnesota average ratio: 2.19:1See full Minnesota ranking
Avg staff/day 18
Average shift 7.9 hours
5% better than Minnesota average
Minnesota average: 7.5 hours Minnesota average shift: 7.5 hoursSee full Minnesota ranking
Total staff hours (quarter) 13,111

Nursing staff breakdown

Q4 2025 · Oct 1 – Dec 31 More info This data comes from the CMS Payroll-Based Journal report covering October 1 – December 31, 2025.
Registered Nurse

Manages medical care and health needs.

RN Staff 5
Average shift length Info Average shift length. Calculated as total hours divided by days worked and average staff per day. 7.5 hours

This role is partially covered by contractors.

Licensed Practical Nurse

Assists with medical care and medications.

LPN Staff 5
Average shift length Info Average shift length. Calculated as total hours divided by days worked and average staff per day. 10.1 hours

This role is partially covered by contractors.

Certified Nursing Assistant

Helps with daily care and mobility.

CNA Staff 41
Average shift length Info Average shift length. Calculated as total hours divided by days worked and average staff per day. 9.6 hours

This role is partially covered by contractors.

Contractor staffing

Q4 2025 · Oct 1 – Dec 31 More info This data comes from the CMS Payroll-Based Journal report covering October 1 – December 31, 2025.

Total hours from contractors

36.4%

4,772 contractor hours this quarter

Certified Nursing Assistant: 19 Physical Therapy Assistant: 3 Speech Language Pathologist: 3 Licensed Practical Nurse: 3 Respiratory Therapy Technician: 3 Qualified Social Worker: 3 Registered Nurse: 2 Occupational Therapy Assistant: 1 Medical Director: 1

Staff by category

Q4 2025 · Oct 1 – Dec 31 More info This data comes from the CMS Payroll-Based Journal report covering October 1 – December 31, 2025.
Certified Nursing Assistant2219416,32092100%9.6
Medication Aide/Technician4041,42592100%7.9
Registered Nurse3251,2579098%7.5
Licensed Practical Nurse2351,0117582%10.1
Nurse Practitioner3034816267%7.8
Dental Services Staff1014405560%8
Physical Therapy Assistant0334096773%6.1
Other Dietary Services Staff3033956571%4.6
RN Director of Nursing1013785155%7.4
Clinical Nurse Specialist3033754246%8
Administrator1013655054%7.3
Speech Language Pathologist0331705863%2.9
Respiratory Therapy Technician033552729%2
Occupational Therapy Assistant011181314%1.3
Qualified Social Worker033878%1.1
Medical Director011633%2
41 Certified Nursing Assistant
% of Days 100%
4 Medication Aide/Technician
% of Days 100%
5 Registered Nurse
% of Days 98%
5 Licensed Practical Nurse
% of Days 82%
3 Nurse Practitioner
% of Days 67%
1 Dental Services Staff
% of Days 60%
3 Physical Therapy Assistant
% of Days 73%
3 Other Dietary Services Staff
% of Days 71%
1 RN Director of Nursing
% of Days 55%
3 Clinical Nurse Specialist
% of Days 46%
1 Administrator
% of Days 54%
3 Speech Language Pathologist
% of Days 63%
3 Respiratory Therapy Technician
% of Days 29%
1 Occupational Therapy Assistant
% of Days 14%
3 Qualified Social Worker
% of Days 8%
1 Medical Director
% of Days 3%

Penalties and fines

Federal penalties imposed by CMS for regulatory violations, including civil money penalties (fines) and denials of payment for new Medicare/Medicaid admissions.

Source: CMS Penalties Database

No penalties in the past 3 years

No civil money penalties or payment denials were reported in the last 3 years.

Quality of care over time

These measures show how residents usually do over time at this home, based on health outcomes and preventive care.

High-risk clinical events score Info A composite score based on pressure ulcers, falls with injury, weight loss, walking ability decline, and activities of daily living decline. 11.4
In line with Minnesota average

Minnesota average: 11.1

Functional decline score Info A composite score based on activities of daily living decline, walking ability decline, and incontinence. 27.5
22% worse than Minnesota average

Minnesota average: 22.6

Long-stay resident measures
Need for Help with Daily Activities Increased Info Percent of long-stay residents whose need for help with daily activities has increased 19.1%
In line with Minnesota average

Minnesota average: 18.9%

Walking Ability Worsened Info Percent of long-stay residents whose ability to move independently worsened 29.1%
22% worse than Minnesota average

Minnesota average: 23.8%

Low Risk Residents with Bowel/Bladder Incontinence Info Percent of low risk long-stay residents who lose control of their bowels or bladder 34.3%
37% worse than Minnesota average

Minnesota average: 25.0%

Falls with Major Injury Info Percent of long-stay residents experiencing one or more falls with major injury 1.6%
57% better than Minnesota average

Minnesota average: 3.7%

High Risk Residents with Pressure Ulcers Info Percent of long-stay high risk residents with pressure ulcers 4.9%
10% better than Minnesota average

Minnesota average: 5.4%

Urinary Tract Infection Info Percent of long-stay residents with a urinary tract infection 0.0%
100% better than Minnesota average

Minnesota average: 2.7%

Lost Too Much Weight Info Percent of long-stay residents who lose too much weight 2.1%
50% better than Minnesota average

Minnesota average: 4.1%

Depressive Symptoms Info Percent of long-stay residents who have depressive symptoms 5.2%
20% worse than Minnesota average

Minnesota average: 4.4%

Antipsychotic Use Info Percent of long-stay residents who received an antipsychotic medication 31.5%
83% worse than Minnesota average

Minnesota average: 17.2%

Pneumococcal Vaccine Info Percent of long-stay residents assessed and appropriately given the pneumococcal vaccine 99.2%
In line with Minnesota average

Minnesota average: 97.3%

Influenza Vaccine Info Percent of long-stay residents assessed and appropriately given the seasonal influenza vaccine 100.0%
In line with Minnesota average

Minnesota average: 96.0%

Short-stay resident measures
Pneumococcal Vaccine Info Percent of short-stay residents assessed and appropriately given the pneumococcal vaccine 90.9%
In line with Minnesota average

Minnesota average: 88.9%

Antipsychotic medication increase Info Percent of short-stay residents who newly received an antipsychotic medication 1.1%
43% better than Minnesota average

Minnesota average: 1.9%

Influenza Vaccine Info Percent of short-stay residents assessed and appropriately given the seasonal influenza vaccine 83.0%
In line with Minnesota average

Minnesota average: 82.6%

Breakdown by payment type

Medicare

47% of new residents, usually for short-term rehab.

Typical stay 23 days

Private pay

46% of new residents, often for short stays.

Typical stay 7 - 8 months

Medicaid

7% of new residents, often for long-term daily care.

Typical stay 2 - 3 years

Facility Characteristics

Source: CMS Long-Term Care Facility Characteristics (Data as of Jan 2026)

Total residents 42
Medicare
10
23.8% of residents
Medicaid
23
54.8% of residents
Private pay or other
9
21.4% of residents
Programs & Services
Residents Group

Residents meet regularly to discuss policies, care quality, and activities

Family Member Group

Family members meet regularly to discuss policies, care quality, and activities

Active Family Council

Organized group of family members that meets regularly to discuss facility policies, resident care, and activities.

Active Resident Council

Organized group of residents that meets regularly to discuss facility policies, quality of life, and activities.

Finances and operations

Privately-owned community
Home revenue
$4.4M
Operating loss
-$563.2K
Privately-owned community
Home revenue
$4.4M Rank #78 / 85Revenue — State benchmarkedThis home is ranked 78th out of 85 homes in Minnesota. Shows this facility's annual revenue compared to the Minnesota SNF average. Higher revenue generally means more resources for staffing and capital — read alongside Payroll %.Click the rank badge to see the full State ranking.Click here to see the full State ranking.
Operating loss
-$563.2K
Payroll costs Info The portion of the home's budget spent on staff, including nurses, caregivers, and other employees who support care and operations. Rank #82 / 85Payroll — State benchmarkedThis home is ranked 82nd out of 85 homes in Minnesota. Shows total annual staff payroll benchmarked to the Minnesota average. Higher payroll investment relative to peers often signals better staffing and less reliance on cheaper contract labor.Click the rank badge to see the full State ranking.Click here to see the full State ranking.
$2.7M
60.9% of revenue Rank #32 / 85Payroll % — State benchmarkedThis home is ranked 32nd out of 85 homes in Minnesota. Shows payroll as a percentage of revenue versus the Minnesota average. Well-run Minnesota SNFs typically land around 61–68% — the top third Statewide. Below 25% may signal understaffing or heavy agency use — read with Staffing ratings.Click the rank badge to see the full State ranking.Click here to see the full State ranking.
Other operating costs Info All remaining costs needed to run the home, such as food, utilities, building maintenance, supplies and administrative expenses.
$2.3M
Total costs $5.0M

Who this home usually serves

TYPE OF STAY

Mostly short-term rehab stays

Most residents typically stay for a few weeks or months before returning home or moving on.

Places of interest near The Waterview Shores Assisted

Address 0.0 miles from city center Info Estimated distance in miles from Two Harbors's city center to The Waterview Shores Assisted's address, calculated via Google Maps.

Calculate Travel Distance to The Waterview Shores Assisted

Add your location

Address

Financial Assistance for
Nursing Home in Minnesota

The Waterview Shores Assisted is located in Two Harbors, Minnesota.
Here are the financial assistance programs available to residents in Minnesota.

Get Financial aid guidance

Elderly Waiver

Minnesota Medicaid EW

Age 65+
General Minnesota resident, Medicaid-eligible, nursing home-level care need.
Income Limits (2025) ~$2,829/month 300% FBR, individual
Asset Limits $3,000 individual, higher than most states
MN

Higher asset limit; rural access focus.

Benefits
Personal care (5-7 hours/day) Respite (240 hours/year) Adult day care (~$70/day) Home aides

Essential Community Supports (ECS)

Minnesota ECS

Age 65+
General Minnesota resident, at risk of decline but not nursing home level.
Income Limits ~$1,732/month individual, varies
Asset Limits $3,000 individual
MN

Bridges gap for those ineligible for waivers.

Benefits
In-home support (2-4 hours/week) Respite (up to 5 days/year) Transportation (~5 trips/month)

Alternative Care (AC) Program

Minnesota Alternative Care Program

Age 65+
General Minnesota resident, NFLOC, not MA-eligible.
Income Limits (2025) ~$1,255-$2,829/month (100%-300% FPL); sliding scale copays.
Asset Limits $3,000 (individual); home equity limit $713,000.
MN

CDCS option; statewide via counties.

Benefits
Personal care (4-6 hours/day) Respite (~5 days/year) Home health Meals Home mods

Minnesota Senior Health Options (MSHO)

Minnesota Senior Health Options

Age 65+
General Minnesota resident, eligible for MA and Medicare Parts A/B.
Income Limits (2025) ~$1,255/month (100% FPL for MA); spenddown allowed.
Asset Limits $3,000 (individual), $6,000 (couple).
MN

7 health plans (e.g., UCare, HealthPartners); care coordinator assigned.

Benefits
Personal care (5-7 hours/day) Medical care Respite Adult day care Home mods $900/year groceries (some plans)

Minnesota Senior Care Plus (MSC+)

Minnesota Senior Care Plus

Age 65+
General Minnesota resident, MA-eligible, not on Medicare.
Income Limits (2025) ~$1,255/month (100% FPL); spenddown allowed.
Asset Limits $3,000 (individual), $6,000 (couple).
MN

Includes EW services; 7 health plans available.

Benefits
Personal care (5-7 hours/day) Respite Adult day care Home mods Limited nursing home care

Consumer Support Grant (CSG)

Minnesota Consumer Support Grant

Age 65+ or disabled
General Minnesota resident, eligible for MA personal care but opts for grant.
Income Limits (2025) ~$1,255/month (MA-eligible); spenddown allowed.
Asset Limits $3,000 individual
MN

Can hire family; statewide via counties.

Benefits
Cash (~$500-$1,500/month) for personal care Respite Home mods Assistive tech

Medicare Savings Program (MSP)

Minnesota Medicare Savings Program

Age 65+ or disabled
General Minnesota resident, Medicare Part A/B.
Income Limits (2025) ~$2,510/month (QMB), ~$3,380/month (SLMB), ~$3,598/month (QI)—individual.
Asset Limits $9,430 (individual), $14,130 (couple).
MN

Three tiers; no waitlist; includes Extra Help for Part D.

Benefits
Covers Part B premiums ($174.70/month) Deductibles ($240/year) Copays (~20%)

VA Aid and Attendance (A&A) and Housebound Benefits

Minnesota VA Aid and Attendance/Housebound

Age 65+ or disabled veteran/spouse
General Minnesota resident, wartime service, need for ADL help (A&A) or homebound.
Income Limits (2025) Net income < ~$1,984/month (veteran with dependent, A&A); pension offsets income.
Asset Limits ~$155,356 net worth limit
MN

High veteran demand in rural/urban areas.

Benefits
Cash (~$1,433-$2,642/month veteran, ~$951-$1,318 spouse) for care costs (e.g., in-home, assisted living)

Frequently Asked Questions about The Waterview Shores Assisted

Is The Waterview Shores Assisted in a walkable area?

The Waterview Shores Assisted has a walk score of 61. Moderately walkable. Some errands can be accomplished on foot, with a mix of nearby amenities.

How many beds does The Waterview Shores Assisted have?

The Waterview Shores Assisted has 46 beds.

Are there photos of The Waterview Shores Assisted?

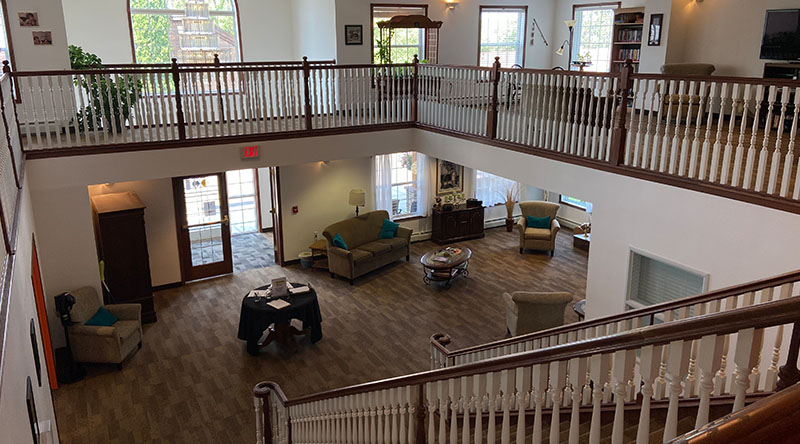
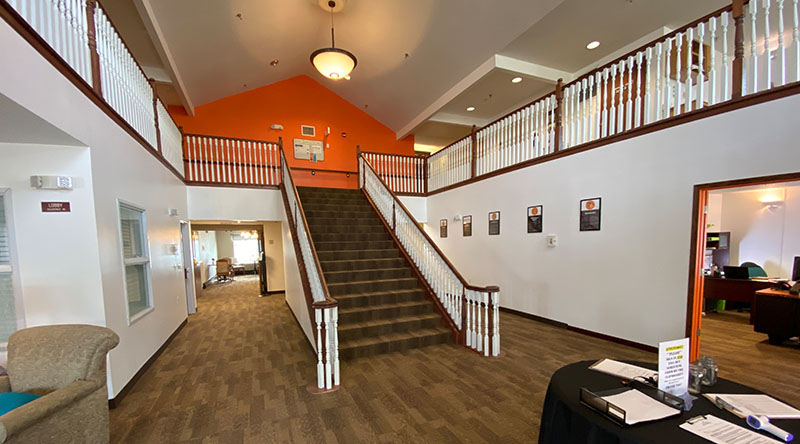
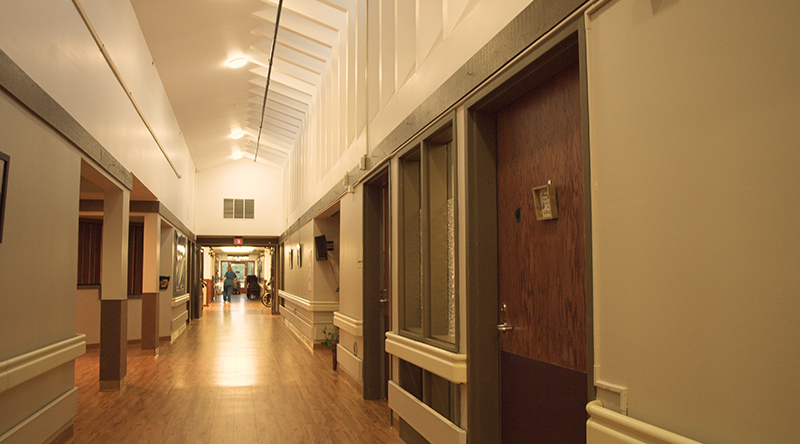
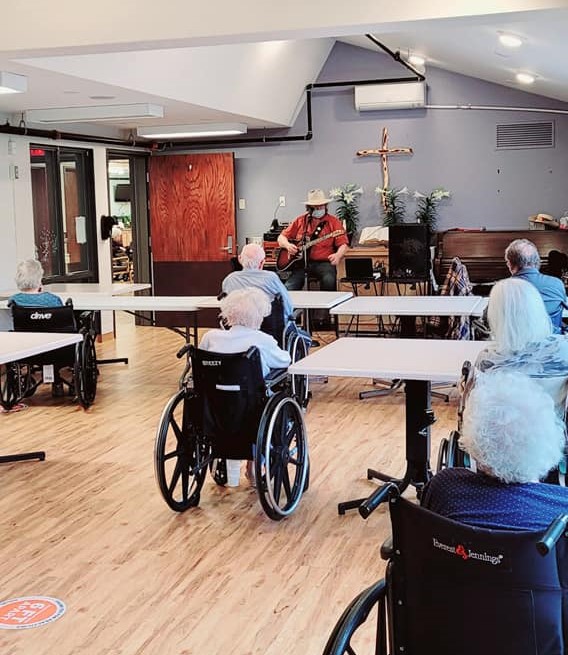
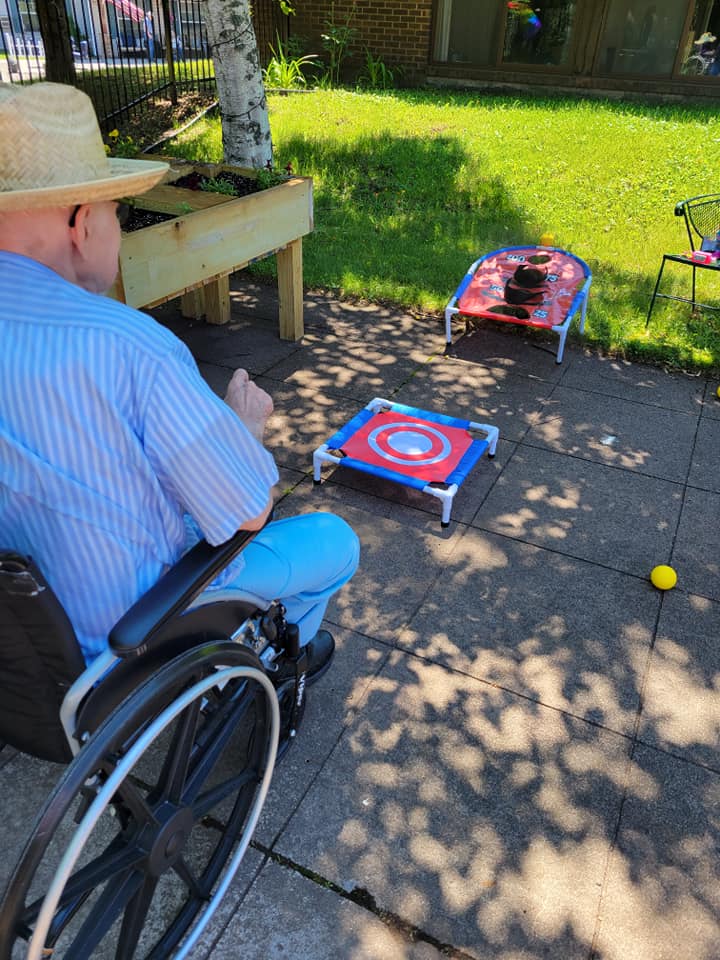
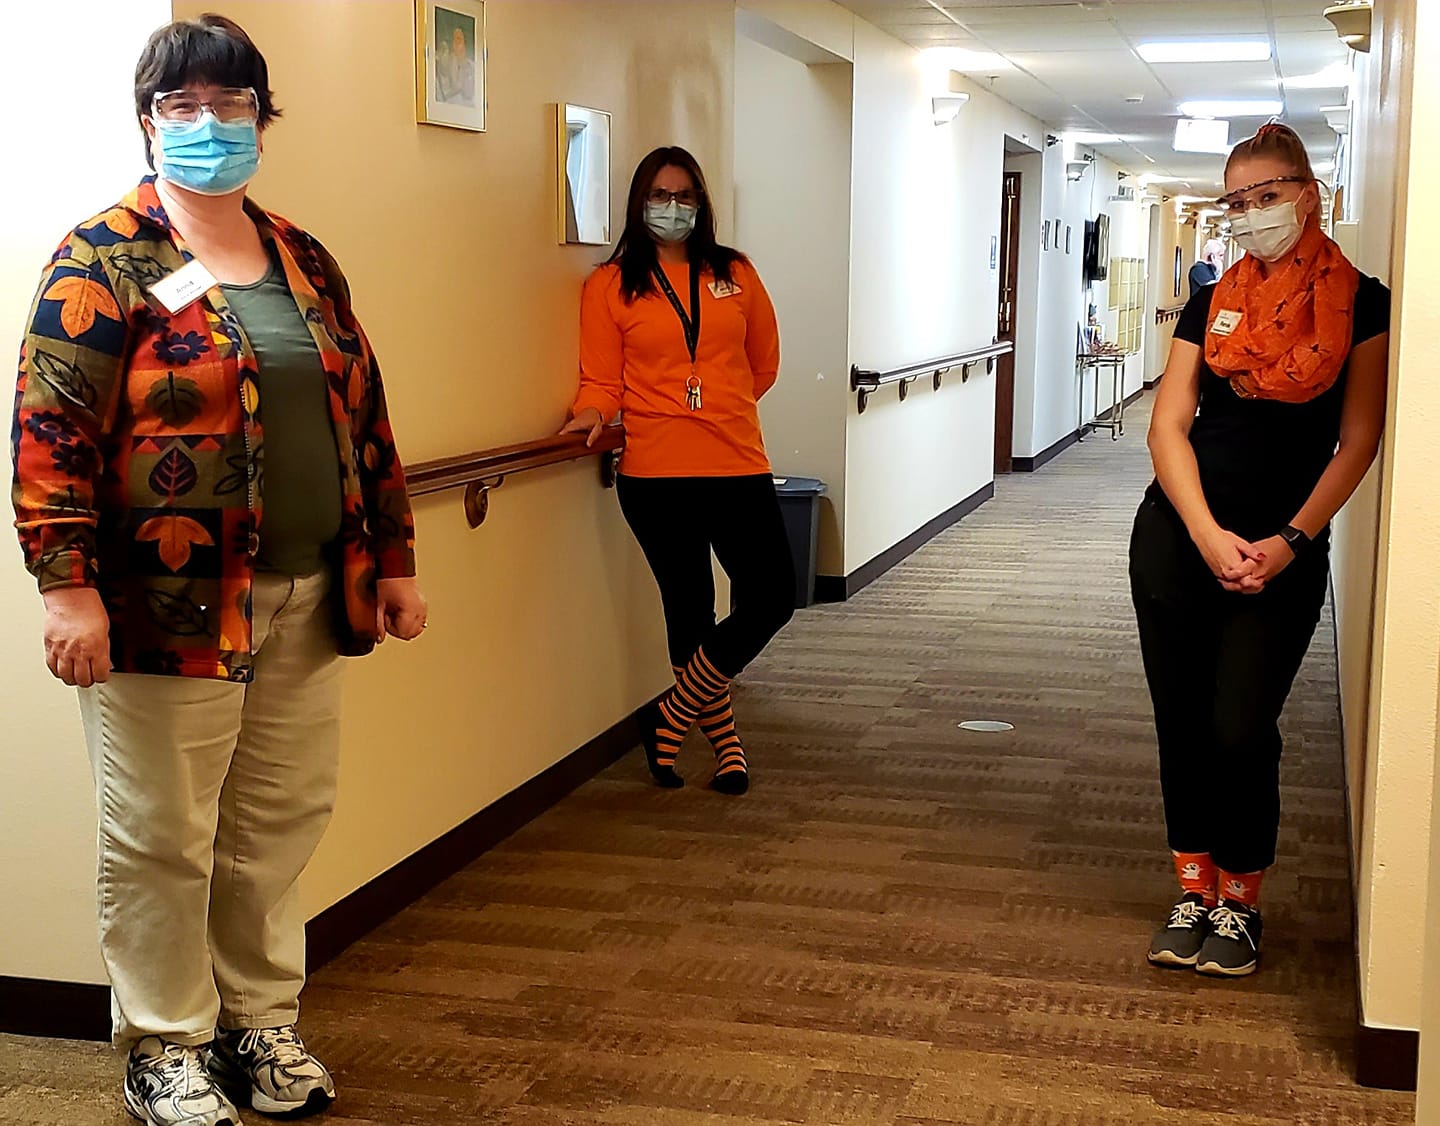
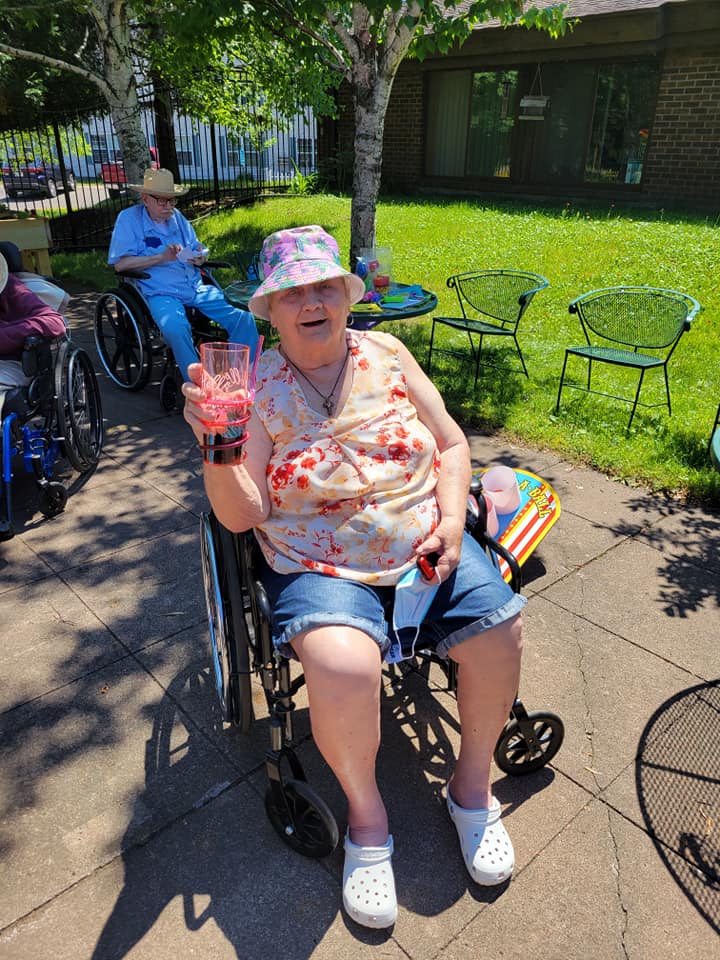
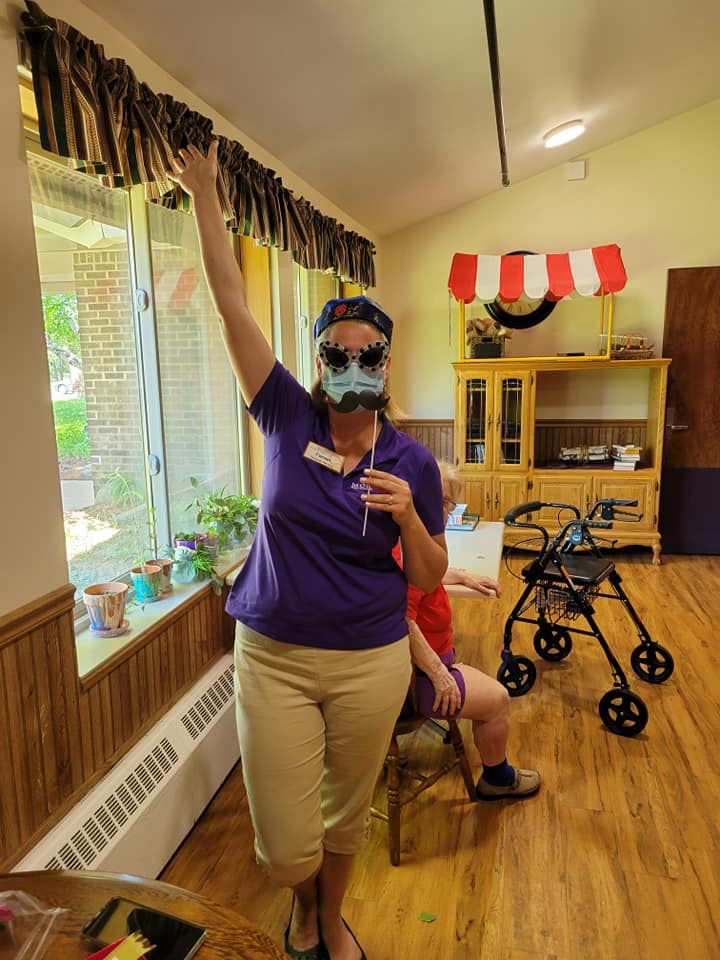
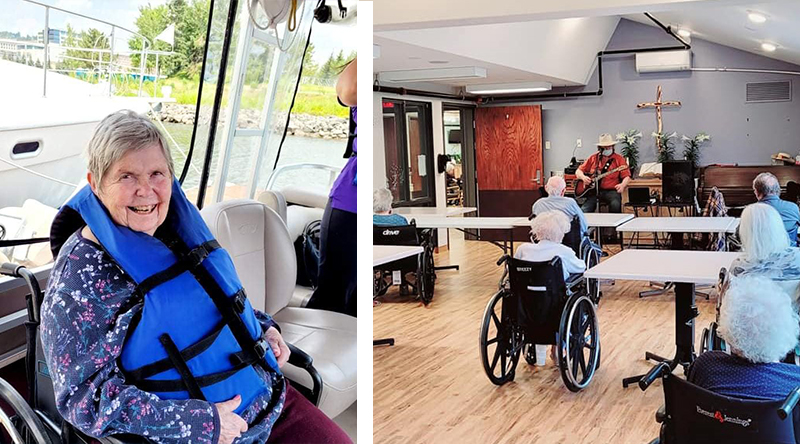
Yes — there are 21 photos of The Waterview Shores Assisted in the photo gallery on this page.

What is the address of The Waterview Shores Assisted?

The Waterview Shores Assisted is located at 409 13th Avenue.

What is the phone number of The Waterview Shores Assisted?

(218) 834-8374 will put you in contact with the team at The Waterview Shores Assisted.

What county is The Waterview Shores Assisted located in?

The Waterview Shores Assisted is in Lake County.

Is The Waterview Shores Assisted Medicare or Medicaid certified?

Yes — The Waterview Shores Assisted is a CMS-certified provider of Medicare and Medicaid.

Guides for Better Senior Living

Care Cost Calculator: See Prices in Your Area

Nursing Home Data Explorer

Don’t Wait Too Long: 7 Red Flag Signs Your Parent Needs Assisted Living Now

The True Cost of Assisted Living in 2025 – And How Families Are Paying For It

Understanding Senior Living Costs: Pricing Models, Discounts & Financial Assistance

Explore Open Rooms
1 Contact details
2 What type of senior care service are you looking for?
3 What budget do you have in mind for senior care?
4 How soon do you need to find care?
5 Additional details

Thank you for your interest!

Our team will be in touch shortly to help with next steps.