

Total health inspections
5
Connecticut average 5.7
Last Health inspection on Nov 2025

We arrange tours, appointments, and even moving support so you don’t have to


Tucked in the heart of Woodbridge, Connecticut, The Willows is an esteemed skilled nursing facility offering a comprehensive array of services, including top-notch nursing home care. With a focus on short-term rehabilitation and long-term care, The Willows serves as a trusted haven for individuals seeking post-hospital and restorative care. They proudly accept Medicare, Medicaid, and most private insurances, ensuring that nursing home prices remain accessible and transparent for their diverse community of residents. The devoted staff at The Willows is dedicated to serving the unique needs of individuals recovering from illness or injury.
The Willows holds a deep appreciation for veterans and honors their service with utmost respect and gratitude. To further alleviate financial concerns, they work closely with nursing home insurance providers, ensuring that residents have the peace of mind that comes with comprehensive coverage. The facility goes above and beyond to cater to the diverse needs of its residents, offering a wide range of services, from interpreter assistance and re-creation activities to coordinated transportation and discharge planning. The Willows takes pride in providing holistic care, with a focus on dietary and nutrition management, ensuring residents’ overall well-being is always prioritized.
 Official CMS rating based on health inspections, staffing and quality measures.
Official CMS rating based on deficiencies found during state health inspections.
Official CMS rating based on nurse staffing hours per resident per day.
Official CMS rating based on clinical outcomes for residents.
Average daily nursing hours per resident (adjusted for acuity). Higher values indicate more nursing time per resident.
Hours of care per resident per day, broken down by staff type. Data from CMS Medicare.
Registered nurse hours per resident per day.
Nurse aide hours per resident per day.
Total number of nurse staff hours per resident per day on weekends.
Physical therapist staff hours per resident per day.
Registered nurse hours per resident per day on weekends.
Official CMS rating based on health inspections, staffing and quality measures.
Official CMS rating based on deficiencies found during state health inspections.
Official CMS rating based on nurse staffing hours per resident per day.
Official CMS rating based on clinical outcomes for residents.
Average daily nursing hours per resident (adjusted for acuity). Higher values indicate more nursing time per resident.
Hours of care per resident per day, broken down by staff type. Data from CMS Medicare.
Registered nurse hours per resident per day.
Nurse aide hours per resident per day.
Total number of nurse staff hours per resident per day on weekends.
Physical therapist staff hours per resident per day.
Registered nurse hours per resident per day on weekends.
May offer a more intimate, personalized care environment.
That suggests steady demand, but availability may be limited.
Most residents stay long-term, while a smaller portion are admitted for short-term rehab.
1% of new residents, usually for short-term rehab.
60% of new residents, often for short stays.
39% of new residents, often for long-term daily care.
The portion of the home's budget spent on staff, including nurses, caregivers, and other employees who support care and operations.
All remaining costs needed to run the home, such as food, utilities, building maintenance, supplies and administrative expenses.
Connecticut average 5.7
Last Health inspection on Nov 2025
Health citations are formal notices following inspections when they fail to comply with safety and care standards.
21 of 25 citations resulted from standard inspections; and 4 of 25 resulted from complaint investigations.
Connecticut average: 0.3
Connecticut average: 0.7
Data sourced from CMS Health Deficiencies reports. Citation severity codes range from A (least serious) to L (most serious). Immediate Jeopardy (J-L) citations indicate situations where the facility's noncompliance has placed residents at risk of death or serious harm.
Nursing Home 24/7 care needed
Assisted Living For seniors needing help with daily tasks but not full-time nursing.
Nursing Home 24/7 care needed
Assisted Living For seniors needing help with daily tasks but not full-time nursing.
Nursing Home 24/7 care needed
Assisted Living For seniors needing help with daily tasks but not full-time nursing.
Nursing Home 24/7 care needed
Assisted Living For seniors needing help with daily tasks but not full-time nursing.
Nursing Home 24/7 care needed
Assisted Living For seniors needing help with daily tasks but not full-time nursing.
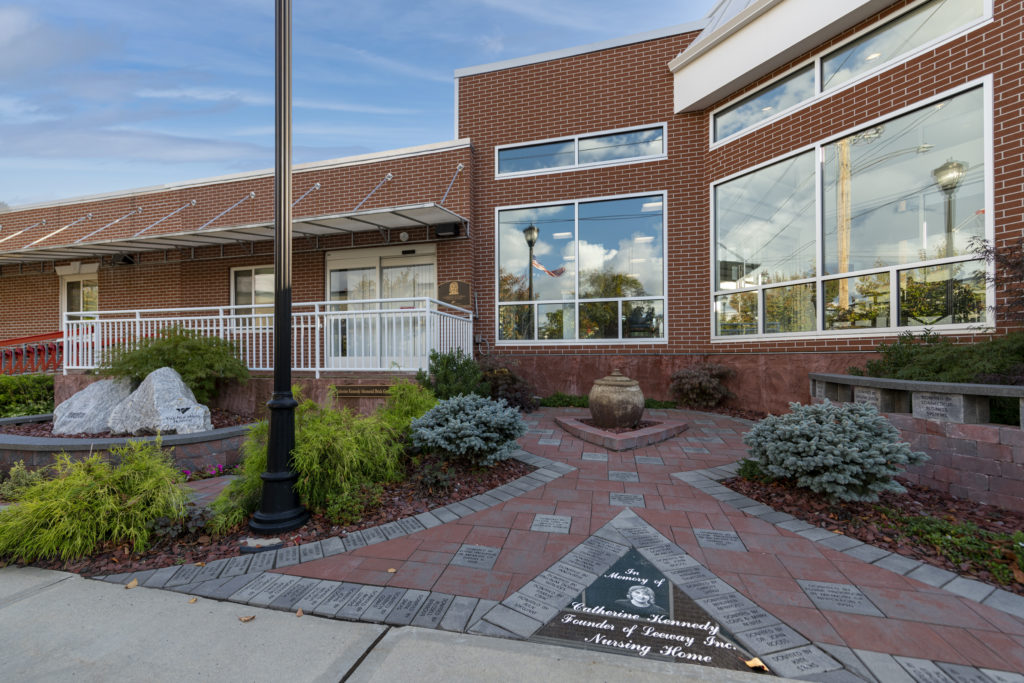 Leeway
 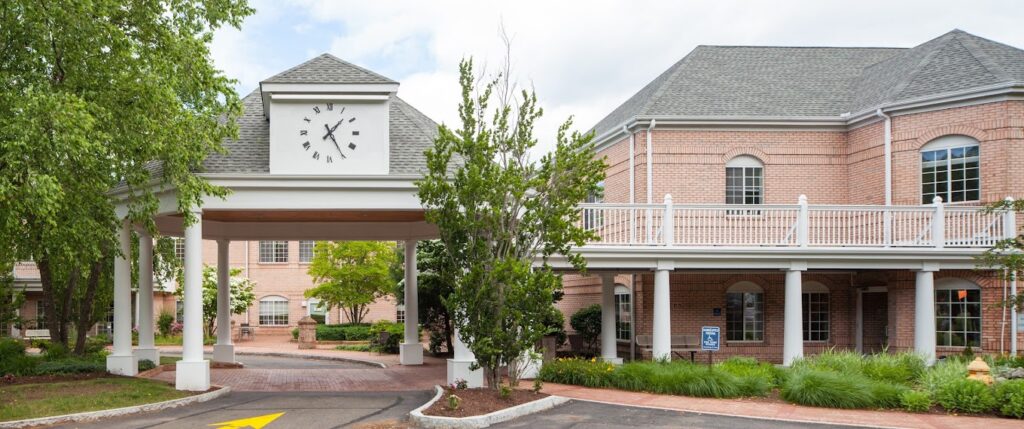 The Willows
 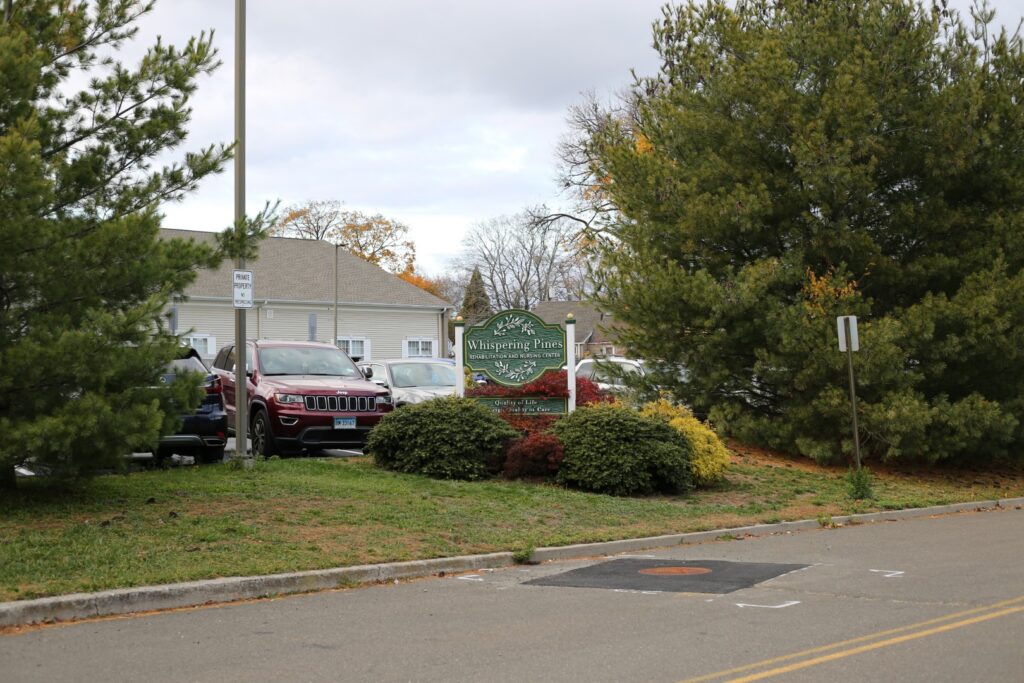 Whispering Pines Rehabilitation and Nursing Center
 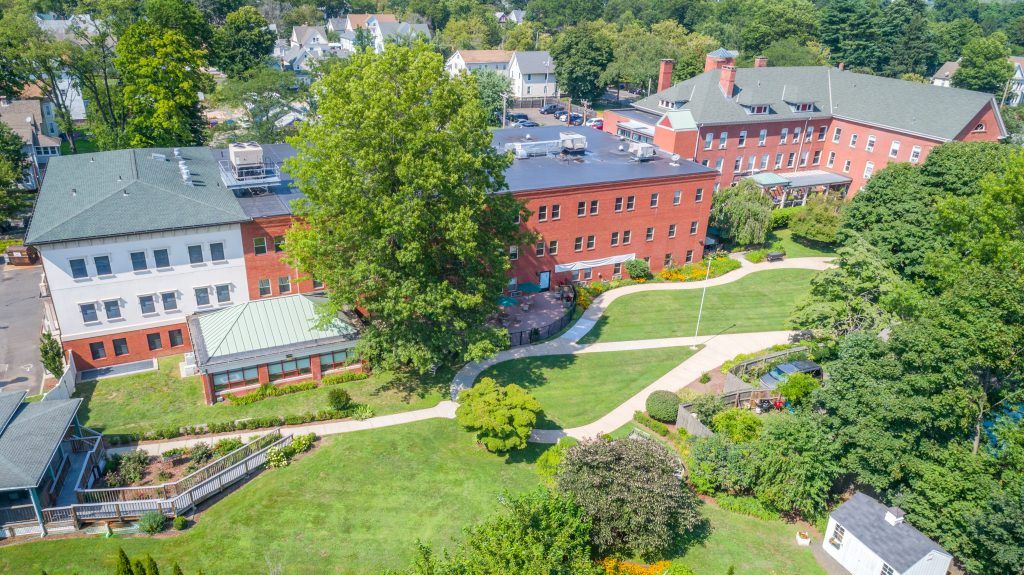 Mary Wade Home
 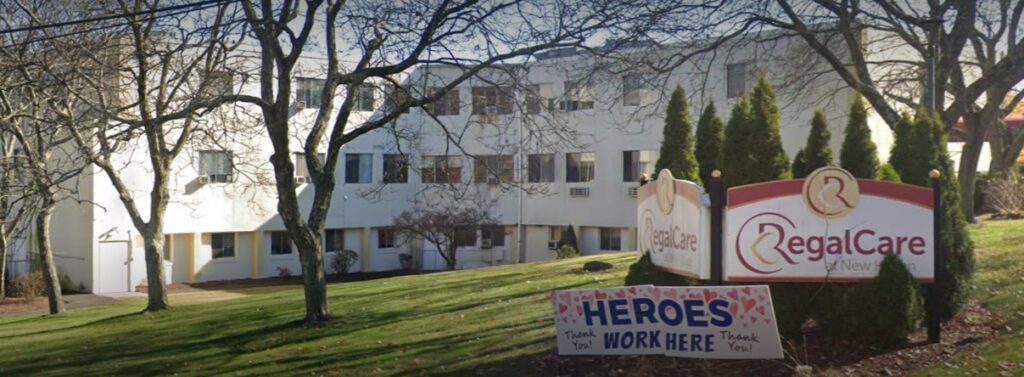 New Haven Center for Nursing & Rehabilitation
![]() 1.5 miles from city center — 3.56 miles to nearest hospital (Yale New Haven Children's Hospital)
1.5 miles from city center — 3.56 miles to nearest hospital (Yale New Haven Children's Hospital)
![]() 225 Amity Rd, Woodbridge, CT 06525
225 Amity Rd, Woodbridge, CT 06525
Add your location
Source: CMS Payroll-Based Journal (Q2 2025)
| Role ⓘ | Count ⓘ | Avg Shift (hrs) ⓘ | Uses Contractors? ⓘ |
|---|---|---|---|
| Registered Nurse | 5 | 8.8 | Yes |
| Licensed Practical Nurse | 38 | 8.3 | Yes |
| Certified Nursing Assistant | 70 | 7.7 | Yes |
| Role ⓘ | Employees ⓘ | Contractors ⓘ | Total Staff ⓘ | Total Hours ⓘ | Days Worked ⓘ | % of Days ⓘ | Avg Shift (hrs) ⓘ |
|---|---|---|---|---|---|---|---|
| Certified Nursing Assistant | 42 | 28 | 70 | 15,264 | 91 | 100% | 7.7 |
| Licensed Practical Nurse | 21 | 17 | 38 | 7,075 | 91 | 100% | 8.3 |
| Clinical Nurse Specialist | 13 | 0 | 13 | 3,554 | 91 | 100% | 7.4 |
| Speech Language Pathologist | 0 | 3 | 3 | 1,128 | 77 | 85% | 7.9 |
| Physical Therapy Aide | 0 | 2 | 2 | 1,114 | 75 | 82% | 7.9 |
| Registered Nurse | 4 | 1 | 5 | 1,070 | 83 | 91% | 8.8 |
| Physical Therapy Assistant | 0 | 3 | 3 | 1,060 | 72 | 79% | 7.9 |
| Mental Health Service Worker | 4 | 0 | 4 | 975 | 70 | 77% | 7.5 |
| Respiratory Therapy Technician | 0 | 2 | 2 | 495 | 63 | 69% | 7.9 |
| Administrator | 1 | 0 | 1 | 458 | 59 | 65% | 7.8 |
| Nurse Practitioner | 1 | 0 | 1 | 406 | 49 | 54% | 8.3 |
| Qualified Social Worker | 0 | 3 | 3 | 72 | 11 | 12% | 6 |
Source: CMS Long-Term Care Facility Characteristics (Data as of Jan 2026)
Residents meet regularly to discuss policies, care quality, and activities
Organized group of residents that meets regularly to discuss facility policies, quality of life, and activities.
Data sourced from CMS Long-Term Care Facility Characteristics quarterly report. Payer mix reflects the current resident census by primary payment source.
These measures show how residents usually do over time at this home, based on health outcomes and preventive care.
Connecticut average: 10.4
Connecticut average: 21.1
Connecticut average: 18.9%
Connecticut average: 19.2%
Connecticut average: 24.9%
Connecticut average: 3.5%
Connecticut average: 4.6%
Connecticut average: 1.7%
Connecticut average: 6.3%
Connecticut average: 15.2%
Connecticut average: 17.2%
Connecticut average: 87.5%
Connecticut average: 93.5%
Connecticut average: 2.10
Connecticut average: 1.53
Connecticut average: 70.1%
Connecticut average: 1.5%
Connecticut average: 69.8%
Connecticut average: 25.0%
Connecticut average: 11.1%
Connecticut average: 0.8%
Connecticut average: 53.7%
Connecticut average: 50.6%
Quality measures are calculated from Minimum Data Set (MDS) assessments. For most measures, lower percentages indicate better care quality.
Historical financial and operational data for The Willows based on CMS SNF Cost Reports.
Loading trend charts...
Care Cost Calculator: See Prices in Your Area
Nursing Home Data Explorer
Don’t Wait Too Long: 7 Red Flag Signs Your Parent Needs Assisted Living Now
The True Cost of Assisted Living in 2025 – And How Families Are Paying For It
Understanding Senior Living Costs: Pricing Models, Discounts & Financial Assistance

Touring a community? Use this expert-backed checklist to stay organized, ask the right questions, and find the perfect fit.
We'll send you a PDF version of the touring checklist.


