The Willows at Springhurst
Nursing Home, Assisted Living, Independent Living, Memory Care & Respite Care · Louisville, KY
CMS overall rating Info CMS (the Centers for Medicare & Medicaid Services) is the federal agency that rates nursing home quality. Its Overall Rating runs from 1 to 5 stars, combining health inspections, staffing, and quality measures, with inspections weighted most heavily.

The Willows at Springhurst

Nursing Home, Assisted Living, Independent Living, Memory Care & Respite Care · Louisville, KY
CMS overall rating Info CMS (the Centers for Medicare & Medicaid Services) is the federal agency that rates nursing home quality. Its Overall Rating runs from 1 to 5 stars, combining health inspections, staffing, and quality measures, with inspections weighted most heavily.
Calculator: See prices in your area
The Willows at Springhurst accepts Medicare, Medicaid, and private pay.

Overview of The Willows at Springhurst

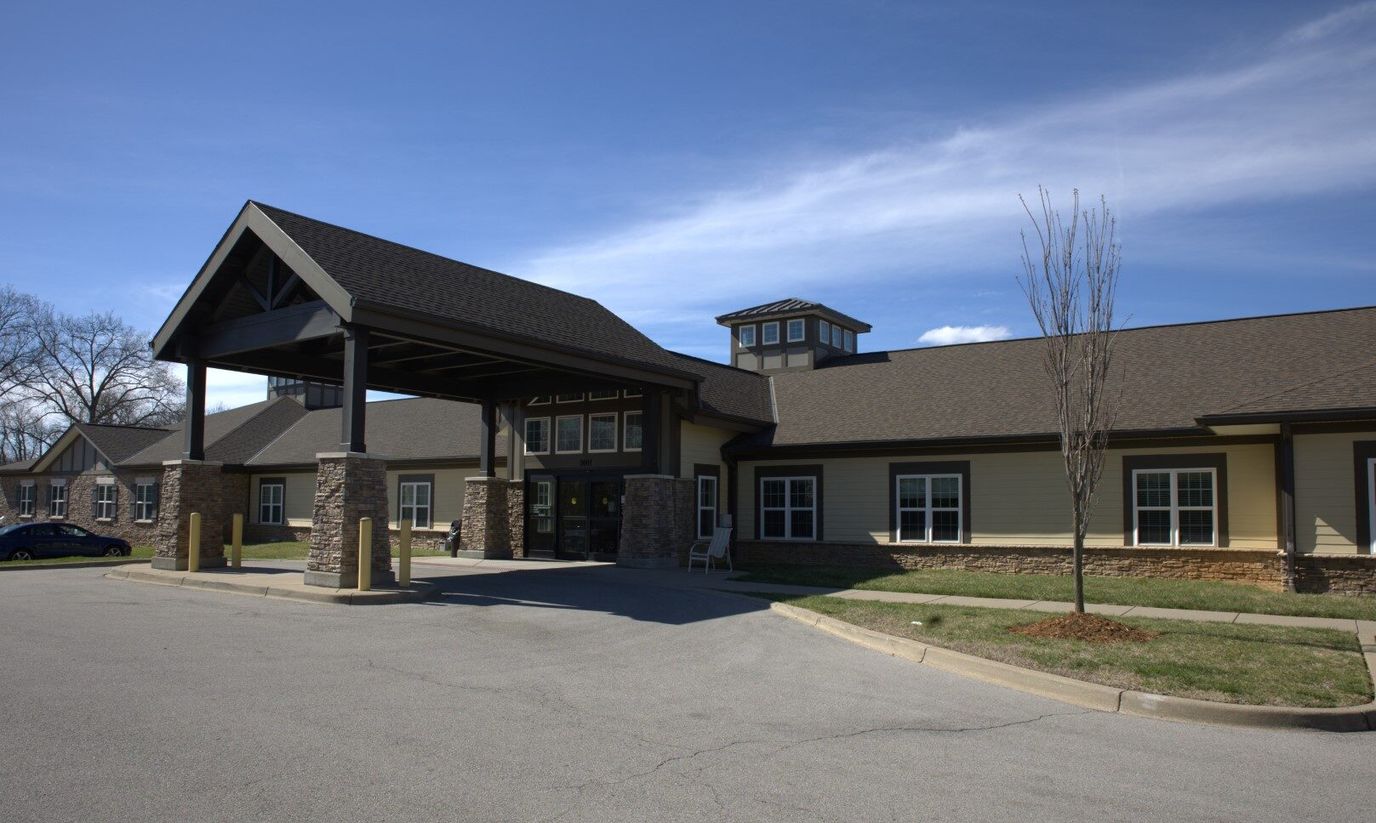
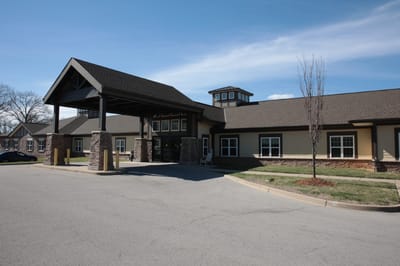
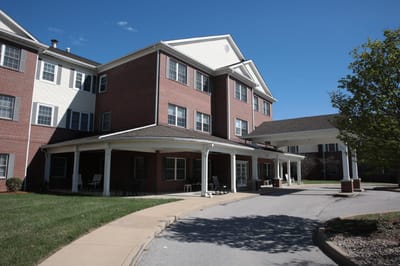
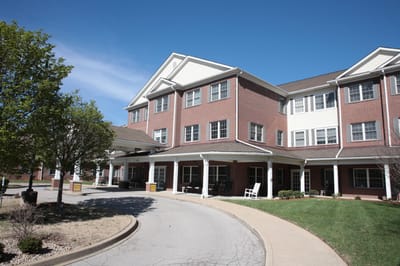
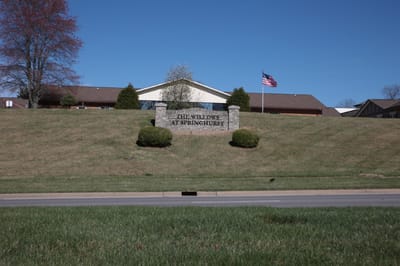
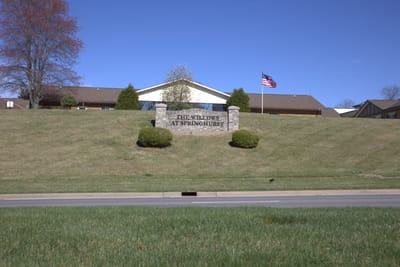
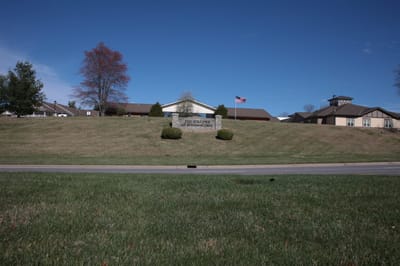
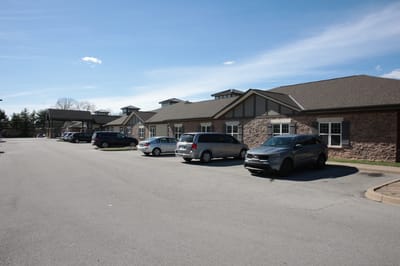
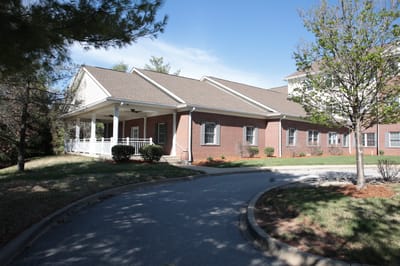
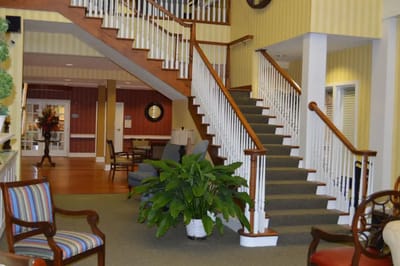
A member of the Trilogy Health Services group, The Willows at Springhurst is a trusted community where families and seniors know they made the right choice to live in the senior living community. As a sister company of Westport Place, The Willows ensures that residents have a wonderful experience in the community. Management emphasizes the importance of connections, which is why they promote socialization for everyone in the community. The Willows at Springhurst is a vibrant community that is excellent at satisfying the wellness needs of every resident. 

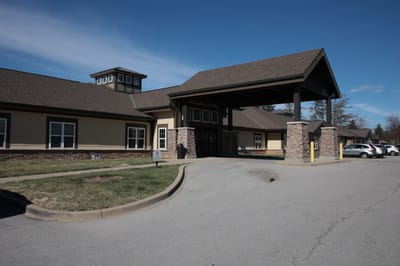
The Willows is an independent living, assisted living, and memory care community with skilled nursing and short-term stay. They ensure that, as a senior living community, they deeply emphasize and guarantee that independence is maintained for their residents. Residents can rest easy knowing that they are placed first with the list of services and amenities provided for them: ADLs, transportation, library, and private dining rooms. Skilled nursing and personalized care are also offered to the residents. 

Quality ratings

Measured by Centers for Medicare & Medicaid Services (CMS)

Overall rating Info The Overall CMS Rating combines results from health inspections, staffing levels and quality measures. Health inspections carry the most weight. Staffing and quality scores can increase or decrease the final rating based on performance compared to state and national standards.
▲ 6.5% Above KY avg. ▲ 6.5% Above KY avg.KY average: 2.8Click the badge to see the full State ranking.Click here to see the full State ranking.
Health Inspection Info Based on the results of the facility's three most recent standard inspections and any complaint investigations. CMS reviews the number, scope, and severity of deficiencies, with more recent findings weighted more heavily.
▼ 31.4% Below KY avg. ▼ 31.4% Below KY avg.KY average: 2.9Click the badge to see the full State ranking.Click here to see the full State ranking.
Staffing Info Measures average nursing staff hours per resident per day, including Registered Nurses (RNs) and total nursing staff. Ratings are adjusted based on the level of care residents require and are compared to state and national benchmarks.
▲ 49.9% Above KY avg. ▲ 49.9% Above KY avg.KY average: 2.7Click the badge to see the full State ranking.Click here to see the full State ranking.
Quality Measures Info Based on clinical and physical health indicators reported to CMS, such as hospital readmissions, falls, pressure ulcers, and improvements in mobility. These measures reflect how well residents' health needs are being managed.
▲ 72.7% Above KY avg. ▲ 72.7% Above KY avg.KY average: 2.9Click the badge to see the full State ranking.Click here to see the full State ranking.

Staffing hours breakdown

Info Daily nursing hours per resident by staff type, reported to CMS. Higher is generally better — compare this facility to state and national averages to see where staffing stands.

Hours per resident per day — compared to Kentucky state averages

Total nursing care / resident Info This home is ranked 94th out of 193 homes in Kentucky for nurse hours. Total adjusted nursing hours per resident per day, combining RN, LPN, and aide time. CMS adjusts this for case-mix so facilities can be fairly compared.
3h 19m per day
Rank #94 / 193Nurse hours — State benchmarkedThis home is ranked 94th out of 193 homes in Kentucky. Shows adjusted nurse hours per resident per day benchmarked to the Kentucky average, with a ranking across 193 Kentucky facilities. More hours mean more direct care. The national average is about 3.5 hrs; below 3.0 is a red flag.Rankings are based only on facilities in Kentucky that report data for that category. Facilities without available data are excluded from the ranking.Click the rank badge to see the full State ranking.Click here to see the full State ranking.
This facility Kentucky avg (3h 45m per day)
vs Kentucky avg
-12%

2 of 6 metrics below state avg

Standout metric Weekend RN is +81% above state avg
Staff typeHours / Day / Residentvs state avg
Registered Nurse (RN) Info RNs hold the highest nursing license and can assess residents, interpret test results, and direct care plans. More RN hours per day often signals stronger clinical oversight and faster response to health changes. 1h 17m per day ▲ 67% State avg: 46m per day · National avg: 41m per day
LPN / LVN Info Licensed Practical Nurses (LPNs) or Licensed Vocational Nurses (LVNs) deliver routine hands-on care — medication administration, wound dressing, and monitoring vital signs. They work under RN supervision and make up a large share of daily bedside care. 46m per day ▼ 6% State avg: 49m per day · National avg: 52m per day
Nurse Aide Info Certified Nurse Aides (CNAs) provide the most direct day-to-day assistance: bathing, dressing, feeding, and mobility. Nurse aide hours are typically the largest staffing category and directly affect residents' quality of life. 2h 21m per day ▼ 3% State avg: 2h 26m per day · National avg: 2h 20m per day
Weekend Total Nursing Info Combined nursing hours (RN + LPN + Nurse Aide) per resident per day on weekends. Staffing often drops on weekends — this figure reveals whether the facility maintains adequate coverage outside of weekday hours. 3h 51m per day ▲ 10% State avg: 3h 30m per day · National avg: 3h 26m per day
Physical Therapist Info Hours per resident per day provided by licensed Physical Therapists (PTs) or PT Assistants. PT services help residents recover mobility after injury or illness and are especially important for post-acute (short-stay) rehabilitation. 5m per day ▲ 32% State avg: 4m per day · National avg: 4m per day
Weekend RN Info Registered nurse hours specifically on weekends. Facilities sometimes reduce RN presence on Saturdays and Sundays — a low weekend RN figure compared to weekday hours can indicate reduced clinical oversight when most administrative staff are absent. 56m per day ▲ 81% State avg: 31m per day · National avg: 28m per day

Capacity and availability

Avg. Length of Stay
51 days
Bed community size
62-bed community Rank #218 / 341Bed count — State benchmarkedThis home is ranked 218th out of 341 homes in Kentucky. Shows this facility's certified or reported bed count compared to other Kentucky facilities. Larger communities may offer more amenities, programs, and on-site services for residents and families.Rankings are based only on facilities in Kentucky that report data for that category. Facilities without available data are excluded from the ranking.Click the rank badge to see the full State ranking.Click here to see the full State ranking.
A moderately sized community that may balance personal attention with shared amenities and social activities.
Years in operation
4 years in operation Rank #52 / 149Years in operation — State benchmarkedThis home is ranked 52nd out of 149 homes in Kentucky. Shows how long this facility has been in operation compared to other Kentucky facilities. Longer operating histories may benefit residents, families, and staff.Rankings are based only on facilities in Kentucky that report data for that category. Facilities without available data are excluded from the ranking.Click the rank badge to see the full State ranking.Click here to see the full State ranking.
An established community with some operational experience and growing routines.
Walk Score
Walk Score: 34 / 100 Rank #261 / 423Walk Score — State benchmarkedThis home is ranked 261st out of 423 homes in Kentucky. Shows how walkable this facility's neighborhood is compared to the average Walk Score across Kentucky facilities. Higher scores benefit residents, families, and staff.Rankings are based only on facilities in Kentucky that report data for that category. Facilities without available data are excluded from the ranking.Click the rank badge to see the full State ranking.Click here to see the full State ranking.
Somewhat walkable. A few nearby services may be reachable on foot, but most trips require transportation.
BBB Rating
BBB Rating: A+ (Not Accredited)
An independent rating from the Better Business Bureau based on factors such as complaint history, transparency, and business practices.
How BBB ratings work

About this community

Occupancy

Occupancy rate
84%
Rank #120 / 209Occupancy rate — State benchmarkedThis home is ranked 120th out of 209 homes in Kentucky. Shows this facility's occupancy rate versus the Kentucky average, with its Statewide rank out of 209. Higher occupancy signals strong local demand and financial stability.Rankings are based only on facilities in Kentucky that report data for that category. Facilities without available data are excluded from the ranking.Click the rank badge to see the full State ranking.Click here to see the full State ranking.
Similar to the Kentucky average: 81.3%
Occupied beds
52 / 62
Average occupied beds in Kentucky homes 80 beds

License Details

Facility TypeAssisted Living Community - Behavioral Health
ExpirationMay 31, 2026 Expired
CountyJefferson
License Number100240
CMS Certification Number185305

Ownership & Operating Entity

The Willows at Springhurst is administered by Carla Sieckert.

Contact The Willows at Springhurst

Inspection History

In Kentucky, the Cabinet for Health and Family Services, Office of Inspector General is the regulatory authority that conducts inspections and investigates complaints in all long-term care homes.

Since 2021 · 5 years of data 12 deficiencies 3 inspections

Inspection Scorecard Info This scorecard compares key inspection, deficiency, and complaint metrics at this facility against the Kentucky state average. Metrics rated ≥15% worse than average are highlighted in red; those ≥15% better are highlighted in green.

Since 2021 vs. Kentucky state average
Overall vs. KY average 3 Worse Metrics worse than Kentucky average:
• Total deficiencies (100% above)
• Deficiencies per year (100% above)
• Deficiencies per inspection (100% above)
1 At Avg Metrics at Kentucky average:
• Total inspections (at KY avg)
0 Better No metrics in this bucket.
Latest Inspection December 3, 2025 Annual Inspection

Deficiencies Info Deficiencies are formal regulatory issues recorded during state inspections.

This FacilityKY Averagevs. KY Avg
Total deficiencies Info Formal regulatory issues recorded by inspectors across all inspection types. 126 This facility has 100% more total deficiencies than a typical Kentucky nursing home (12 vs. KY avg 6).↑ 100% worse
Deficiencies per year Info Average deficiencies per year since 2021. 2.41.2 This facility has 100% more deficiencies per year than a typical Kentucky nursing home (2.4 vs. KY avg 1.2).↑ 100% worse
Deficiencies per inspection Info Average deficiencies per inspection. 42 This facility has 100% more deficiencies per inspection than a typical Kentucky nursing home (4 vs. KY avg 2).↑ 100% worse

Inspections Info State inspections evaluate whether the facility meets health and safety standards.

This FacilityKY Averagevs. KY Avg
Total inspections Info Combined count of all routine and focused inspections. Excludes complaint investigations. 33 This facility has total inspections in line with the Kentucky average (3 vs. KY avg 3).— At avg

Health Inspection History

Inspections since 2020
Total health inspections 3

Kentucky average 2.9


Last Health inspection on Sep 2021

Total health citations
17 Rank #135 / 195Health citations — State benchmarkedThis home is ranked 135th out of 195 homes in Kentucky. Shows this facility's total health deficiency citations benchmarked to the Kentucky State average, with a ranking across all 195 KY facilities. Lower citation counts earn a better rank.Rankings are based only on facilities in Kentucky that report data for that category. Facilities without available data are excluded from the ranking.Click the rank badge to see the full State ranking.Click here to see the full State ranking.

Kentucky average 13.5

Citations per inspection
5.67 Rank #148 / 195Citations per inspection — State benchmarkedThis home is ranked 148th out of 195 homes in Kentucky. Shows average deficiency citations per CMS inspection for this facility versus the Kentucky mean across 195 facilities with citation data. Lower is better.Rankings are based only on facilities in Kentucky that report data for that category. Facilities without available data are excluded from the ranking.Click the rank badge to see the full State ranking.Click here to see the full State ranking.

Kentucky average 4.4


Health citations are formal notices following inspections when they fail to comply with safety and care standards.

All 17 citations resulted from standard inspections.

Breakdown of citation severity (last 6 years)
Critical health citations
0
100% better than Kentucky average

Kentucky average: 1.1


Serious health citations
0
100% better than Kentucky average

Kentucky average: 0.6

0 critical citations Kentucky average: 1.1

0 serious citations Kentucky average: 0.6

17 moderate citations Kentucky average: 11.6

0 minor citations Kentucky average: 0.1
Citations history (last 6 years)
Nursing Services moderate citation Sep 03, 2021
Corrected

Nutrition moderate citation Sep 03, 2021
Corrected

Nutrition moderate citation Sep 03, 2021
Corrected

Quality of Care moderate citation Sep 03, 2021
Corrected

Staffing Data

Reporting period: October 1 – December 31, 2025 (Q4 2025). Source: CMS Payroll-Based Journal report.

Total staff 134
Employees 115
Contractors 19
Staff to resident ratio 3.05 : 1
77% more staff per resident than Kentucky average
Kentucky average ratio: 1.72 : 1 Kentucky average ratio: 1.72 : 1See full Kentucky ranking
Avg staff/day 37
Average shift 7.6 hours
11% worse than Kentucky average
Kentucky average: 8.5 hours Kentucky average shift: 8.5 hoursSee full Kentucky ranking
Total staff hours (quarter) 25,977

Nursing staff breakdown

Q4 2025 · Oct 1 – Dec 31 More info This data comes from the CMS Payroll-Based Journal report covering October 1 – December 31, 2025.
Registered Nurse

Manages medical care and health needs.

RN Staff Info All 11 RN Staff are full-time employees. No contractors work on this role. 11
Average shift length Info Average shift length. Calculated as total hours divided by days worked and average staff per day. 10.1 hours
Licensed Practical Nurse

Assists with medical care and medications.

LPN Staff Info All 19 LPN Staff are full-time employees. No contractors work on this role. 19
Average shift length Info Average shift length. Calculated as total hours divided by days worked and average staff per day. 7.9 hours
Certified Nursing Assistant

Helps with daily care and mobility.

CNA Staff Info All 42 CNA Staff are full-time employees. No contractors work on this role. 42
Average shift length Info Average shift length. Calculated as total hours divided by days worked and average staff per day. 7.9 hours

Contractor staffing

Q4 2025 · Oct 1 – Dec 31 More info This data comes from the CMS Payroll-Based Journal report covering October 1 – December 31, 2025.

Total hours from contractors

9.9%

2,572 contractor hours this quarter

Physical Therapy Aide: 6 Respiratory Therapy Technician: 4 Physical Therapy Assistant: 3 Speech Language Pathologist: 3 Qualified Social Worker: 2 Medical Director: 1

Staff by category

Q4 2025 · Oct 1 – Dec 31 More info This data comes from the CMS Payroll-Based Journal report covering October 1 – December 31, 2025.
Certified Nursing Assistant420428,86492100%7.9
Registered Nurse110114,02492100%10.1
Other Dietary Services Staff110112,43592100%7.5
Licensed Practical Nurse190192,3738997%7.9
Medication Aide/Technician150151,5039098%6.6
Clinical Nurse Specialist7071,1116368%7.7
RN Director of Nursing2021,0277582%8.2
Administrator2021,0086368%8
Speech Language Pathologist0337426975%5.6
Physical Therapy Assistant0335457784%6.8
Nurse Practitioner1015046368%8
Physical Therapy Aide0664807177%4.8
Dietitian1014585560%8.3
Qualified Social Worker0223936065%6.4
Respiratory Therapy Technician0443876975%5.6
Mental Health Service Worker10164910%7.1
Occupational Therapy Assistant303335863%0.5
Medical Director011272729%1
42 Certified Nursing Assistant
% of Days 100%
11 Registered Nurse
% of Days 100%
11 Other Dietary Services Staff
% of Days 100%
19 Licensed Practical Nurse
% of Days 97%
15 Medication Aide/Technician
% of Days 98%
7 Clinical Nurse Specialist
% of Days 68%
2 RN Director of Nursing
% of Days 82%
2 Administrator
% of Days 68%
3 Speech Language Pathologist
% of Days 75%
3 Physical Therapy Assistant
% of Days 84%
1 Nurse Practitioner
% of Days 68%
6 Physical Therapy Aide
% of Days 77%
1 Dietitian
% of Days 60%
2 Qualified Social Worker
% of Days 65%
4 Respiratory Therapy Technician
% of Days 75%
1 Mental Health Service Worker
% of Days 10%
3 Occupational Therapy Assistant
% of Days 63%
1 Medical Director
% of Days 29%

Penalties and fines

Federal penalties imposed by CMS for regulatory violations, including civil money penalties (fines) and denials of payment for new Medicare/Medicaid admissions.

Source: CMS Penalties Database

No penalties in the past 3 years

No civil money penalties or payment denials were reported in the last 3 years.

Quality of care over time

These measures show how residents usually do over time at this home, based on health outcomes and preventive care.

High-risk clinical events score Info A composite score based on pressure ulcers, falls with injury, weight loss, walking ability decline, and activities of daily living decline. 5.1
51% better than Kentucky average

Kentucky average: 10.5

Functional decline score Info A composite score based on activities of daily living decline, walking ability decline, and incontinence. 14.1
25% better than Kentucky average

Kentucky average: 18.9

Long-stay resident measures
Above average Kentucky avg: 3.5 Info CMS star rating based on long-stay quality measure performance. 5 stars = significantly above average, 1 star = significantly below average.
Need for Help with Daily Activities Increased Info Percent of long-stay residents whose need for help with daily activities has increased 4.4%
74% better than Kentucky average

Kentucky average: 16.8%

Low Risk Residents with Bowel/Bladder Incontinence Info Percent of low risk long-stay residents who lose control of their bowels or bladder 23.8%
16% worse than Kentucky average

Kentucky average: 20.5%

Falls with Major Injury Info Percent of long-stay residents experiencing one or more falls with major injury 10.6%
181% worse than Kentucky average

Kentucky average: 3.8%

High Risk Residents with Pressure Ulcers Info Percent of long-stay high risk residents with pressure ulcers 2.1%
64% better than Kentucky average

Kentucky average: 5.8%

Urinary Tract Infection Info Percent of long-stay residents with a urinary tract infection 3.0%
62% worse than Kentucky average

Kentucky average: 1.9%

Lost Too Much Weight Info Percent of long-stay residents who lose too much weight 3.4%
50% better than Kentucky average

Kentucky average: 6.8%

Depressive Symptoms Info Percent of long-stay residents who have depressive symptoms 0.0%
100% better than Kentucky average

Kentucky average: 14.3%

Antipsychotic Use Info Percent of long-stay residents who received an antipsychotic medication 9.0%
42% better than Kentucky average

Kentucky average: 15.6%

Pneumococcal Vaccine Info Percent of long-stay residents assessed and appropriately given the pneumococcal vaccine 100.0%
6% better than Kentucky average

Kentucky average: 93.9%

Influenza Vaccine Info Percent of long-stay residents assessed and appropriately given the seasonal influenza vaccine 92.6%
In line with Kentucky average

Kentucky average: 96.2%

Hospitalizations per 1,000 days Info Number of hospitalizations per 1,000 long-stay resident days. 1.75
6% better than Kentucky average

Kentucky average: 1.87

ED visits per 1,000 days Info Number of outpatient emergency department visits per 1,000 long-stay resident days. 1.57
28% better than Kentucky average

Kentucky average: 2.19

Short-stay resident measures
Significantly above average Kentucky avg: 2.2 Info CMS star rating based on short-stay quality measure performance. 5 stars = much above average, 1 star = much below average.
Pneumococcal Vaccine Info Percent of short-stay residents assessed and appropriately given the pneumococcal vaccine 91.3%
9% better than Kentucky average

Kentucky average: 83.7%

Antipsychotic medication increase Info Percent of short-stay residents who newly received an antipsychotic medication 1.3%
32% better than Kentucky average

Kentucky average: 1.9%

Influenza Vaccine Info Percent of short-stay residents assessed and appropriately given the seasonal influenza vaccine 90.5%
8% better than Kentucky average

Kentucky average: 83.6%

Re-hospitalized after SNF stay Info Percentage of short-stay residents who were re-hospitalized after their nursing home admission. 20.5%
16% better than Kentucky average

Kentucky average: 24.5%

Emergency department visits Info Percentage of short-stay residents who had an outpatient emergency department visit. 8.1%
42% better than Kentucky average

Kentucky average: 13.9%

Falls with major injury Info Percentage of SNF residents who experience falls with major injury during their stay. 1.0%
29% worse than Kentucky average

Kentucky average: 0.8%

Ability to care for self at discharge Info Percentage of residents at or above expected ability to care for themselves at discharge. 53.9%
In line with Kentucky average

Kentucky average: 53.7%

Successful return to home or community Info Rate of successful return to home or community from a skilled nursing facility. 69.5%
37% better than Kentucky average

Kentucky average: 50.6%

Breakdown by payment type

Medicare

61% of new residents, usually for short-term rehab.

Typical stay 23 days

Private pay

36% of new residents, often for short stays.

Typical stay 9 - 10 months

Medicaid

4% of new residents, often for long-term daily care.

Typical stay 2 years

Facility Characteristics

Source: CMS Long-Term Care Facility Characteristics (Data as of Jan 2026)

Total residents 44
Medicare
7
15.9% of residents
Medicaid
25
56.8% of residents
Private pay or other
12
27.3% of residents

Finances and operations

Based on CMS SNF Cost Report for fiscal year ending in 12/2023.

Nonprofit
Operated by a church.
Net patient revenue Info Net patient revenue — what the home actually collects for resident care, after contractual allowances, bad debt and discounts are subtracted from its gross charges (CMS cost report, Worksheet G-3). It covers resident care only; money the home earns from other sources is shown separately as "Other income."
$13.3M
Net patient income Info Net patient income: net patient revenue minus the home's total operating expenses. A positive figure means it earns more from resident care than it spends to deliver it; a negative figure means the opposite. It excludes non-operating "other income."
-$1.7M
Nonprofit Operated by a church.
Net patient revenue Info Net patient revenue — what the home actually collects for resident care, after contractual allowances, bad debt and discounts are subtracted from its gross charges (CMS cost report, Worksheet G-3). It covers resident care only; money the home earns from other sources is shown separately as "Other income."
$13.3M Rank #41 / 197Revenue — State benchmarkedThis home is ranked 41st out of 197 homes in Kentucky. Shows this facility's annual revenue compared to the Kentucky average. Higher revenue generally means more resources for staffing and capital — read alongside Payroll %.Rankings are based only on facilities in Kentucky that report data for that category. Facilities without available data are excluded from the ranking.Click the rank badge to see the full State ranking.Click here to see the full State ranking.
Net patient income Info Net patient income: net patient revenue minus the home's total operating expenses. A positive figure means it earns more from resident care than it spends to deliver it; a negative figure means the opposite. It excludes non-operating "other income."
-$1.7M
Other income Info Money the home earns outside of resident care — such as investments, grants, rentals and other non-operating sources (CMS cost report, Worksheet G-3). It is tracked separately from net patient revenue: it is not part of that figure, and it is not included in net patient income.
$28.5K
Payroll costs Info Staff salaries plus wage-related costs — benefits such as payroll taxes, health insurance and retirement — from the home's own accounting records (CMS cost report, Worksheet A). Contract or agency labor is counted separately, under other operating costs. Rank #24 / 197Payroll — State benchmarkedThis home is ranked 24th out of 197 homes in Kentucky. Shows total annual staff payroll benchmarked to the Kentucky average. Higher payroll investment relative to peers often signals better staffing and less reliance on cheaper contract labor.Rankings are based only on facilities in Kentucky that report data for that category. Facilities without available data are excluded from the ranking.Click the rank badge to see the full State ranking.Click here to see the full State ranking.
$7.7M 57.8% of net patient revenue Info Payroll as a share of revenue: staff salaries and wage-related benefits divided by net patient revenue. A higher figure means more of each revenue dollar goes to staff pay. Rank #43 / 197Payroll % — State benchmarkedThis home is ranked 43rd out of 197 homes in Kentucky. Shows payroll as a percentage of revenue versus the Kentucky average. Well-run Kentucky facilities typically land around 51–61% — the top third Statewide. Below 25% may signal understaffing or heavy agency use — read with Staffing ratings.Rankings are based only on facilities in Kentucky that report data for that category. Facilities without available data are excluded from the ranking.Click the rank badge to see the full State ranking.Click here to see the full State ranking.
Other operating costs Info Everything it costs to run the home apart from payroll — food, utilities, supplies, maintenance, contract labor and administration. Calculated as total operating expense minus payroll (staff salaries and wage-related benefits).
$7.4M
Total costs Info The home's total operating expense for the year — all the costs of running it, salaries included (CMS cost report, Worksheet G-3).
$15.0M

What does this home offer?

Pets allowed icon
Pets allowed icon

Pets Allowed

Room sizes icon
Room sizes icon

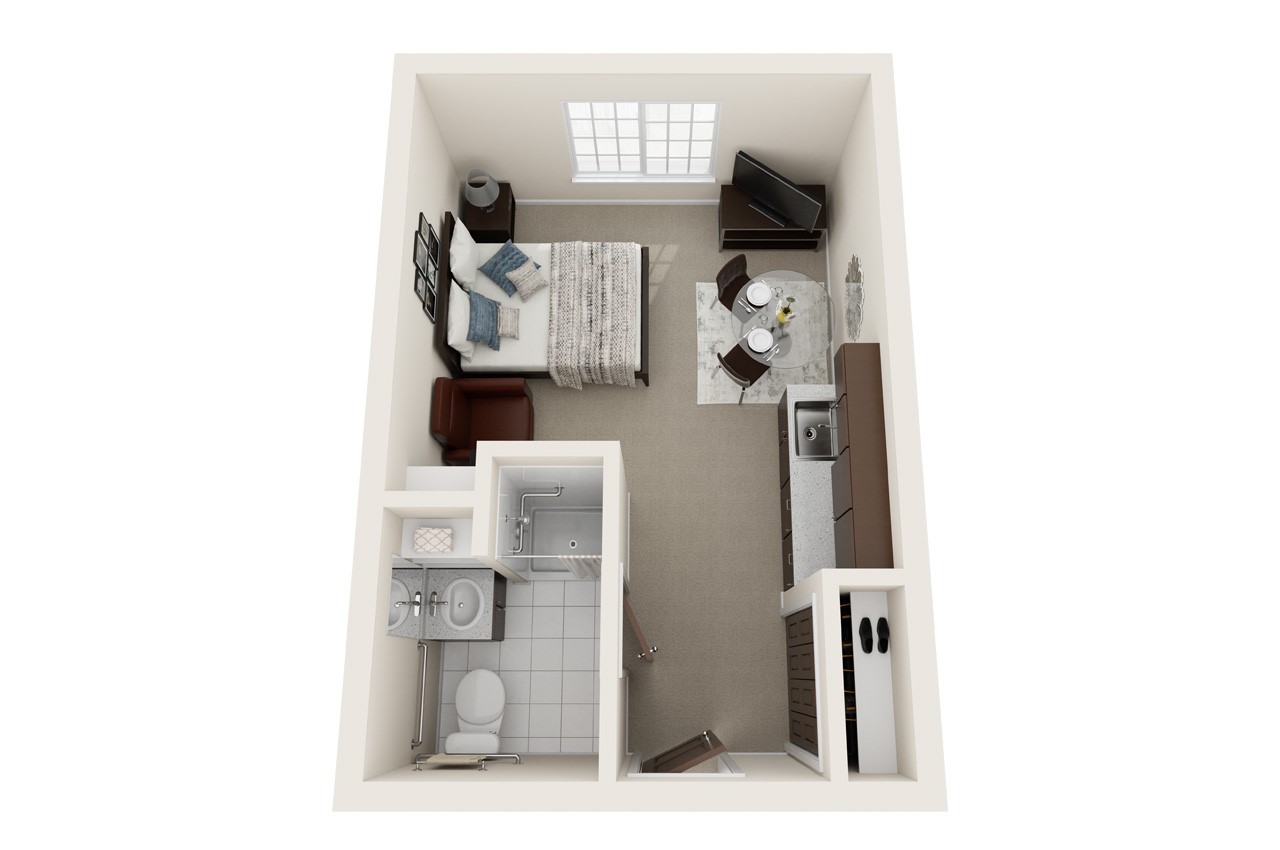
Room Sizes: 140 - 477 / 424 - 929 sq.ft

Housing options icon

Housing Options: Studio / 1 Bed / 2 Bed

Transportation services icon

Transportation Services

Fitness and recreation icon

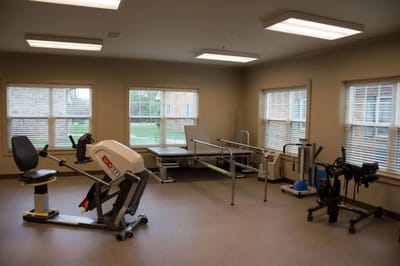
Fitness and Recreation

Who this home usually serves

TYPE OF STAY

Mostly short-term rehab stays

Most residents typically stay for a few weeks or months before returning home or moving on.

Most new residents arrive under Medicare (61% of admissions), and a typical Medicare stay runs around 23 days.

Admissions
307 total

Coverage residents most often arrive under.

Medicare 61%
Private pay 36%
Medicaid 4%
Discharges
510 total

Coverage residents most often leave under.

Medicare 44%
Private pay 49%
Medicaid 6%

Living Spaces & Floor Plans for The Willows at Springhurst

1 Bedroom
Studio
Studio
Studio

Places of interest near The Willows at Springhurst

Address 3101 N Hurstbourne Pkwy, Louisville, KY 40241

Calculate Travel Distance to The Willows at Springhurst

Add your location

Address

Compare Nursing Homes around Louisville

The information below is reported by the Kentucky Cabinet for Health and Family Services, Office of Inspector General.

5 facilities compared · CMS & KY Dept. of Health data

Nazareth Home Clifton
NH
IL
MC
Louisville (Clifton Heights)
144
Facility 144
KY AVG 82
Rank #24 / 341
69.9%
Facility 69.9%
KY AVG 81.3%
Rank #180 / 209
-14%
4.23
Facility 4.23
KY AVG 3.75
Rank #26 / 193
+1%+13%
$0
Facility $0
KY AVG $65.4k
Rank #1 / 199
17
Facility 17
KY AVG 13.5
Rank #135 / 195
5.7
Facility 5.7
KY AVG 4.4
Rank #148 / 195
-105A+
36
Facility 36
KY AVG 41
Rank #244 / 423
Greg Cobb
$13.3M
Facility $13.3M
KY AVG $10.5M
Rank #25 / 197
$8.0M
Facility $8.0M
KY AVG $4.0M
Rank #27 / 197
59.8%
Facility 59.8%
KY AVG 40.7%
Rank #88 / 197
185442
Westport Place Health Campus
NH
AL
RC
Louisville
22
Facility 22
KY AVG 82
Rank #325 / 341
100.0%
Facility 100.0%
KY AVG 81.3%
Rank #1 / 209
+23%
3.44
Facility 3.44
KY AVG 3.75
Rank #77 / 193
+46%-8%
$0
Facility $0
KY AVG $65.4k
Rank #1 / 199
5
Facility 5
KY AVG 13.5
Rank #20 / 195
2.5
Facility 2.5
KY AVG 4.4
Rank #31 / 195
-55-
47
Facility 47
KY AVG 41
Rank #183 / 423
Lauren Powers
$11.5M
Facility $11.5M
KY AVG $10.5M
Rank #50 / 197
$5.9M
Facility $5.9M
KY AVG $4.0M
Rank #46 / 197
50.9%
Facility 50.9%
KY AVG 40.7%
Rank #85 / 197
185466
The Springs at Stony Brook
NH
ADC
AL
IL
MC
Louisville
106
Facility 106
KY AVG 82
Rank #79 / 341
72.4%
Facility 72.4%
KY AVG 81.3%
Rank #172 / 209
-11%
3.30
Facility 3.30
KY AVG 3.75
Rank #94 / 193
-27%-12%
$0
Facility $0
KY AVG $65.4k
Rank #1 / 199
3
Facility 3
KY AVG 13.5
Rank #7 / 195
3.0
Facility 3.0
KY AVG 4.4
Rank #48 / 195
-66-
28
Facility 28
KY AVG 41
Rank #292 / 423
Hurstbourne Healthcare, LLC
$11.1M
Facility $11.1M
KY AVG $10.5M
Rank #70 / 197
$6.4M
Facility $6.4M
KY AVG $4.0M
Rank #42 / 197
57.2%
Facility 57.2%
KY AVG 40.7%
Rank #45 / 197
185485
Essex Nursing and Rehabilitation Center
NH
AL
Louisville (Lamborne Boulevard)
128
Facility 128
KY AVG 82
Rank #38 / 341
88.8%
Facility 88.8%
KY AVG 81.3%
Rank #82 / 209
+9%
3.62
Facility 3.62
KY AVG 3.75
Rank #55 / 193
-50%-3%
$0
Facility $0
KY AVG $65.4k
Rank #1 / 199
10
Facility 10
KY AVG 13.5
Rank #80 / 195
3.3
Facility 3.3
KY AVG 4.4
Rank #66 / 195
-118-
12
Facility 12
KY AVG 41
Rank #358 / 423
Joseph Flatt
$13.2M
Facility $13.2M
KY AVG $10.5M
Rank #47 / 197
$6.0M
Facility $6.0M
KY AVG $4.0M
Rank #23 / 197
45.8%
Facility 45.8%
KY AVG 40.7%
Rank #24 / 197
185288
The Willows at Springhurst
NH
AL
IL
MC
RC
Louisville
62
Facility 62
KY AVG 82
Rank #218 / 341
83.7%
Facility 83.7%
KY AVG 81.3%
Rank #120 / 209
+3%
3.32
Facility 3.32
KY AVG 3.75
Rank #94 / 193
-24%-12%
$0
Facility $0
KY AVG $65.4k
Rank #1 / 199
17
Facility 17
KY AVG 13.5
Rank #135 / 195
5.7
Facility 5.7
KY AVG 4.4
Rank #148 / 195
-48A+
34
Facility 34
KY AVG 41
Rank #261 / 423
Carla Sieckert
$13.3M
Facility $13.3M
KY AVG $10.5M
Rank #41 / 197
$7.7M
Facility $7.7M
KY AVG $4.0M
Rank #24 / 197
57.8%
Facility 57.8%
KY AVG 40.7%
Rank #43 / 197
185305

Financial Assistance for
Nursing Home in Kentucky

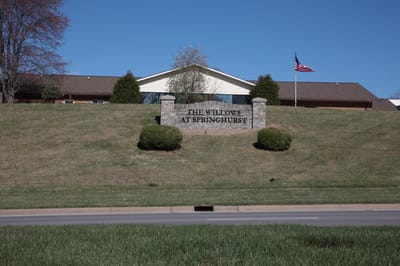
The Willows at Springhurst is located in Louisville, Kentucky.
Here are the financial assistance programs available to residents in Kentucky.

Get Financial aid guidance

Home and Community Based Waiver

Kentucky Medicaid HCB Waiver

Age 65+ or disabled
General Kentucky resident, Medicaid-eligible, nursing home-level care need.
Income Limits (2025) ~$2,829/month 300% FBR, individual
Asset Limits $2,000 (individual), $3,000 (couple).
KY

Rural focus; waitlists possible.

Benefits
Personal care (5-7 hours/day) Respite (240 hours/year) Homemaker services Home modifications

Hart-Supported Living Program

KY Hart-Supported Living

Age 65+ or disabled
General Kentucky resident.
Income Limits No strict limit; prioritizes low-income.
Asset Limits Not applicable.
KY

Competitive grants; limited availability.

Benefits
In-home support (up to 10 hours/week) Respite (varies) Adaptive equipment (~$500 avg.)

Kentucky Homecare Program

Kentucky Homecare Program

Age 60+
General Kentucky resident, at risk of nursing home placement, not eligible for Medicaid waivers.
Income Limits (2025) No strict limit; prioritizes low-income ~$24,980/year individual
Asset Limits Not assessed; need-based focus.
KY

15 AAAs; rural focus; not in nursing homes.

Benefits
Personal care (4-6 hours/day) Respite (5 days/year) Chore services Meal delivery ($7/meal) Minor home repairs

Medicare Savings Program (MSP)

Kentucky Medicare Savings Program

Age 65+ or disabled
General Kentucky resident, Medicare Part A/B.
Income Limits (2025) ~$2,510/month (QMB), ~$3,380/month (SLMB), ~$3,598/month (QI)—individual.
Asset Limits $9,430 (individual), $14,130 (couple).
KY

Three tiers; no waitlist; auto Extra Help for Part D.

Benefits
Covers Part B premiums ($174.70/month) Deductibles ($240/year) Copays (~20%)

National Family Caregiver Support Program (NFCSP) Respite

Kentucky NFCSP Respite Care

Age
General Caregivers of 60+ needing care or 55+ caregivers of others; Kentucky resident; functional needs (2+ ADLs).
Income Limits (2025) Prioritizes ~$24,980/year (individual); no strict cap.
Asset Limits Not assessed; need-based.
KY

15 AAAs; prioritizes low-income, rural caregivers.

Benefits
Respite (4-6 hours/week or 5 days/year) Adult day care ($55/day) Caregiver training Supplies (~$500/year)

Kentucky Family Caregiver Program

Kentucky Family Caregiver Program

Age
General Grandparents (often 55+) as primary caregivers to grandchildren under 18, Kentucky resident, not on Kinship Care.
Income Limits (2025) ~$31,225/year (individual); varies by AAA.
Asset Limits Not strictly assessed; need-based.
KY

Max $1,500/year; statewide via AAAs.

Benefits
Grants (~$500-$1,500/year) for respite Supplies Care costs; counseling Training

VA Aid and Attendance (A&A) and Housebound Benefits

Kentucky VA Aid and Attendance/Housebound

Age 65+ or disabled veteran/spouse
General Kentucky resident, wartime service, need for ADL help (A&A) or homebound.
Income Limits (2025) Net income < ~$1,984/month (veteran with dependent, A&A); pension offsets income.
Asset Limits ~$155,356 net worth limit
KY

High veteran demand in rural areas.

Benefits
Cash (~$1,433-$2,642/month veteran, ~$951-$1,318 spouse) for care costs (e.g., in-home, assisted living)

Frequently Asked Questions about The Willows at Springhurst

Is The Willows at Springhurst in a walkable area?

The Willows at Springhurst has a walk score of 34. Somewhat walkable. A few nearby services may be reachable on foot, but most trips require transportation.

What is the license number of The Willows at Springhurst?

According to KY state health department records, The Willows at Springhurst's license number is 100240.

When does The Willows at Springhurst's license expire?

According to KY state health department records, The Willows at Springhurst's license expires on May 31, 2026.

What is the occupancy rate at The Willows at Springhurst?

The Willows at Springhurst's occupancy is 84%.

Does The Willows at Springhurst operate as a for-profit or non-profit?

The Willows at Springhurst is registered as a non-profit in KY.

Who is the administrator of The Willows at Springhurst?

Carla Sieckert is the administrator of The Willows at Springhurst.

How many beds does The Willows at Springhurst have?

The Willows at Springhurst has 62 beds.

Guides for Better Senior Living

Care Cost Calculator: See Prices in Your Area

Nursing Home Data Explorer

Don’t Wait Too Long: 7 Red Flag Signs Your Parent Needs Assisted Living Now

The True Cost of Assisted Living in 2025 – And How Families Are Paying For It

Understanding Senior Living Costs: Pricing Models, Discounts & Financial Assistance