


Thornton Heights Assisted Living
Nursing Home, Assisted Living, Hospice Care, Respite Care & Skilled Nursing · Lansing, IA
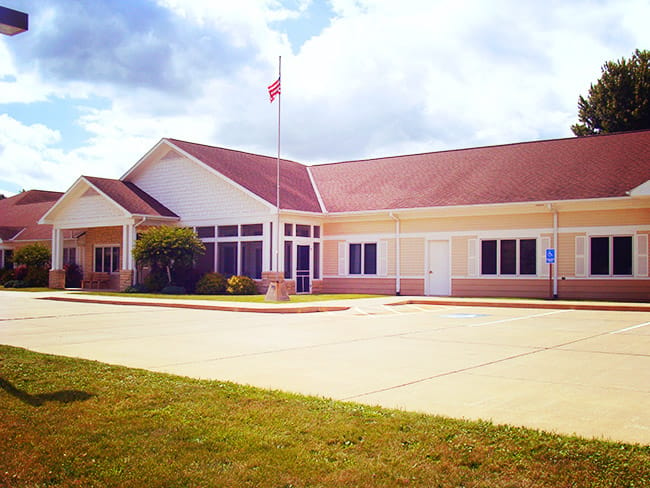
Thornton Heights Assisted Living
Nursing Home, Assisted Living, Hospice Care, Respite Care & Skilled Nursing · Lansing, IA
Make every moment count at Thornton Heights Assisted Living, a distinguished community in Lansing, IA, offering assisted living. Featuring beautifully furnished and secure one- and two-bedroom floor plans, the community ensures residents are comfortable and safe. Residents also receive exceptional care tailored to their daily living activities and personal needs around the clock.
A jam-packed calendar of engaging activities and enriching programs is conducted to keep residents active and socially connected. Delicious and well-balanced meals are also served three times daily to meet residents’ dietary needs and preferences. Emergency pendants are also provided for convenience and safety. The community is ideal for those looking to live comfortably in retirement, especially with its nurturing and welcoming environment.
26-bed community Rank #395 / 404Bed count — State benchmarkedThis home is ranked 395th out of 404 homes in Iowa for bed count. Shows this facility's certified or reported bed count compared to other Iowa facilities. Larger communities may offer more amenities, programs, and on-site services for residents and families.Facilities with the same value for a metric share the same rank. Rankings are based only on facilities in Iowa that report data for that category. Facilities without available data are excluded from the ranking.Click the rank badge to see the full State ranking.Click here to see the full State ranking.
A moderately sized community that may balance personal attention with shared amenities and social activities.
22 years in operation Rank #118 / 286Years in operation — State benchmarkedThis home is ranked 118th out of 286 homes in Iowa for years in operation. Shows how long this facility has been in operation compared to other Iowa facilities. Longer operating histories may benefit residents, families, and staff.Facilities with the same value for a metric share the same rank. Rankings are based only on facilities in Iowa that report data for that category. Facilities without available data are excluded from the ranking.Click the rank badge to see the full State ranking.Click here to see the full State ranking.
A longer operating history, which may indicate experience navigating regulations and delivering ongoing care.
Walk Score: 14 / 100 Rank #443 / 505Walk Score — State benchmarkedThis home is ranked 443rd out of 505 homes in Iowa for walk score. Shows how walkable this facility's neighborhood is compared to the average walk score across Iowa facilities. Higher scores benefit residents, families, and staff.Facilities with the same value for a metric share the same rank. Rankings are based only on facilities in Iowa that report data for that category. Facilities without available data are excluded from the ranking.Click the rank badge to see the full State ranking.Click here to see the full State ranking.
Car-dependent. Most errands require a car, with limited nearby walkable options.
About this community
Facility TypeAssisted Living Programs
StatusActive
IssuanceNovember 18, 2003
ExpirationNovember 18, 2027
CountyAllamakee
License NumberS0183
Year Opened11/18/2003
Thornton Heights Assisted Living is administered by Sam Kuhn.
Email
samkuhn@rconnect.com
Fax5635384460
Inspection History
In Iowa, the Department of Inspections, Appeals, and Licensing conducts unannounced health and safety surveys to monitor compliance and protect residents in long-term care settings.
Since 2011 · 15 years of data
1 deficiency
7 inspections
Inspection Scorecard
 This scorecard compares key inspection, deficiency, and complaint metrics at this facility against the Iowa state average. Metrics rated ≥15% worse than average are highlighted in red; those ≥15% better are highlighted in green.
Since 2011 vs. Iowa state average
Overall vs. IA average
0 Worse
No metrics in this bucket.
1 Better
Metrics better than Iowa average:
• Total deficiencies (96% below)
• Total deficiencies (96% below)
Deficiencies
| This Facility | IA Average | vs. IA Avg |
|---|---|---|---|
|
Total deficiencies
| 1 | 27 | This facility has 96% fewer total deficiencies than a typical Iowa nursing home (1 vs. IA avg 27).↓ 96% better |
Inspections
| This Facility | IA Average | vs. IA Avg |
|---|---|---|---|
|
Total inspections
| 7 | 15 | This facility has had 53% fewer total inspections than the Iowa average (7 vs. IA avg 15). More inspections can mean more regulatory scrutiny rather than worse care.↓ 53% fewer |
What does this home offer?
No pets allowed
Room Sizes: 670 / 960 sq. ft
Housing Options: 1 Bed / 2 Bed
Building Type: Single-story
Social and Recreational Activities

Parking Available
Places of interest near Thornton Heights Assisted Living
![]() 1.0 miles from city center
1.0 miles from city center
![]() Estimated distance in miles from Lansing's city center to Thornton Heights Assisted Living's address, calculated via Google Maps.
Estimated distance in miles from Lansing's city center to Thornton Heights Assisted Living's address, calculated via Google Maps.
Calculate Travel Distance to Thornton Heights Assisted Living
Add your location
Compare Nursing Homes around the area
Info below is compiled from CMS reports & the IA Dept. of Inspections, Appeals & Licensing (DIAL), senior community websites & trusted data sources such as Walk Score & BBB.
Communities are listed from highest to lowest based on our ranking methodology.
| Bethany Home Retirement Center | NH IL MC SNF | Dubuque (Eagle Point District) | 66
Facility
66
IA AVG
72
Rank
#181 / 404 | - | - | 4.19
Facility
4.19
IA AVG
4.30
Rank
#112 / 234 | 0% | -2% | $0
Facility
$0
IA AVG
$53.4k
Rank
#1 / 239 | 2
Facility
2
IA AVG
21.7
Rank
#6 / 232 | 2.0
Facility
2.0
IA AVG
4.1
Rank
#19 / 232 | - | 67 | - |
69
Facility
69
IA AVG
47
Rank
#103 / 505 | Mike Brannon | $9.2MFiscal year ending 12/2023
Facility
$9.2MFiscal year ending 12/2023
IA AVG
$6.9M
Rank
#42 / 224 | $6.2MFiscal year ending 12/2023
Facility
$6.2MFiscal year ending 12/2023
IA AVG
$4.2M
Rank
#32 / 224 | 68%Fiscal year ending 12/2023
Facility
68%Fiscal year ending 12/2023
IA AVG
60.3%
Rank
#43 / 224 | 165584 | ||||
| St Francis Manor | NH AL HOS SNF | Grinnell | 78
Facility
78
IA AVG
72
Rank
#119 / 404 |
69.2%
Facility
69.2%
IA AVG
64.7
Rank
#193 / 377 | +7% | 5.32
Facility
5.32
IA AVG
4.30
Rank
#23 / 234 | +34% | +24% | $0
Facility
$0
IA AVG
$53.4k
Rank
#1 / 239 | 1
Facility
1
IA AVG
21.7
Rank
#1 / 232 | 1.0
Facility
1.0
IA AVG
4.1
Rank
#1 / 232 | - | 54 | - |
82
Facility
82
IA AVG
47
Rank
#39 / 505 | St Francis Manor Inc | $7.3MFiscal year ending 12/2023
Facility
$7.3MFiscal year ending 12/2023
IA AVG
$6.9M
Rank
#82 / 224 | $5.0MFiscal year ending 12/2023
Facility
$5.0MFiscal year ending 12/2023
IA AVG
$4.2M
Rank
#50 / 224 | 69.4%Fiscal year ending 12/2023
Facility
69.4%Fiscal year ending 12/2023
IA AVG
60.3%
Rank
#38 / 224 | 165480 | ||||
| Friendship Village | NH AL IL MC SNF | Waterloo | 72
Facility
72
IA AVG
72
Rank
#143 / 404 |
91.7%
Facility
91.7%
IA AVG
64.7
Rank
#41 / 377 | +42% | 6.17
Facility
6.17
IA AVG
4.30
Rank
#3 / 234 | +5% | +44% | $0
Facility
$0
IA AVG
$53.4k
Rank
#1 / 239 | 8
Facility
8
IA AVG
21.7
Rank
#44 / 232 | 2.0
Facility
2.0
IA AVG
4.1
Rank
#19 / 232 | 1 | 66 | - |
52
Facility
52
IA AVG
47
Rank
#202 / 505 | Friends Of Faith Retirement Homes, Inc | $14.2MFiscal year ending 03/2024
Facility
$14.2MFiscal year ending 03/2024
IA AVG
$6.9M
Rank
#10 / 224 | $11.6MFiscal year ending 03/2024
Facility
$11.6MFiscal year ending 03/2024
IA AVG
$4.2M
Rank
#6 / 224 | 81.4%Fiscal year ending 03/2024
Facility
81.4%Fiscal year ending 03/2024
IA AVG
60.3%
Rank
#14 / 224 | 165081 | ||||
| Prairie Vista Village | NH AL IL SNF | South Altoona | 68
Facility
68
IA AVG
72
Rank
#170 / 404 |
50.0%
Facility
50.0%
IA AVG
64.7
Rank
#254 / 377 | -23% | 4.71
Facility
4.71
IA AVG
4.30
Rank
#58 / 234 | -20% | +10% | $0
Facility
$0
IA AVG
$53.4k
Rank
#1 / 239 | 5
Facility
5
IA AVG
21.7
Rank
#17 / 232 | 1.3
Facility
1.3
IA AVG
4.1
Rank
#8 / 232 | - | 34 | A |
29
Facility
29
IA AVG
47
Rank
#372 / 505 | John Freeman | $9.1MFiscal year ending 12/2023
Facility
$9.1MFiscal year ending 12/2023
IA AVG
$6.9M
Rank
#43 / 224 | $3.7MFiscal year ending 12/2023
Facility
$3.7MFiscal year ending 12/2023
IA AVG
$4.2M
Rank
#102 / 224 | 40.8%Fiscal year ending 12/2023
Facility
40.8%Fiscal year ending 12/2023
IA AVG
60.3%
Rank
#221 / 224 | 165610 |
Frequently Asked Questions about Thornton Heights Assisted Living
What neighborhood is Thornton Heights Assisted Living in?
Thornton Heights Assisted Living is in the Main Street neighborhood of Lansing.
Is Thornton Heights Assisted Living in a walkable area?
Thornton Heights Assisted Living has a walk score of 14. Car-dependent. Most errands require a car, with limited nearby walkable options.
What is the license number of Thornton Heights Assisted Living?
According to IA state health department records, Thornton Heights Assisted Living's license number is S0183.
When does Thornton Heights Assisted Living's license expire?
According to IA state health department records, Thornton Heights Assisted Living's license expires on November 18, 2027.
How long has Thornton Heights Assisted Living been in business?
Thornton Heights Assisted Living has been operating for approximately 22 years, based on available licensing and registration records.
Are pets allowed at Thornton Heights Assisted Living?
No, Thornton Heights Assisted Living has a no-pet policy.
What is the best email address for Thornton Heights Assisted Living?
The team at Thornton Heights Assisted Living can be reached at samkuhn@rconnect.com.
Guides for Better Senior Living
Care Cost Calculator: See Prices in Your Area
Nursing Home Data Explorer
Don’t Wait Too Long: 7 Red Flag Signs Your Parent Needs Assisted Living Now
The True Cost of Assisted Living in 2025 – And How Families Are Paying For It
Understanding Senior Living Costs: Pricing Models, Discounts & Financial Assistance
Updated on
