Trellis Centennial
Nursing Home · Las Vegas, NV
CMS overall rating Info The Overall CMS Rating is scored from 1 to 5 stars and combines results from health inspections, staffing levels, and quality measures. Health inspections carry the most weight. Staffing and quality scores can increase or decrease the final rating based on performance compared to state and national standards.

Trellis Centennial

Nursing Home · Las Vegas, NV
CMS overall rating Info The Overall CMS Rating is scored from 1 to 5 stars and combines results from health inspections, staffing levels, and quality measures. Health inspections carry the most weight. Staffing and quality scores can increase or decrease the final rating based on performance compared to state and national standards.
Calculator: See prices in your area
Trellis Centennial accepts Medicare, Medicaid, and private pay.

Overview of Trellis Centennial

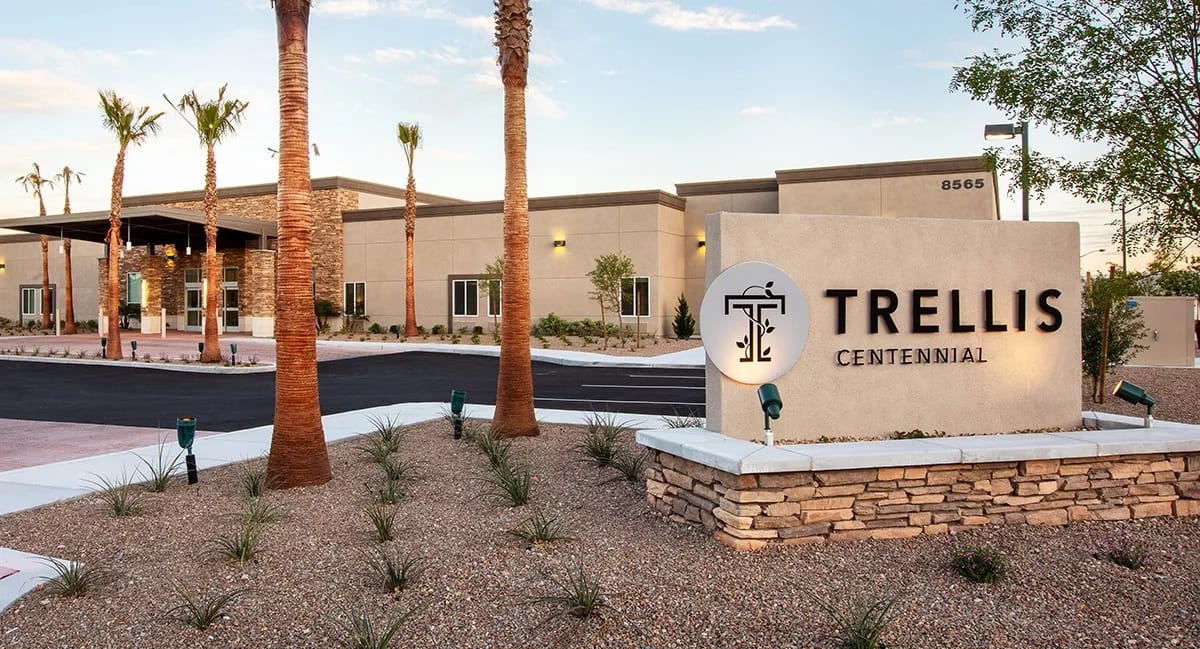
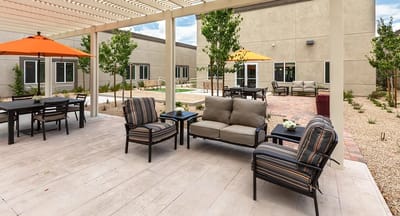
Trellis Centennial management and staff keep one thing in mind when providing their service: enhancing the lives of its residents by focusing on the healing journey. The dedicated team of professionals approaches their service with the understanding that their residents need a sense of safety and wellness– both on the physical and emotional levels. They ensure residents are inspired to grow as better individuals through their enhanced lifestyle in a vibrant and positive environment. Trellis Centennial is committed to ensuring that residents are comfortable and secure in the community. 
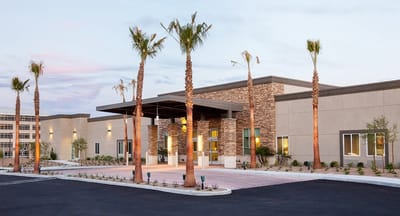
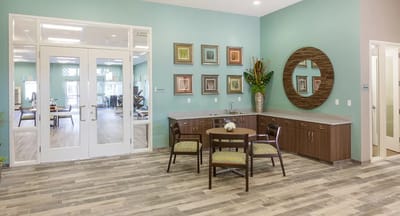
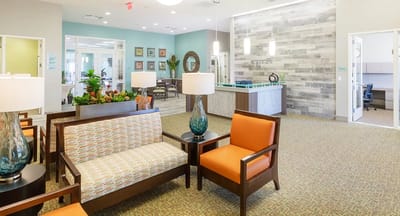
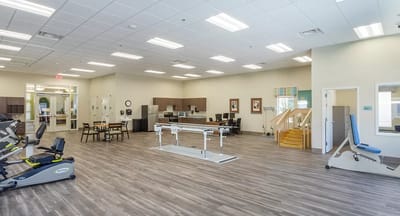
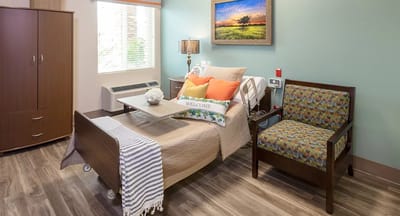
Trellis Centennial offers a list of wonderful amenities and services guaranteed to enrich the lives of its residents by offering an expansive rehabilitation gym, 24/8 nursing care, recreational activities at its massive courtyard, and spacious common areas. The patient-centered community for short-term or long-term skilled nursing allows for maximum potential in healing.

(720) 639-6930

Quality ratings

Measured by Centers for Medicare & Medicaid Services (CMS)

Overall rating Info The Overall CMS Rating combines results from health inspections, staffing levels and quality measures. Health inspections carry the most weight. Staffing and quality scores can increase or decrease the final rating based on performance compared to state and national standards.
▲ 32.7% Above NV avg. ▲ 32.7% Above NV avg.Click the badge to see the full State ranking.Click here to see the full State ranking.
Health Inspection Info Based on the results of the facility's three most recent standard inspections and any complaint investigations. CMS reviews the number, scope, and severity of deficiencies, with more recent findings weighted more heavily.
▲ 5.4% Above NV avg. ▲ 5.4% Above NV avg.Click the badge to see the full State ranking.Click here to see the full State ranking.
Staffing Info Measures average nursing staff hours per resident per day, including Registered Nurses (RNs) and total nursing staff. Ratings are adjusted based on the level of care residents require and are compared to state and national benchmarks.
▼ 35.7% Below NV avg. ▼ 35.7% Below NV avg.Click the badge to see the full State ranking.Click here to see the full State ranking.
Quality Measures Info Based on clinical and physical health indicators reported to CMS, such as hospital readmissions, falls, pressure ulcers, and improvements in mobility. These measures reflect how well residents' health needs are being managed.
▲ 37.9% Above NV avg. ▲ 37.9% Above NV avg.Click the badge to see the full State ranking.Click here to see the full State ranking.

Staffing hours breakdown

Info Daily nursing hours per resident by staff type, reported to CMS. Higher is generally better — compare this facility to state and national averages to see where staffing stands.

Hours per resident per day — compared to Nevada state averages

Total nursing care / resident Info This home is ranked 26th out of 33 homes in Nevada.

Total adjusted nursing hours per resident per day, combining RN, LPN, and aide time. CMS adjusts this for case-mix so facilities can be fairly compared.
3h 12m per day
Rank #26 / 33Nurse hours — State benchmarkedThis home is ranked 26th out of 33 homes in Nevada.Shows adjusted nurse hours per resident per day benchmarked to the Nevada average, with a ranking across 33 Nevada SNFs. More hours mean more direct care. The national average is about 3.5 hrs; below 3.0 is a red flag.Click the rank badge to see the full State ranking.Click here to see the full State ranking.
This facility Nevada avg (4h 2m per day)
vs Nevada avg
-21%

2 of 6 metrics below state avg

Standout metric Physical Therapist is +140% above state avg
Staff typeHours / Day / Residentvs state avg
Registered Nurse (RN) Info RNs hold the highest nursing license and can assess residents, interpret test results, and direct care plans. More RN hours per day often signals stronger clinical oversight and faster response to health changes. 53m per day ▼ 17% State avg: 1h 4m per day · National avg: 41m per day
LPN / LVN Info Licensed Practical Nurses (LPNs) or Licensed Vocational Nurses (LVNs) deliver routine hands-on care — medication administration, wound dressing, and monitoring vital signs. They work under RN supervision and make up a large share of daily bedside care. 1h 29m per day ▲ 65% State avg: 54m per day · National avg: 52m per day
Nurse Aide Info Certified Nurse Aides (CNAs) provide the most direct day-to-day assistance: bathing, dressing, feeding, and mobility. Nurse aide hours are typically the largest staffing category and directly affect residents' quality of life. 2h 21m per day ■ Avg State avg: 2h 23m per day · National avg: 2h 21m per day
Total Nursing (Weekend) Info Combined nursing hours (RN + LPN + Nurse Aide) per resident per day on weekends. Staffing often drops on weekends — this figure reveals whether the facility maintains adequate coverage outside of weekday hours. 3h 47m per day ■ Avg State avg: 3h 51m per day · National avg: 3h 26m per day
Physical Therapist Info Hours per resident per day provided by licensed Physical Therapists (PTs) or PT Assistants. PT services help residents recover mobility after injury or illness and are especially important for post-acute (short-stay) rehabilitation. 12m per day ▲ 140% State avg: 5m per day · National avg: 4m per day
RN (Weekend) Info Registered nurse hours specifically on weekends. Facilities sometimes reduce RN presence on Saturdays and Sundays — a low weekend RN figure compared to weekday hours can indicate reduced clinical oversight when most administrative staff are absent. 41m per day ▼ 20% State avg: 51m per day · National avg: 29m per day

Capacity and availability

This home is often near full

Occupancy higher than 95% suggests steady demand, but availability may be limited.

Higher occupancy than the Nevada average: 81.5%
Occupancy rate 97.5% Rank #5 / 35Occupancy rate — State benchmarkedThis home is ranked 5th out of 35 homes in Nevada.Shows this facility's occupancy rate versus the Nevada average, with its Statewide rank out of 35. Higher occupancy signals strong local demand and financial stability.Click the rank badge to see the full State ranking.Click here to see the full State ranking.
Avg. Length of Stay 24 days
Occupancy rate
97.5% Rank #5 / 35Occupancy rate — State benchmarkedThis home is ranked 5th out of 35 homes in Nevada.Shows this facility's occupancy rate versus the Nevada average, with its Statewide rank out of 35. Higher occupancy signals strong local demand and financial stability.Click the rank badge to see the full State ranking.Click here to see the full State ranking.
Avg. Length of Stay
24 days

Who this home usually serves

TYPE OF STAY

Primarily short stays

Residents typically stay for brief periods, with frequent admissions and discharges throughout the year.

Breakdown by payment type

Medicare

32% of new residents, usually for short-term rehab.

Typical stay 1 - 2 months

Private pay

67% of new residents, often for short stays.

Typical stay 20 days

Medicaid

1% of new residents, often for long-term daily care.

Typical stay 26 days

Finances and operations

Privately-owned community
Home revenue
$27.4M
Profit
$2.3M
Privately-owned community
Home revenue
$27.4M Rank #10 / 35Revenue — State benchmarkedThis home is ranked 10th out of 35 homes in Nevada.Shows this facility's annual revenue compared to the Nevada SNF average. Higher revenue generally means more resources for staffing and capital — read alongside Payroll %.Click the rank badge to see the full State ranking.Click here to see the full State ranking.
Profit
$2.3M
Payroll costs Info The portion of the home's budget spent on staff, including nurses, caregivers, and other employees who support care and operations. Rank #17 / 35Payroll — State benchmarkedThis home is ranked 17th out of 35 homes in Nevada.Shows total annual staff payroll benchmarked to the Nevada average. Higher payroll investment relative to peers often signals better staffing and less reliance on cheaper contract labor.Click the rank badge to see the full State ranking.Click here to see the full State ranking.
$9.3M
33.8% of revenue Rank #31 / 35Payroll % — State benchmarkedThis home is ranked 31st out of 35 homes in Nevada.Shows payroll as a percentage of revenue versus the Nevada average. Well-run Nevada SNFs typically land around 47–60% — the top third Statewide. Below 25% may signal understaffing or heavy agency use — read with Staffing ratings.Click the rank badge to see the full State ranking.Click here to see the full State ranking.
Other operating costs Info All remaining costs needed to run the home, such as food, utilities, building maintenance, supplies and administrative expenses.
$15.9M
Total costs $25.1M
Walk Score
Walk Score: 53 / 100 Rank #14 / 35Walk Score — State benchmarkedThis home is ranked 14th out of 35 homes in Nevada.Shows how walkable this facility's neighborhood is compared to the average Walk Score across Nevada SNFs. Higher scores benefit residents, families, and staff.Click the rank badge to see the full State ranking.Click here to see the full State ranking.
Moderately walkable. Some errands can be accomplished on foot, with a mix of nearby amenities.

Contact Trellis Centennial

Health Inspection History

Inspections Since 2023
Total health inspections 5

Nevada average 5.1


Last Health inspection on May 2025

Total health citations
25 Rank #6 / 35Health citations — State benchmarkedThis home is ranked 6th out of 35 homes in Nevada.Shows this facility's total health deficiency citations benchmarked to the Nevada State average, with a ranking across all 35 NV SNFs. Lower citation counts earn a better rank.Click the rank badge to see the full State ranking.Click here to see the full State ranking.

Nevada average 36.2

Citations per inspection
5 Rank #8 / 35Citations per inspection — State benchmarkedThis home is ranked 8th out of 35 homes in Nevada.Shows average deficiency citations per CMS inspection for this facility versus the Nevada mean across 35 SNFs with citation data. Lower is better.Click the rank badge to see the full State ranking.Click here to see the full State ranking.

Nevada average 7.08


Health citations are formal notices following inspections when they fail to comply with safety and care standards.

19 of 25 citations resulted from standard inspections; and 6 of 25 resulted from complaint investigations.

Breakdown of citation severity (last 3 years)
Critical Health citations
0
100% better than Nevada average

Nevada average: 0.1


Serious Health citations
2 Rank #7 / 13Serious citations (G–I) — State benchmarkedThis home is ranked 7th out of 13 homes in Nevada.Shows G–I scope serious health citations for this facility versus other Nevada SNFs. Lower counts rank better.Click the rank badge to see the full State ranking.Click here to see the full State ranking.
300% worse than Nevada average

Nevada average: 0.5

0 critical citations Nevada average: 0.1

2 serious citations Nevada average: 0.5

23 moderate citations Nevada average: 35

0 minor citations Nevada average: 0.5
Citations history (last 3 years)
Infection Control moderate citation May 09, 2025
Corrected

Quality of Care moderate citation May 09, 2025
Corrected

Quality of Care moderate citation May 09, 2025
Corrected

Quality of Care moderate citation May 09, 2025
Corrected

Financial Assistance for
Nursing Home in Nevada

Trellis Centennial is located in Las Vegas, Nevada.
Here are the financial assistance programs available to residents in Nevada.

Get Financial aid guidance

Home and Community Based Waiver

Nevada Medicaid HCBW

Age 65+ or disabled
General Nevada resident, Medicaid-eligible, nursing home-level care need.
Income Limits (2025) ~$2,829/month 300% FBR, individual
Asset Limits $2,000 (individual), $3,000 (couple).
NV

High urban demand (e.g., Las Vegas); rural challenges.

Benefits
Personal care (5-7 hours/day) Respite (240 hours/year) Home modifications ($1,500 avg.) Meals ($6/meal)

Nevada Senior Services Program

NV SSP

Age 60+
General Nevada resident, at risk of decline.
Income Limits ~$1,800/month individual, varies
Asset Limits $5,000 individual
NV

Limited funding; rural focus.

Benefits
In-home care (3-5 hours/week) Respite (up to 10 days/year) Transportation (~5 trips/month)

Personal Care Services (PCS)

Nevada Personal Care Services

Age 19+ (65+ for seniors focus)
General Nevada resident, Medicaid-eligible, needs help with 1+ ADL.
Income Limits (2025) ~$967/month (individual); spenddown allowed.
Asset Limits $2,000 (individual), $3,000 (couple).
NV

Self-directed (family can be paid); statewide via DHHS.

Benefits
Personal care (4-6 hours/day) Limited homemaker services Respite (~200 hours/year)

Senior Rx Program

Nevada Senior Rx Program

Age 65+
General Nevada resident, enrolled in Medicare Part D, income below limit.
Income Limits (2025) ~$2,510/month (individual), ~$3,380/month (couple).
Asset Limits Not assessed.
NV

Covers up to $38.75/month premium; funded by tobacco settlement.

Benefits
Prescription drug premium assistance (~$465/year) Reducing out-of-pocket costs

Medicare Savings Program (MSP)

Nevada Medicare Savings Program

Age 65+ or disabled
General Nevada resident, Medicare Part A/B.
Income Limits (2025) ~$2,510/month (QMB), ~$3,380/month (SLMB), ~$3,598/month (QI)—individual.
Asset Limits $9,430 (individual), $14,130 (couple).
NV

Three tiers; no waitlist; includes Extra Help for Part D.

Benefits
Covers Part B premiums ($174.70/month) Deductibles ($240/year) Copays (~20%)

Nevada Caregiver Support Program (via NFCSP)

Nevada Caregiver Support Program

Age
General Caregivers of 60+ needing care or 55+ caregivers of others; Nevada resident; functional needs (2+ ADLs).
Income Limits (2025) Prioritizes ~$24,980/year (individual); no strict cap.
Asset Limits Not assessed; need-based.
NV

5 AAAs; prioritizes rural, low-income caregivers.

Benefits
Respite (4-6 hours/week or 5 days/year) Adult day care ($60/day) Training Supplies (~$500/year)

VA Aid and Attendance (A&A) and Housebound Benefits

Nevada VA Aid and Attendance/Housebound

Age 65+ or disabled veteran/spouse
General Nevada resident, wartime service, need for ADL help (A&A) or homebound.
Income Limits (2025) Net income < ~$1,984/month (veteran with dependent, A&A); pension offsets income.
Asset Limits ~$155,356 net worth limit
NV

High veteran demand in urban/rural areas.

Benefits
Cash (~$1,433-$2,642/month veteran, ~$951-$1,318 spouse) for care costs (e.g., in-home, assisted living)

Places of interest near Trellis Centennial

Address 4.4 miles from city center Info Estimated distance in miles from Las Vegas's city center to Trellis Centennial's address, calculated via Google Maps. — 0.33 miles to nearest hospital (Intermountain Healthcare East Flamingo Endocrinology Clinic)

Calculate Travel Distance to Trellis Centennial

Add your location

Address

Staffing Data

Reporting period: April 1 – June 30, 2025 (Q2 2025). Source: CMS Payroll-Based Journal report.

Total staff 149
Employees 148
Contractors 1
Staff to resident ratio 2.26:1
44% better than Nevada average
Nevada average ratio: 1.57:1 Nevada average ratio: 1.57:1See full Nevada ranking
Avg staff/day 49
Average shift 8.8 hours
0% compared with Nevada average
Nevada average: 8.8 hours Nevada average shift: 8.8 hoursSee full Nevada ranking
Total staff hours (quarter) 39,461

Nursing staff breakdown

Q2 2025 · Apr 1 – Jun 30 More info This data comes from the CMS Payroll-Based Journal report covering April 1 – June 30, 2025.
Registered Nurse

Manages medical care and health needs.

Total count 33
Average shift length Info Average shift length. Calculated as total hours divided by days worked and average staff per day. 9.7 hours

No contractors work on this role.

Licensed Practical Nurse

Assists with medical care and medications.

Total count 25
Average shift length Info Average shift length. Calculated as total hours divided by days worked and average staff per day. 9.7 hours

No contractors work on this role.

Certified Nursing Assistant

Helps with daily care and mobility.

Total count 49
Average shift length Info Average shift length. Calculated as total hours divided by days worked and average staff per day. 9.9 hours

No contractors work on this role.

Contractor staffing

Q2 2025 · Apr 1 – Jun 30 More info This data comes from the CMS Payroll-Based Journal report covering April 1 – June 30, 2025.

Total hours from contractors

0.4%

156 contractor hours this quarter

Medical Director: 1

Staff by category

Q2 2025 · Apr 1 – Jun 30 More info This data comes from the CMS Payroll-Based Journal report covering April 1 – June 30, 2025.
Certified Nursing Assistant4904913,11491100%9.9
Registered Nurse330337,99591100%9.7
Licensed Practical Nurse250256,64291100%9.7
Physical Therapy Aide100102,9438998%7.5
Speech Language Pathologist7072,11791100%8
Respiratory Therapy Technician5051,3267785%8.7
Physical Therapy Assistant5051,3018897%7.8
Other Dietary Services Staff4041,1898695%7.2
Clinical Nurse Specialist2027688391%5.8
Occupational Therapy Aide2027098492%5.2
Dental Services Staff1015126470%8
Qualified Social Worker4044336571%5.7
Administrator1012566470%4
Medical Director0111563943%4
49 Certified Nursing Assistant
% of Days 100%
33 Registered Nurse
% of Days 100%
25 Licensed Practical Nurse
% of Days 100%
10 Physical Therapy Aide
% of Days 98%
7 Speech Language Pathologist
% of Days 100%
5 Respiratory Therapy Technician
% of Days 85%
5 Physical Therapy Assistant
% of Days 97%
4 Other Dietary Services Staff
% of Days 95%
2 Clinical Nurse Specialist
% of Days 91%
2 Occupational Therapy Aide
% of Days 92%
1 Dental Services Staff
% of Days 70%
4 Qualified Social Worker
% of Days 71%
1 Administrator
% of Days 70%
1 Medical Director
% of Days 43%

Facility Characteristics

Source: CMS Long-Term Care Facility Characteristics (Data as of Jan 2026)

Total residents 66
Medicare
48
72.7% of residents
Private pay or other
18
27.3% of residents

Quality of care over time

These measures show how residents usually do over time at this home, based on health outcomes and preventive care.

Short-stay resident measures
Significantly above average Nevada avg: 3.1 Info CMS star rating based on short-stay quality measure performance. 5 stars = much above average, 1 star = much below average.
Pneumococcal Vaccine Info Percent of short-stay residents assessed and appropriately given the pneumococcal vaccine 99.2%
18% better than Nevada average

Nevada average: 83.9%

Antipsychotic medication increase Info Percent of short-stay residents who newly received an antipsychotic medication 1.0%
49% better than Nevada average

Nevada average: 2.0%

Influenza Vaccine Info Percent of short-stay residents assessed and appropriately given the seasonal influenza vaccine 91.7%
14% better than Nevada average

Nevada average: 80.7%

Re-hospitalized after SNF stay Info Percentage of short-stay residents who were re-hospitalized after their nursing home admission. 18.4%
21% better than Nevada average

Nevada average: 23.4%

Emergency department visits Info Percentage of short-stay residents who had an outpatient emergency department visit. 6.0%
39% better than Nevada average

Nevada average: 9.8%

Falls with major injury Info Percentage of SNF residents who experience falls with major injury during their stay. 0.3%
66% better than Nevada average

Nevada average: 0.8%

Ability to care for self at discharge Info Percentage of residents at or above expected ability to care for themselves at discharge. 70.1%
31% better than Nevada average

Nevada average: 53.7%

Successful return to home or community Info Rate of successful return to home or community from a skilled nursing facility. 51.3%
In line with Nevada average

Nevada average: 50.6%

Penalties and fines

Federal penalties imposed by CMS for regulatory violations, including civil money penalties (fines) and denials of payment for new Medicare/Medicaid admissions.

Source: CMS Penalties Database (Data as of Jan 2026)

Total fines amount $8K Rank #23 / 35Federal fines — State benchmarkedThis home is ranked 23rd out of 35 homes in Nevada.Shows this facility's cumulative CMS federal fine dollars versus the Nevada average among facilities with fines, and where it ranks among 35 skilled nursing facilities in the pool. Lower total dollars mean a better rank.Click the rank badge to see the full State ranking.Click here to see the full State ranking.
76% lower than Nevada average

Nevada average: $34K

Number of fines 1
29% fewer fines than Nevada average

Nevada average: 1.4

Payment Denials Info Serious action where Medicare and/or Medicaid temporarily stops payments for new residents until issues are fixed. 0
100% fewer payment denials than Nevada average

Nevada average: 0.1

Fines amount comparison
This facility $8K
Nevada average $34K
Penalty History

Penalties are imposed by CMS for violations of federal nursing home regulations.

1 penalty in the past 3 years

May 9, 2025 · $8K

Civil Money Penalty Info Fines imposed for noncompliance, which can be assessed per day or per instance of violation. May 9, 2025
$8K

Last updated: Jan 2026

Compare Nursing Home around Las Vegas

The information below is reported by the Nevada Department of Health and Human Services, Bureau of Health Care Quality and Compliance.

4 facilities compared · CMS & NV Dept. of Health data

Filter by care type
Desert View Senior Living
NH

Nursing Home Licensed facility providing 24/7 skilled nursing care for residents with complex, ongoing medical needs. Staffed by RNs, LPNs, and CNAs. Inspected and star-rated annually by CMS. Accepts Medicare (short-term rehab) and Medicaid (long-term care).

AL

Assisted Living A licensed, long-term care setting for seniors or individuals with disabilities who need help with daily activities — like bathing, dressing, and medication management — but not 24-hour skilled nursing. Offers housing, meals, and around-the-clock support while aiming to maximize resident independence.

Las Vegas (Lone Mountain)123 103.5% +27%4.66 +120%+16%$0206.7-23 31 ----295091
Advanced Health Care of Las Vegas
NH

Nursing Home Licensed facility providing 24/7 skilled nursing care for residents with complex, ongoing medical needs. Staffed by RNs, LPNs, and CNAs. Inspected and star-rated annually by CMS. Accepts Medicare (short-term rehab) and Medicaid (long-term care).

AL

Assisted Living A licensed, long-term care setting for seniors or individuals with disabilities who need help with daily activities — like bathing, dressing, and medication management — but not 24-hour skilled nursing. Offers housing, meals, and around-the-clock support while aiming to maximize resident independence.

Las Vegas38 94.3% +16%3.63 +72%-10%$0113.7-37 23 Joseph Walker$12.0M$4.8M40%295090
Trellis Centennial
NH

Nursing Home Licensed facility providing 24/7 skilled nursing care for residents with complex, ongoing medical needs. Staffed by RNs, LPNs, and CNAs. Inspected and star-rated annually by CMS. Accepts Medicare (short-term rehab) and Medicaid (long-term care).

AL

Assisted Living A licensed, long-term care setting for seniors or individuals with disabilities who need help with daily activities — like bathing, dressing, and medication management — but not 24-hour skilled nursing. Offers housing, meals, and around-the-clock support while aiming to maximize resident independence.

Las Vegas (Paradise)72 97.5% +20%3.21 +55%-21%$8.3k255.0269 53 Shivani Chopra$27.4M$9.3M33.8%295106
Charleston Post Acute
NH

Nursing Home Licensed facility providing 24/7 skilled nursing care for residents with complex, ongoing medical needs. Staffed by RNs, LPNs, and CNAs. Inspected and star-rated annually by CMS. Accepts Medicare (short-term rehab) and Medicaid (long-term care).

AL

Assisted Living A licensed, long-term care setting for seniors or individuals with disabilities who need help with daily activities — like bathing, dressing, and medication management — but not 24-hour skilled nursing. Offers housing, meals, and around-the-clock support while aiming to maximize resident independence.

Las Vegas148 93.1% +14%3.71 -42%-8%$69.3k395.62140 71 -$24.8M$10.6M42.8%295072

Guides for Better Senior Living

Care Cost Calculator: See Prices in Your Area

Nursing Home Data Explorer

Don’t Wait Too Long: 7 Red Flag Signs Your Parent Needs Assisted Living Now

The True Cost of Assisted Living in 2025 – And How Families Are Paying For It

Understanding Senior Living Costs: Pricing Models, Discounts & Financial Assistance

Frequently Asked Questions about Trellis Centennial

What neighborhood is Trellis Centennial in?

Trellis Centennial is in the Paradise neighborhood.

Is Trellis Centennial in a walkable area?

Trellis Centennial has a walk score of 53. Moderately walkable. Some errands can be accomplished on foot, with a mix of nearby amenities.

What is the occupancy rate at Trellis Centennial?

Trellis Centennial's occupancy is 97.5%.

What is the phone number of Trellis Centennial?

(720) 639-6930 will put you in contact with the team at Trellis Centennial.

Is Trellis Centennial Medicare or Medicaid certified?

Yes — Trellis Centennial is a CMS-certified provider of Medicare and Medicaid.

Explore Open Rooms
1 Contact details
2 What type of senior care service are you looking for?
3 What budget do you have in mind for senior care?
4 How soon do you need to find care?
5 Additional details

Thank you for your interest!

Our team will be in touch shortly to help with next steps.