Trinity Elms
Nursing Home · Clemmons, NC
CMS overall rating Info The Overall CMS Rating is scored from 1 to 5 stars and combines results from health inspections, staffing levels, and quality measures. Health inspections carry the most weight. Staffing and quality scores can increase or decrease the final rating based on performance compared to state and national standards.

Trinity Elms

Nursing Home · Clemmons, NC
CMS overall rating Info The Overall CMS Rating is scored from 1 to 5 stars and combines results from health inspections, staffing levels, and quality measures. Health inspections carry the most weight. Staffing and quality scores can increase or decrease the final rating based on performance compared to state and national standards.
Calculator: See prices in your area
Trinity Elms accepts Medicare, Medicaid, and private pay.

Overview of Trinity Elms

Trinity Elms is a vibrant Continuum of Care Retirement Community (CCRC) located in Clemmons, North Carolina. It offers a warm and welcoming environment designed to support residents at every stage of life, providing compassionate care and enriching experiences. The community is part of Lutheran Services Carolinas, which serves the aging population.

Quality ratings

Measured by Centers for Medicare & Medicaid Services (CMS)

Overall rating Info The Overall CMS Rating combines results from health inspections, staffing levels and quality measures. Health inspections carry the most weight. Staffing and quality scores can increase or decrease the final rating based on performance compared to state and national standards.
▼ 32.7% Below NC avg. ▼ 32.7% Below NC avg.Click the badge to see the full State ranking.Click here to see the full State ranking.
Health Inspection Info Based on the results of the facility's three most recent standard inspections and any complaint investigations. CMS reviews the number, scope, and severity of deficiencies, with more recent findings weighted more heavily.
▼ 11.8% Below NC avg. ▼ 11.8% Below NC avg.Click the badge to see the full State ranking.Click here to see the full State ranking.
Staffing Info Measures average nursing staff hours per resident per day, including Registered Nurses (RNs) and total nursing staff. Ratings are adjusted based on the level of care residents require and are compared to state and national benchmarks.
▼ 9.6% Below NC avg. ▼ 9.6% Below NC avg.Click the badge to see the full State ranking.Click here to see the full State ranking.
Quality Measures Info Based on clinical and physical health indicators reported to CMS, such as hospital readmissions, falls, pressure ulcers, and improvements in mobility. These measures reflect how well residents' health needs are being managed.
▼ 71.9% Below NC avg. ▼ 71.9% Below NC avg.Click the badge to see the full State ranking.Click here to see the full State ranking.

Staffing hours breakdown

Info Daily nursing hours per resident by staff type, reported to CMS. Higher is generally better — compare this facility to state and national averages to see where staffing stands.

Hours per resident per day — compared to North Carolina state averages

Total nursing care / resident Info This home is ranked 36th out of 90 homes in North Carolina. Total adjusted nursing hours per resident per day, combining RN, LPN, and aide time. CMS adjusts this for case-mix so facilities can be fairly compared.
4h 6m per day
Rank #36 / 90Nurse hours — State benchmarkedThis home is ranked 36th out of 90 homes in North Carolina. Shows adjusted nurse hours per resident per day benchmarked to the North Carolina average, with a ranking across 90 North Carolina SNFs. More hours mean more direct care. The national average is about 3.5 hrs; below 3.0 is a red flag.Click the rank badge to see the full State ranking.Click here to see the full State ranking.
This facility North Carolina avg (4h 55m per day)
vs North Carolina avg
-17%

2 of 6 metrics below state avg

Standout metric Weekend RN is +39% above state avg
Staff typeHours / Day / Residentvs state avg
Registered Nurse (RN) Info RNs hold the highest nursing license and can assess residents, interpret test results, and direct care plans. More RN hours per day often signals stronger clinical oversight and faster response to health changes. 38m per day ▲ 9% State avg: 35m per day · National avg: 41m per day
LPN / LVN Info Licensed Practical Nurses (LPNs) or Licensed Vocational Nurses (LVNs) deliver routine hands-on care — medication administration, wound dressing, and monitoring vital signs. They work under RN supervision and make up a large share of daily bedside care. 48m per day ▼ 8% State avg: 52m per day · National avg: 52m per day
Nurse Aide Info Certified Nurse Aides (CNAs) provide the most direct day-to-day assistance: bathing, dressing, feeding, and mobility. Nurse aide hours are typically the largest staffing category and directly affect residents' quality of life. 2h 51m per day ▲ 22% State avg: 2h 20m per day · National avg: 2h 20m per day
Weekend Total Nursing Info Combined nursing hours (RN + LPN + Nurse Aide) per resident per day on weekends. Staffing often drops on weekends — this figure reveals whether the facility maintains adequate coverage outside of weekday hours. 3h 35m per day ▲ 7% State avg: 3h 20m per day · National avg: 3h 26m per day
Physical Therapist Info Hours per resident per day provided by licensed Physical Therapists (PTs) or PT Assistants. PT services help residents recover mobility after injury or illness and are especially important for post-acute (short-stay) rehabilitation. 4m per day ▼ 20% State avg: 5m per day · National avg: 4m per day
Weekend RN Info Registered nurse hours specifically on weekends. Facilities sometimes reduce RN presence on Saturdays and Sundays — a low weekend RN figure compared to weekday hours can indicate reduced clinical oversight when most administrative staff are absent. 32m per day ▲ 39% State avg: 23m per day · National avg: 28m per day

Capacity and availability

Avg. Length of Stay
113 days
Bed community size
104-bed community Rank #87 / 397Bed count — State benchmarkedThis home is ranked 87th out of 397 homes in North Carolina. Shows this facility's certified or reported bed count compared to other North Carolina SNFs. Larger communities may offer more amenities, programs, and on-site services for residents and families.Click the rank badge to see the full State ranking.Click here to see the full State ranking.
A larger shared setting that may offer more common spaces and organized community services.
Walk Score
Walk Score: 56 / 100 Rank #105 / 572Walk Score — State benchmarkedThis home is ranked 105th out of 572 homes in North Carolina. Shows how walkable this facility's neighborhood is compared to the average Walk Score across North Carolina SNFs. Higher scores benefit residents, families, and staff.Click the rank badge to see the full State ranking.Click here to see the full State ranking.
Moderately walkable. Some errands can be accomplished on foot, with a mix of nearby amenities.

About this community

Occupancy

Occupancy rate
82%
Rank #92 / 264Occupancy rate — State benchmarkedThis home is ranked 92nd out of 264 homes in North Carolina. Shows this facility's occupancy rate versus the North Carolina average, with its Statewide rank out of 264. Higher occupancy signals strong local demand and financial stability.Click the rank badge to see the full State ranking.Click here to see the full State ranking.
Higher than the North Carolina average: 76.4%
Occupied beds
85 / 104
Average residents per home in North Carolina 85 per day

License Details

StatusActive
CountyForsyth
License NumberHAL-034-085
CMS Certification Number345565

Therapy & Rehabilitation

3 services
Rehabilitation Services
Respite Care
Short-Term Rehab

Additional Services

1 service
Health & Rehab

Contact Trinity Elms

Inspection History

In North Carolina, the Department of Health and Human Services, Division of Health Service Regulation conducts unannounced surveys to ensure nursing and adult care homes meet safety standards.

Since 2016 · 10 years of data 56 deficiencies 16 inspections 0 penalties 14 inspections with deficiencies

Inspection Scorecard Info This scorecard compares key inspection, citation, and complaint metrics at this facility against the North Carolina state average. Metrics rated ≥15% worse than average are highlighted in red; those ≥15% better are highlighted in green.

Since 2016 vs. North Carolina state average
Overall vs. NC average 3 Worse Metrics worse than North Carolina average:
• Total deficiencies (22% above)
• Deficiencies per year (22% above)
• Deficiencies per inspection (59% above)
3 Better Metrics better than North Carolina average:
• Total inspections (24% below)
• Inspections with deficiencies (26% below)
• Inspection deficiency rate (2% below)
Latest Inspection April 30, 2025 Complaint Investigation

Deficiencies Info Deficiencies are formal regulatory issues recorded during state inspections.

This FacilityNC Averagevs. NC Avg
Total deficiencies Info Formal regulatory issues recorded by inspectors across all inspection types. 5646 This facility has 22% more total deficiencies than a typical North Carolina nursing home (56 vs. NC avg 46).↑ 22% worse
Deficiencies per year Info Average deficiencies per year since 2016. 5.64.6 This facility has 22% more deficiencies per year than a typical North Carolina nursing home (5.6 vs. NC avg 4.6).↑ 22% worse
Deficiencies per inspection Info Average deficiencies per inspection. 3.52.2 This facility has 59% more deficiencies per inspection than a typical North Carolina nursing home (3.5 vs. NC avg 2.2).↑ 59% worse

Inspections Info State inspections evaluate whether the facility meets health and safety standards.

This FacilityNC Averagevs. NC Avg
Total inspections Info Combined count of all routine and focused inspections. Excludes complaint investigations. 1621 This facility has 24% fewer total inspections than a typical North Carolina nursing home (16 vs. NC avg 21).↓ 24% better
Inspections with deficiencies Info Inspections that resulted in at least one regulatory deficiency. 1419 This facility has 26% fewer inspections with deficiencies than a typical North Carolina nursing home (14 vs. NC avg 19).↓ 26% better
Inspection deficiency rate Info Percentage of inspections that resulted in at least one deficiency. 88%90% This facility has 2 percentage points lower inspection deficiency rate than a typical North Carolina nursing home (88% vs. NC avg 90%).↓ 2% better

Inspection Reports Summary Info An editor-reviewed summary of the themes and findings across this facility's recent inspection reports.

The most recent inspection on April 30, 2025 identified a deficiency related to a medication error where a resident received another resident’s medications, resulting in hospital evaluation as a precaution but no adverse effects. Earlier inspections showed a pattern of medication management issues, supervision concerns, and documentation discrepancies, including prior findings of medication administration errors, failure to observe residents taking medications, and inaccurate staffing data. Complaint investigations substantiated failures in timely reporting of abuse allegations and inadequate supervision leading to resident injuries, but no fines, immediate jeopardy findings, or license actions were listed in the available reports. The facility also had recurring deficiencies related to building maintenance and safety systems in prior years, though some construction-related issues were corrected over time. Recent inspections suggest ongoing challenges with medication safety and resident supervision, with no clear overall improvement trend.

Read the full inspection reports for this facility, including detailed findings and corrective actions.

Show Inspection Reports

Performance summary

Key indicators of commitment to quality care and safety.

Ratings

Overall Rating
3 / 5

Based on the North Carolina Department of Health and Human Services, Division of Health Service Regulation surveys measuring health inspections, staffing, and quality measures.

Ranked 106th (tied) of 138 homes in North Carolina See full North Carolina ranking

Penalties and fines

Federal penalties imposed by CMS for regulatory violations, including civil money penalties (fines) and denials of payment for new Medicare/Medicaid admissions.

Source: CMS Penalties Database

No penalties in the past 3 years

No civil money penalties or payment denials were reported in the last 3 years.

Quality of care over time

These measures show how residents usually do over time at this home, based on health outcomes and preventive care.

Long-stay resident measures
Significantly below average North Carolina avg: 2.9 Info CMS star rating based on long-stay quality measure performance. 5 stars = significantly above average, 1 star = significantly below average.
Hospitalizations per 1,000 days Info Number of hospitalizations per 1,000 long-stay resident days. 0.99
44% better than North Carolina average

North Carolina average: 1.77
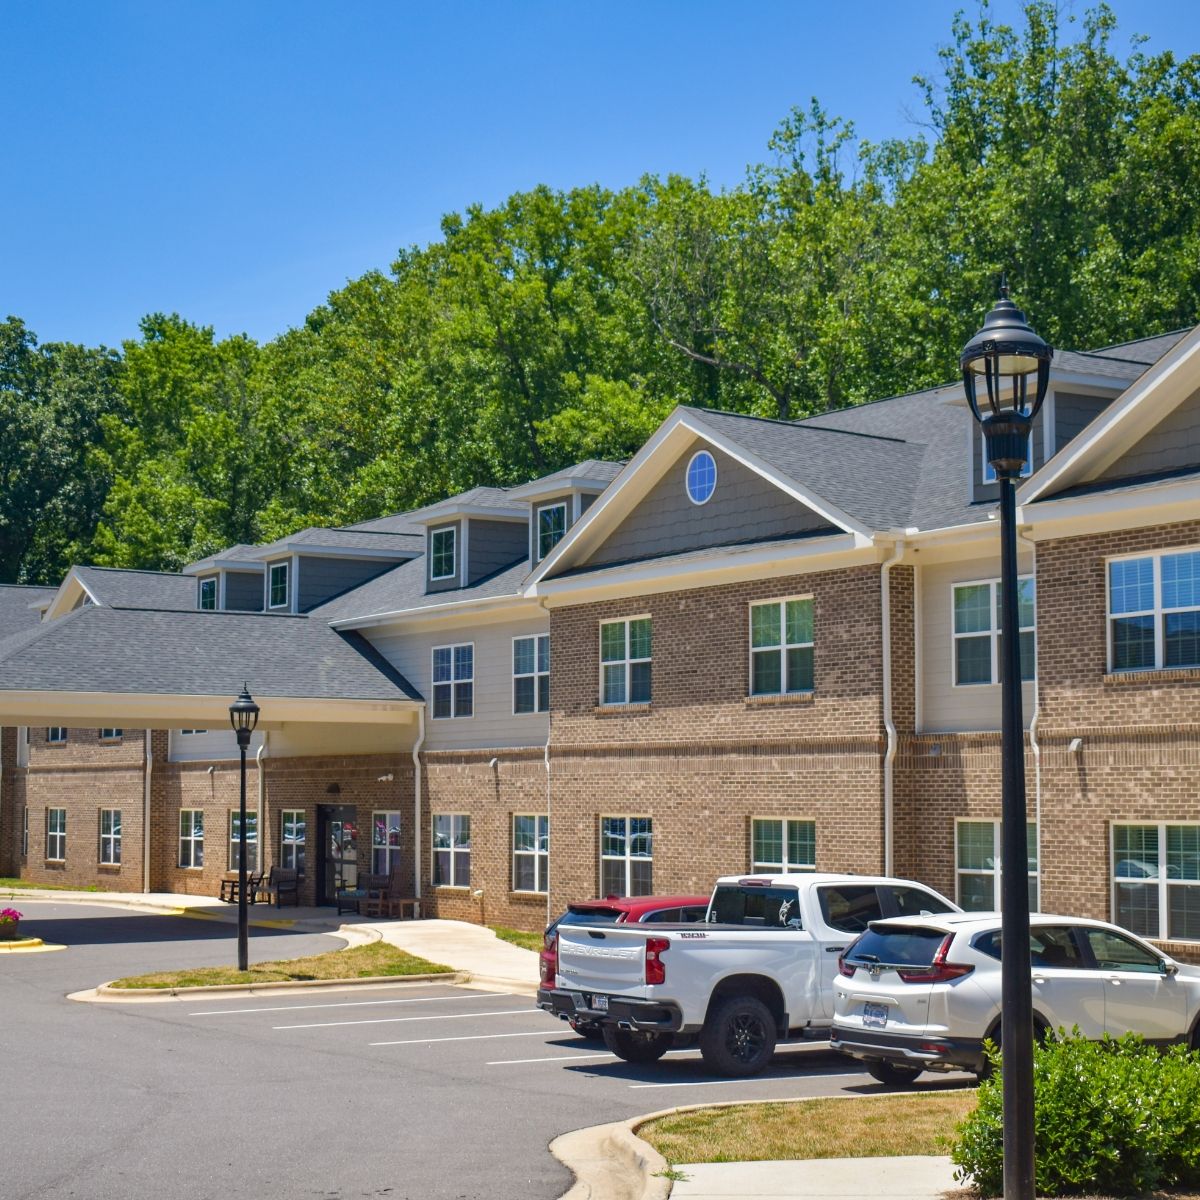
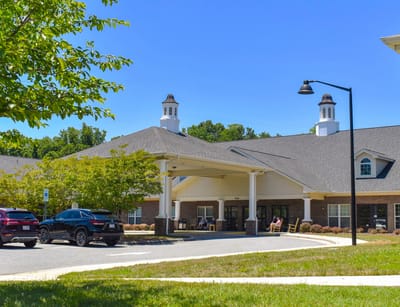
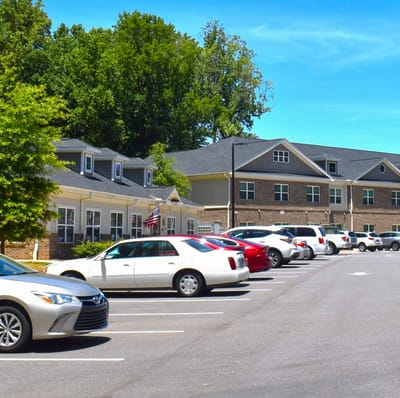
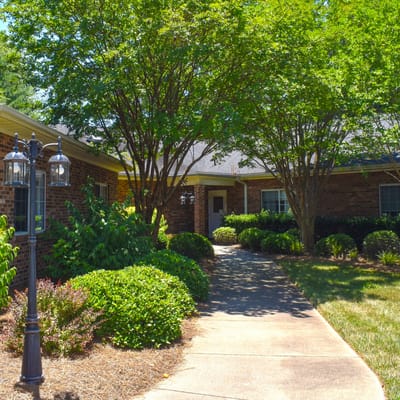
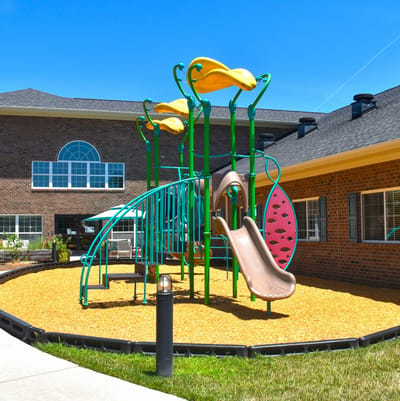
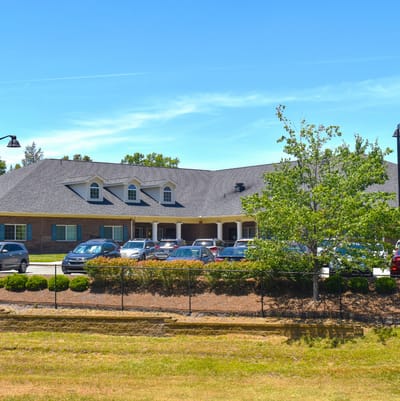
ED visits per 1,000 days Info Number of outpatient emergency department visits per 1,000 long-stay resident days. 1.95
7% worse than North Carolina average

North Carolina average: 1.82

Short-stay resident measures
Significantly below average North Carolina avg: 2.9 Info CMS star rating based on short-stay quality measure performance. 5 stars = much above average, 1 star = much below average.
Re-hospitalized after SNF stay Info Percentage of short-stay residents who were re-hospitalized after their nursing home admission. 31.9%
39% worse than North Carolina average

North Carolina average: 22.9%

Emergency department visits Info Percentage of short-stay residents who had an outpatient emergency department visit. 21.8%
65% worse than North Carolina average

North Carolina average: 13.2%

Falls with major injury Info Percentage of SNF residents who experience falls with major injury during their stay. 0.9%
14% worse than North Carolina average

North Carolina average: 0.8%

Ability to care for self at discharge Info Percentage of residents at or above expected ability to care for themselves at discharge. 50.6%
6% worse than North Carolina average

North Carolina average: 53.7%

Successful return to home or community Info Rate of successful return to home or community from a skilled nursing facility. 46.8%
7% worse than North Carolina average

North Carolina average: 50.6%

Who this home usually serves

TYPE OF STAY

Mix of rehab and long-term care

This home supports both short-term rehab and long-term care, with residents staying for a wide range of durations.

Places of interest near Trinity Elms

Address 0.0 miles from city center Info Estimated distance in miles from Clemmons's city center to Trinity Elms's address, calculated via Google Maps.

Calculate Travel Distance to Trinity Elms

Add your location

Address

Financial Assistance for
Nursing Home in North Carolina

Trinity Elms is located in Clemmons, North Carolina.
Here are the financial assistance programs available to residents in North Carolina.

Get Financial aid guidance

Community Alternatives Program for Disabled Adults

NC Medicaid CAP/DA

Age 65+ or disabled
General North Carolina resident, Medicaid- eligible, nursing home-level care need.
Income Limits (2025) ~$2,829/month 300% FBR, individual
Asset Limits $2,000 (individual), $3,000 (couple).
NC

High demand; waitlists common in urban areas.

Benefits
Personal care (5-7 hours/day) Respite (240 hours/year) Adult day care ($60/day) Home modifications ($1,500 avg.)

North Carolina Senior Care Options

NC SCO (via NFCSP)

Age Caregiver of someone 60+ (or with dementia)
General North Carolina resident.
Income Limits No strict limit; prioritizes low-income.
Asset Limits Not applicable.
NC

Limited slots; rural/urban balance.

Benefits
In-home respite (4-6 hours/day) Adult day care (~$60/day) Short-term facility care (up to 5 days)

Program of All-Inclusive Care for the Elderly (PACE)

North Carolina PACE (e.g., PACE of the Triad)

Age 55+
General NC resident (specific counties), NFLOC, safe with PACE support.
Income Limits (2025) ~$2,829/month (Medicaid-eligible); private pay option available.
Asset Limits $2,000 (individual), $3,000 (couple) for Medicaid enrollees.
NC

Available in 10+ counties (e.g., Guilford, Wake); multiple providers (e.g., PACE of the Southern Piedmont).

Benefits
Personal care (5-7 hours/day) Medical care Meals Transportation Respite Therapies

In-Home Aide Services

North Carolina In-Home Aide Services

Age 60+
General NC resident, unable to perform 1+ ADL, at risk of nursing home placement.
Income Limits (2025) No strict cap; prioritizes low-income ~$24,980/year
Asset Limits Not assessed; need-based.
NC

Family can be aides; varies by county funding.

Benefits
Personal care (5-20 hours/week) Meal prep Respite (~5 days/year) Errands

Medicare Savings Program (MSP)

North Carolina Medicare Savings Program

Age 65+ or disabled
General NC resident, Medicare Part A/B.
Income Limits (2025) ~$2,510/month (QMB), ~$3,380/month (SLMB), ~$3,598/month (QI)—individual.
Asset Limits $9,430 (individual), $14,130 (couple).
NC

Three tiers; no waitlist; includes Extra Help for Part D.

Benefits
Covers Part B premiums ($174.70/month) Deductibles ($240/year) Copays (~20%)

VA Aid and Attendance (A&A) and Housebound Benefits

North Carolina VA Aid and Attendance/Housebound

Age 65+ or disabled veteran/spouse
General NC resident, wartime service, need for ADL help (A&A) or homebound.
Income Limits (2025) Net income < ~$1,984/month (veteran with dependent, A&A); pension offsets income.
Asset Limits ~$155,356 net worth limit
NC

High veteran demand in rural/urban areas.

Benefits
Cash (~$1,433-$2,642/month veteran, ~$951-$1,318 spouse) for care costs (e.g., in-home, assisted living)

Urgent Repair Program (URP)

North Carolina Urgent Repair Program

Age 60+ prioritized
General NC resident, homeowner, low-income.
Income Limits (2025) ~$30,258/year 50% AMI, varies by county
Asset Limits Not strictly assessed; home value considered.
NC

Forgivable at $2,000/year; statewide via local partners.

Benefits
Repairs (~$8,000-$12,000 avg.) for safety (e.g., roofs, heating, accessibility)

State/County Special Assistance (SA)

North Carolina Special Assistance

Age 65+ (or disabled)
General NC resident, in licensed adult care home, low-income.
Income Limits (2025) ~$1,255/month (individual, 100% FPL); varies by facility rate.
Asset Limits $2,000 individual
NC

Covers assisted living; counties supplement state funds.

Benefits
Cash (~$1,200-$1,500/month) for room/board; Medicaid covers care services

Compare Nursing Home around Clemmons

The information below is reported by the North Carolina Department of Health and Human Services, Division of Health Service Regulation.

2 facilities compared · CMS & NC Dept. of Health data

Filter by care type
Trinity Elms Health and Rehab
NH

Nursing Home Licensed facility providing 24/7 skilled nursing care for residents with complex, ongoing medical needs. Staffed by RNs, LPNs, and CNAs. Inspected and star-rated annually by CMS. Accepts Medicare (short-term rehab) and Medicaid (long-term care).

AL

Assisted Living A licensed, long-term care setting for seniors or individuals with disabilities who need help with daily activities — like bathing, dressing, and medication management — but not 24-hour skilled nursing. Offers housing, meals, and around-the-clock support while aiming to maximize resident independence.

IL

Independent Living Lifestyle-focused communities for older adults offering dining, activities, and transportation with minimal personal care. Best for active, independent seniors who want community without medical support.

N

Nursing

Clemmons (Fair Oaks Drive)100 81.7% +7%4.09 +14%+3%$15.6k112.2290 26 -$16.2M$6.7M41.3%345565
Cedar Hills Center for Nursing and Rehabilitation
NH

Nursing Home Licensed facility providing 24/7 skilled nursing care for residents with complex, ongoing medical needs. Staffed by RNs, LPNs, and CNAs. Inspected and star-rated annually by CMS. Accepts Medicare (short-term rehab) and Medicaid (long-term care).

AL

Assisted Living A licensed, long-term care setting for seniors or individuals with disabilities who need help with daily activities — like bathing, dressing, and medication management — but not 24-hour skilled nursing. Offers housing, meals, and around-the-clock support while aiming to maximize resident independence.

N

Nursing

Clemmons (Meadowbrook)94 85.5% +12%3.62 -76%-9%$70.3k459.0281 28 Accordius Health At Clemmons, LLC$10.2M$5.9M58.2%345131

Frequently Asked Questions about Trinity Elms

Is Trinity Elms in a walkable area?

Trinity Elms has a walk score of 56. Moderately walkable. Some errands can be accomplished on foot, with a mix of nearby amenities.

What is the license number of Trinity Elms?

According to NC state health department records, Trinity Elms's license number is HAL-034-085.

What is the occupancy rate at Trinity Elms?

Trinity Elms's occupancy is 82%.

What is the overall rating for Trinity Elms?

Trinity Elms received a 3-star overall rating from the CMS (Centers for Medicare and Medicaid Services). This score combines results from staffing levels, quality measures, and health inspections.

How many beds does Trinity Elms have?

Trinity Elms has 104 beds.

Are there photos of Trinity Elms?

Yes — there are 16 photos of Trinity Elms in the photo gallery on this page.

What is the address of Trinity Elms?

Trinity Elms is located at 3750 Harper Road Clemmons, NC 27012.

Guides for Better Senior Living

Care Cost Calculator: See Prices in Your Area

Nursing Home Data Explorer

Don’t Wait Too Long: 7 Red Flag Signs Your Parent Needs Assisted Living Now

The True Cost of Assisted Living in 2025 – And How Families Are Paying For It

Understanding Senior Living Costs: Pricing Models, Discounts & Financial Assistance

Explore Open Rooms
1 Contact details
2 What type of senior care service are you looking for?
3 What budget do you have in mind for senior care?
4 How soon do you need to find care?
5 Additional details

Thank you for your interest!

Our team will be in touch shortly to help with next steps.