Trinity Woods
Nursing Home, Assisted Living, Independent Living & Memory Care · Tulsa, OK
CMS overall rating Info CMS (the Centers for Medicare & Medicaid Services) is the federal agency that rates nursing home quality. Its Overall Rating runs from 1 to 5 stars, combining health inspections, staffing, and quality measures, with inspections weighted most heavily.

Trinity Woods

Nursing Home, Assisted Living, Independent Living & Memory Care · Tulsa, OK
CMS overall rating Info CMS (the Centers for Medicare & Medicaid Services) is the federal agency that rates nursing home quality. Its Overall Rating runs from 1 to 5 stars, combining health inspections, staffing, and quality measures, with inspections weighted most heavily.
Calculator: See prices in your area
Trinity Woods accepts Medicare, Medicaid, and private pay.

Overview of Trinity Woods

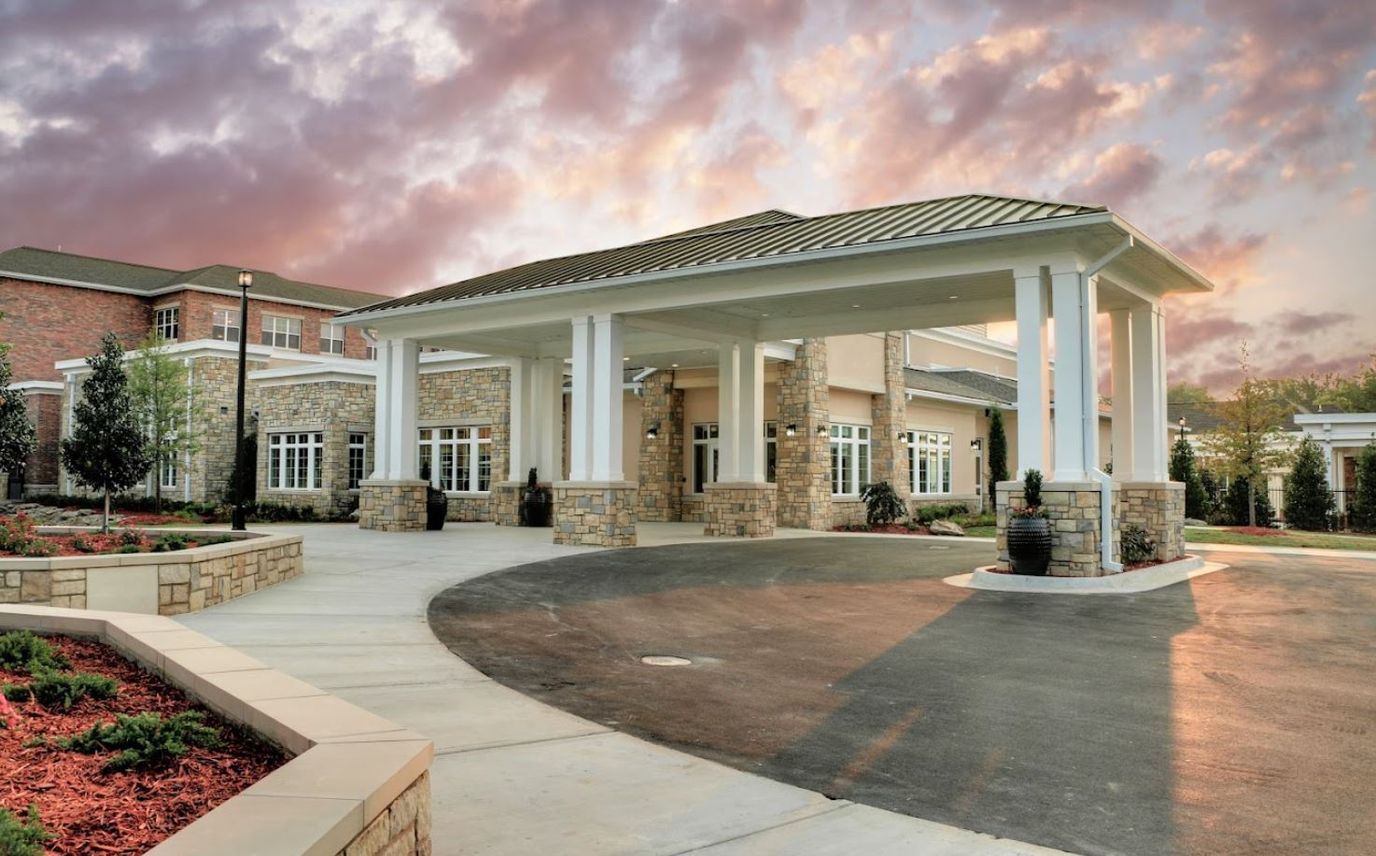
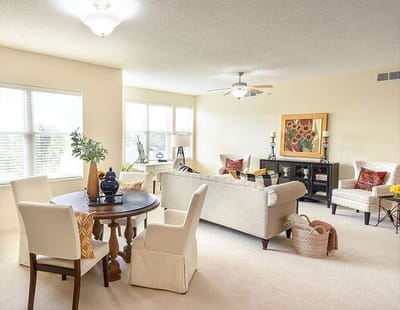
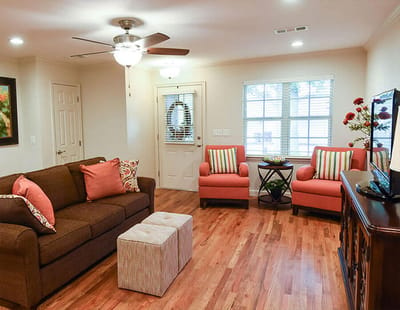
Nestled in the picturesque city of Tulsa, OK, Trinity Woods is a trusted continuum-of-care retirement community that provides assisted living, residential living, and nursing care services. Featuring a wide array of bright and spacious accommodations, seniors can rest assured to experience comfort and safety at its finest. The community takes pride in a team of respectful and highly skilled professionals delivering top-notch care and support for residents to optimize their freedom and enjoy their individuality.

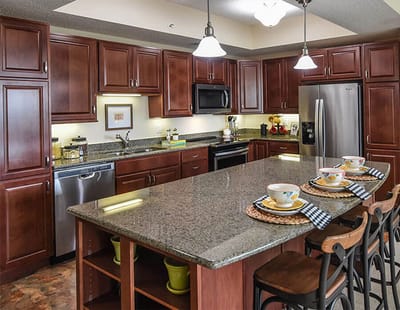
Cherish unforgettable moments with friends and join fun programs to experience an active and happy lifestyle. Moreover, the community goes above and beyond to ensure seniors’ well-being by serving them healthy and tasty meals for dietary satisfaction. Trinity Woods strives to provide a safe place for seniors to live a wonderful retirement with their ever-changing needs tended to and cared for.

Quality ratings

Measured by Centers for Medicare & Medicaid Services (CMS)

Overall rating Info The Overall CMS Rating combines results from health inspections, staffing levels and quality measures. Health inspections carry the most weight. Staffing and quality scores can increase or decrease the final rating based on performance compared to state and national standards.
▲ 90.3% Above OK avg. ▲ 90.3% Above OK avg.OK average: 2.6Click the badge to see the full State ranking.Click here to see the full State ranking.
Health Inspection Info Based on the results of the facility's three most recent standard inspections and any complaint investigations. CMS reviews the number, scope, and severity of deficiencies, with more recent findings weighted more heavily.
▲ 80.8% Above OK avg. ▲ 80.8% Above OK avg.OK average: 2.8Click the badge to see the full State ranking.Click here to see the full State ranking.
Staffing Info Measures average nursing staff hours per resident per day, including Registered Nurses (RNs) and total nursing staff. Ratings are adjusted based on the level of care residents require and are compared to state and national benchmarks.
▲ 92.6% Above OK avg. ▲ 92.6% Above OK avg.OK average: 2.6Click the badge to see the full State ranking.Click here to see the full State ranking.
Quality Measures Info Based on clinical and physical health indicators reported to CMS, such as hospital readmissions, falls, pressure ulcers, and improvements in mobility. These measures reflect how well residents' health needs are being managed.
▲ 76.7% Above OK avg. ▲ 76.7% Above OK avg.OK average: 2.8Click the badge to see the full State ranking.Click here to see the full State ranking.

Staffing hours breakdown

Info Daily nursing hours per resident by staff type, reported to CMS. Higher is generally better — compare this facility to state and national averages to see where staffing stands.

Hours per resident per day — compared to Oklahoma state averages

Total nursing care / resident Info This home is ranked 6th out of 51 homes in Oklahoma for nurse hours. Total adjusted nursing hours per resident per day, combining RN, LPN, and aide time. CMS adjusts this for case-mix so facilities can be fairly compared.
5h 58m per day
Rank #6 / 51Nurse hours — State benchmarkedThis home is ranked 6th out of 51 homes in Oklahoma. Shows adjusted nurse hours per resident per day benchmarked to the Oklahoma average, with a ranking across 51 Oklahoma facilities. More hours mean more direct care. The national average is about 3.5 hrs; below 3.0 is a red flag.Rankings are based only on facilities in Oklahoma that report data for that category. Facilities without available data are excluded from the ranking.Click the rank badge to see the full State ranking.Click here to see the full State ranking.
This facility Oklahoma avg (4h 34m per day)
vs Oklahoma avg
+30%

0 of 6 metrics below state avg

Standout metric Weekend RN is +97% above state avg
Staff typeHours / Day / Residentvs state avg
Registered Nurse (RN) Info RNs hold the highest nursing license and can assess residents, interpret test results, and direct care plans. More RN hours per day often signals stronger clinical oversight and faster response to health changes. 39m per day ▲ 96% State avg: 20m per day · National avg: 41m per day
LPN / LVN Info Licensed Practical Nurses (LPNs) or Licensed Vocational Nurses (LVNs) deliver routine hands-on care — medication administration, wound dressing, and monitoring vital signs. They work under RN supervision and make up a large share of daily bedside care. 1h 24m per day ▲ 53% State avg: 55m per day · National avg: 52m per day
Nurse Aide Info Certified Nurse Aides (CNAs) provide the most direct day-to-day assistance: bathing, dressing, feeding, and mobility. Nurse aide hours are typically the largest staffing category and directly affect residents' quality of life. 3h 29m per day ▲ 36% State avg: 2h 34m per day · National avg: 2h 20m per day
Weekend Total Nursing Info Combined nursing hours (RN + LPN + Nurse Aide) per resident per day on weekends. Staffing often drops on weekends — this figure reveals whether the facility maintains adequate coverage outside of weekday hours. 5h 1m per day ▲ 44% State avg: 3h 29m per day · National avg: 3h 26m per day
Physical Therapist Info Hours per resident per day provided by licensed Physical Therapists (PTs) or PT Assistants. PT services help residents recover mobility after injury or illness and are especially important for post-acute (short-stay) rehabilitation. 2m per day ▲ 54% State avg: 1m per day · National avg: 4m per day
Weekend RN Info Registered nurse hours specifically on weekends. Facilities sometimes reduce RN presence on Saturdays and Sundays — a low weekend RN figure compared to weekday hours can indicate reduced clinical oversight when most administrative staff are absent. 33m per day ▲ 97% State avg: 17m per day · National avg: 28m per day

Capacity and availability

This home usually has availability

Higher occupancy than the Oklahoma average: 60.6%
Occupancy rate
71.3% Rank #82 / 132Occupancy rate — State benchmarkedThis home is ranked 82nd out of 132 homes in Oklahoma. Shows this facility's occupancy rate versus the Oklahoma average, with its Statewide rank out of 132. Higher occupancy signals strong local demand and financial stability.Rankings are based only on facilities in Oklahoma that report data for that category. Facilities without available data are excluded from the ranking.Click the rank badge to see the full State ranking.Click here to see the full State ranking.
Avg. Length of Stay
144 days
Bed community size
84-bed community Rank #48 / 141Bed count — State benchmarkedThis home is ranked 48th out of 141 homes in Oklahoma. Shows this facility's certified or reported bed count compared to other Oklahoma facilities. Larger communities may offer more amenities, programs, and on-site services for residents and families.Rankings are based only on facilities in Oklahoma that report data for that category. Facilities without available data are excluded from the ranking.Click the rank badge to see the full State ranking.Click here to see the full State ranking.
A larger shared setting that may offer more common spaces and organized community services.
Walk Score
Walk Score: 37 / 100 Rank #107 / 208Walk Score — State benchmarkedThis home is ranked 107th out of 208 homes in Oklahoma. Shows how walkable this facility's neighborhood is compared to the average Walk Score across Oklahoma facilities. Higher scores benefit residents, families, and staff.Rankings are based only on facilities in Oklahoma that report data for that category. Facilities without available data are excluded from the ranking.Click the rank badge to see the full State ranking.Click here to see the full State ranking.
Somewhat walkable. A few nearby services may be reachable on foot, but most trips require transportation.

Contact Trinity Woods

Staffing Data

Reporting period: October 1 – December 31, 2025 (Q4 2025). Source: CMS Payroll-Based Journal report.

Total staff 120
Employees 87
Contractors 33
Staff to resident ratio 2.14 : 1
33% more staff per resident than Oklahoma average
Oklahoma average ratio: 1.61 : 1 Oklahoma average ratio: 1.61 : 1See full Oklahoma ranking
Avg staff/day 36
Average shift 9.6 hours
17% better than Oklahoma average
Oklahoma average: 8.2 hours Oklahoma average shift: 8.2 hoursSee full Oklahoma ranking
Total staff hours (quarter) 31,808

Nursing staff breakdown

Q4 2025 · Oct 1 – Dec 31 More info This data comes from the CMS Payroll-Based Journal report covering October 1 – December 31, 2025.
Registered Nurse

Manages medical care and health needs.

RN Staff Info All 9 RN Staff are full-time employees. No contractors work on this role. 9
Average shift length Info Average shift length. Calculated as total hours divided by days worked and average staff per day. 11.7 hours
Licensed Practical Nurse

Assists with medical care and medications.

LPN Staff Info All 15 LPN Staff are full-time employees. No contractors work on this role. 15
Average shift length Info Average shift length. Calculated as total hours divided by days worked and average staff per day. 11.3 hours
Certified Nursing Assistant

Helps with daily care and mobility.

CNA Staff Info All 24 CNA Staff are full-time employees. No contractors work on this role. 24
Average shift length Info Average shift length. Calculated as total hours divided by days worked and average staff per day. 10.9 hours

Contractor staffing

Q4 2025 · Oct 1 – Dec 31 More info This data comes from the CMS Payroll-Based Journal report covering October 1 – December 31, 2025.

Total hours from contractors

8.8%

2,799 contractor hours this quarter

Speech Language Pathologist: 10 Physical Therapy Aide: 6 Qualified Social Worker: 5 Respiratory Therapy Technician: 5 Physical Therapy Assistant: 4 Occupational Therapy Aide: 1 Medical Director: 1 Occupational Therapy Assistant: 1

Staff by category

Q4 2025 · Oct 1 – Dec 31 More info This data comes from the CMS Payroll-Based Journal report covering October 1 – December 31, 2025.
Medication Aide/Technician290299,20392100%10.9
Certified Nursing Assistant240248,10892100%10.9
Licensed Practical Nurse150155,00192100%11.3
Registered Nurse9092,3758997%11.7
RN Director of Nursing5051,9507986%8
Physical Therapy Aide0669907885%7.3
Speech Language Pathologist010109607278%6.4
Dietitian1015326571%8.2
Administrator1015286672%8
Clinical Nurse Specialist1014815661%8.6
Qualified Social Worker0554606874%5.8
Mental Health Service Worker1014465863%7.7
Nurse Practitioner1013844852%8
Physical Therapy Assistant0441405054%2.5
Respiratory Therapy Technician0551284549%2.7
Occupational Therapy Aide011641820%3.6
Medical Director011311415%2.2
Occupational Therapy Assistant0112633%8.5
29 Medication Aide/Technician
% of Days 100%
24 Certified Nursing Assistant
% of Days 100%
15 Licensed Practical Nurse
% of Days 100%
9 Registered Nurse
% of Days 97%
5 RN Director of Nursing
% of Days 86%
6 Physical Therapy Aide
% of Days 85%
10 Speech Language Pathologist
% of Days 78%
1 Dietitian
% of Days 71%
1 Administrator
% of Days 72%
1 Clinical Nurse Specialist
% of Days 61%
5 Qualified Social Worker
% of Days 74%
1 Mental Health Service Worker
% of Days 63%
1 Nurse Practitioner
% of Days 52%
4 Physical Therapy Assistant
% of Days 54%
5 Respiratory Therapy Technician
% of Days 49%
1 Occupational Therapy Aide
% of Days 20%
1 Medical Director
% of Days 15%
1 Occupational Therapy Assistant
% of Days 3%

Penalties and fines

Federal penalties imposed by CMS for regulatory violations, including civil money penalties (fines) and denials of payment for new Medicare/Medicaid admissions.

Source: CMS Penalties Database

No penalties in the past 3 years

No civil money penalties or payment denials were reported in the last 3 years.

Quality of care over time

These measures show how residents usually do over time at this home, based on health outcomes and preventive care.

High-risk clinical events score Info A composite score based on pressure ulcers, falls with injury, weight loss, walking ability decline, and activities of daily living decline. 15.2
72% worse than Oklahoma average

Oklahoma average: 8.9

Functional decline score Info A composite score based on activities of daily living decline, walking ability decline, and incontinence. 25.6
57% worse than Oklahoma average

Oklahoma average: 16.3

Long-stay resident measures
Significantly above average Oklahoma avg: 3.7 Info CMS star rating based on long-stay quality measure performance. 5 stars = significantly above average, 1 star = significantly below average.
Need for Help with Daily Activities Increased Info Percent of long-stay residents whose need for help with daily activities has increased 26.6%
84% worse than Oklahoma average

Oklahoma average: 14.4%

Walking Ability Worsened Info Percent of long-stay residents whose ability to move independently worsened 32.3%
93% worse than Oklahoma average

Oklahoma average: 16.8%

Low Risk Residents with Bowel/Bladder Incontinence Info Percent of low risk long-stay residents who lose control of their bowels or bladder 17.7%
In line with Oklahoma average

Oklahoma average: 17.8%

Falls with Major Injury Info Percent of long-stay residents experiencing one or more falls with major injury 2.0%
54% better than Oklahoma average

Oklahoma average: 4.4%

High Risk Residents with Pressure Ulcers Info Percent of long-stay high risk residents with pressure ulcers 3.8%
27% better than Oklahoma average

Oklahoma average: 5.2%

Urinary Tract Infection Info Percent of long-stay residents with a urinary tract infection 7.3%
143% worse than Oklahoma average

Oklahoma average: 3.0%

Lost Too Much Weight Info Percent of long-stay residents who lose too much weight 11.4%
205% worse than Oklahoma average

Oklahoma average: 3.7%

Depressive Symptoms Info Percent of long-stay residents who have depressive symptoms 1.1%
67% better than Oklahoma average

Oklahoma average: 3.3%

Antipsychotic Use Info Percent of long-stay residents who received an antipsychotic medication 5.6%
64% better than Oklahoma average

Oklahoma average: 15.5%

Pneumococcal Vaccine Info Percent of long-stay residents assessed and appropriately given the pneumococcal vaccine 85.4%
6% worse than Oklahoma average

Oklahoma average: 90.6%

Influenza Vaccine Info Percent of long-stay residents assessed and appropriately given the seasonal influenza vaccine 91.1%
In line with Oklahoma average

Oklahoma average: 94.6%

Hospitalizations per 1,000 days Info Number of hospitalizations per 1,000 long-stay resident days. 0.73
68% better than Oklahoma average

Oklahoma average: 2.28

ED visits per 1,000 days Info Number of outpatient emergency department visits per 1,000 long-stay resident days. 1.16
60% better than Oklahoma average

Oklahoma average: 2.91

Short-stay resident measures
Significantly above average Oklahoma avg: 2.9 Info CMS star rating based on short-stay quality measure performance. 5 stars = much above average, 1 star = much below average.
Pneumococcal Vaccine Info Percent of short-stay residents assessed and appropriately given the pneumococcal vaccine 79.9%
7% better than Oklahoma average

Oklahoma average: 75.0%

Antipsychotic medication increase Info Percent of short-stay residents who newly received an antipsychotic medication 0.0%
100% better than Oklahoma average

Oklahoma average: 2.0%

Influenza Vaccine Info Percent of short-stay residents assessed and appropriately given the seasonal influenza vaccine 62.3%
16% worse than Oklahoma average

Oklahoma average: 74.0%

Re-hospitalized after SNF stay Info Percentage of short-stay residents who were re-hospitalized after their nursing home admission. 24.9%
8% better than Oklahoma average

Oklahoma average: 27.0%

Emergency department visits Info Percentage of short-stay residents who had an outpatient emergency department visit. 7.1%
58% better than Oklahoma average

Oklahoma average: 17.1%

Falls with major injury Info Percentage of SNF residents who experience falls with major injury during their stay. 0.0%
100% better than Oklahoma average

Oklahoma average: 0.8%

Ability to care for self at discharge Info Percentage of residents at or above expected ability to care for themselves at discharge. 60.7%
13% better than Oklahoma average

Oklahoma average: 53.7%

Successful return to home or community Info Rate of successful return to home or community from a skilled nursing facility. 55.5%
10% better than Oklahoma average

Oklahoma average: 50.6%

Breakdown by payment type

Medicare

73% of new residents, usually for short-term rehab.

Typical stay 13 days

Private pay

26% of new residents, often for short stays.

Typical stay 10 - 11 months

Medicaid

1% of new residents, often for long-term daily care.

Typical stay 6 - 7 years

Facility Characteristics

Source: CMS Long-Term Care Facility Characteristics (Data as of Jan 2026)

Total residents 56
Medicare
6
10.7% of residents
Medicaid
9
16.1% of residents
Private pay or other
41
73.2% of residents
Programs & Services
Residents Group

Residents meet regularly to discuss policies, care quality, and activities

CCRC

Part of a Continuing Care Retirement Community offering multiple care levels

Active Resident Council

Organized group of residents that meets regularly to discuss facility policies, quality of life, and activities.

Finances and operations

Based on CMS SNF Cost Report for fiscal year ending in 12/2023.

Nonprofit
Nonprofit Corporation
Net patient revenue Info Net patient revenue — what the home actually collects for resident care, after contractual allowances, bad debt and discounts are subtracted from its gross charges (CMS cost report, Worksheet G-3). It covers resident care only; money the home earns from other sources is shown separately as "Other income."
$24.7M
Net patient income Info Net patient income: net patient revenue minus the home's total operating expenses. A positive figure means it earns more from resident care than it spends to deliver it; a negative figure means the opposite. It excludes non-operating "other income."
-$2.0M
Nonprofit Nonprofit Corporation
Net patient revenue Info Net patient revenue — what the home actually collects for resident care, after contractual allowances, bad debt and discounts are subtracted from its gross charges (CMS cost report, Worksheet G-3). It covers resident care only; money the home earns from other sources is shown separately as "Other income."
$24.7M Rank #5 / 55Revenue — State benchmarkedThis home is ranked 5th out of 55 homes in Oklahoma. Shows this facility's annual revenue compared to the Oklahoma average. Higher revenue generally means more resources for staffing and capital — read alongside Payroll %.Rankings are based only on facilities in Oklahoma that report data for that category. Facilities without available data are excluded from the ranking.Click the rank badge to see the full State ranking.Click here to see the full State ranking.
Net patient income Info Net patient income: net patient revenue minus the home's total operating expenses. A positive figure means it earns more from resident care than it spends to deliver it; a negative figure means the opposite. It excludes non-operating "other income."
-$2.0M
Other income Info Money the home earns outside of resident care — such as investments, grants, rentals and other non-operating sources (CMS cost report, Worksheet G-3). It is tracked separately from net patient revenue: it is not part of that figure, and it is not included in net patient income.
$67.2K
Payroll costs Info Staff salaries plus wage-related costs — benefits such as payroll taxes, health insurance and retirement — from the home's own accounting records (CMS cost report, Worksheet A). Contract or agency labor is counted separately, under other operating costs. Rank #4 / 55Payroll — State benchmarkedThis home is ranked 4th out of 55 homes in Oklahoma. Shows total annual staff payroll benchmarked to the Oklahoma average. Higher payroll investment relative to peers often signals better staffing and less reliance on cheaper contract labor.Rankings are based only on facilities in Oklahoma that report data for that category. Facilities without available data are excluded from the ranking.Click the rank badge to see the full State ranking.Click here to see the full State ranking.
$11.8M 47.8% of net patient revenue Info Payroll as a share of revenue: staff salaries and wage-related benefits divided by net patient revenue. A higher figure means more of each revenue dollar goes to staff pay. Rank #34 / 55Payroll % — State benchmarkedThis home is ranked 34th out of 55 homes in Oklahoma. Shows payroll as a percentage of revenue versus the Oklahoma average. Well-run Oklahoma facilities typically land around 55–61% — the top third Statewide. Below 25% may signal understaffing or heavy agency use — read with Staffing ratings.Rankings are based only on facilities in Oklahoma that report data for that category. Facilities without available data are excluded from the ranking.Click the rank badge to see the full State ranking.Click here to see the full State ranking.
Other operating costs Info Everything it costs to run the home apart from payroll — food, utilities, supplies, maintenance, contract labor and administration. Calculated as total operating expense minus payroll (staff salaries and wage-related benefits).
$15.0M
Total costs Info The home's total operating expense for the year — all the costs of running it, salaries included (CMS cost report, Worksheet G-3).
$26.8M

What does this home offer?

Housing options icon

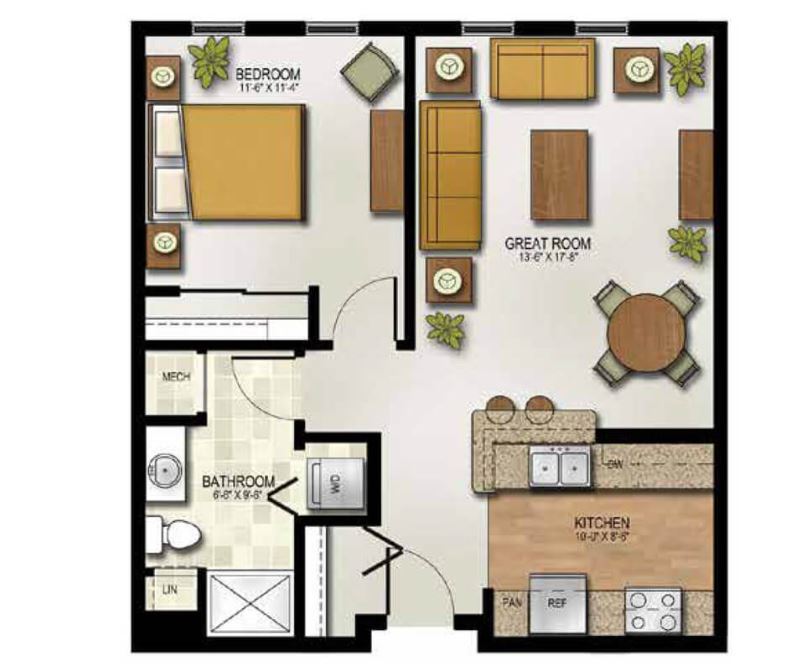
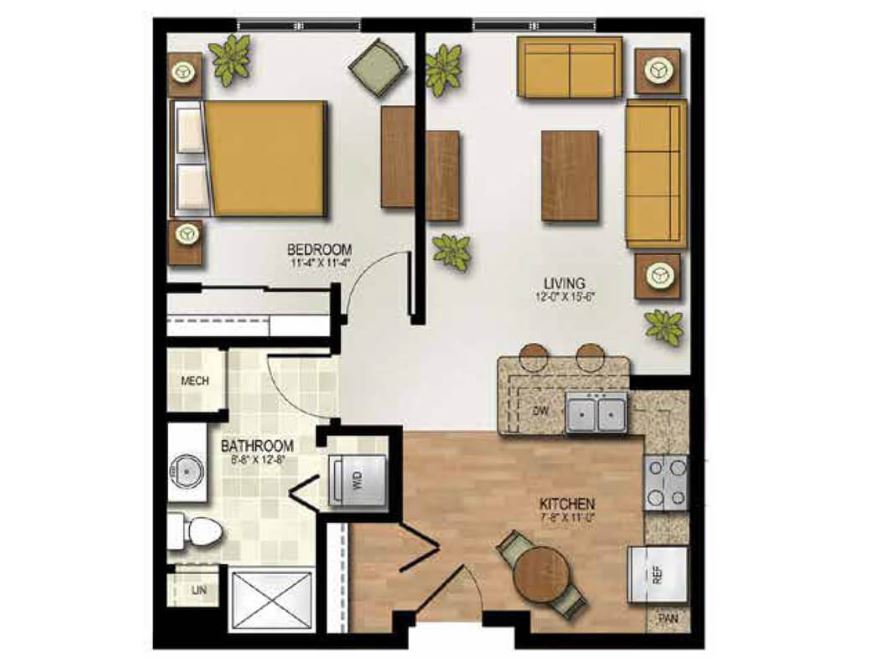
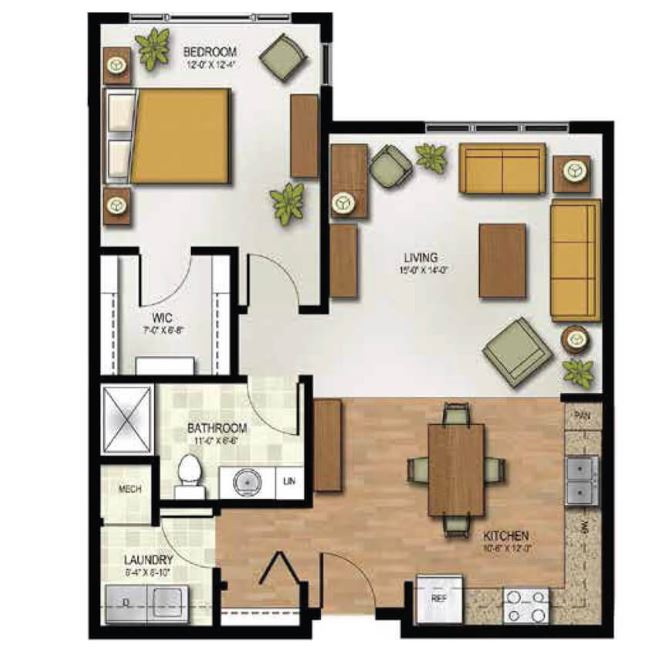
Housing Options: 1 Bed / 2 Bed

Building type icon
Building type icon

Building Type: Mid-rise

Fitness and recreation icon

Fitness and Recreation

Who this home usually serves

TYPE OF STAY

Mostly short-term rehab stays

Most residents typically stay for a few weeks or months before returning home or moving on.

Most new residents arrive under Medicare (73% of admissions), and a typical Medicare stay runs around 13 days.

Admissions
180 total

Coverage residents most often arrive under.

Medicare 73%
Private pay 26%
Medicaid 1%
Discharges
143 total

Coverage residents most often leave under.

Medicare 40%
Private pay 57%
Medicaid 3%

Living Spaces & Floor Plans for Trinity Woods

Places of interest near Trinity Woods

Address 5.6 miles from city center Info Estimated distance in miles from Tulsa's city center to Trinity Woods's address, calculated via Google Maps.

Calculate Travel Distance to Trinity Woods

Add your location

Address

Compare Nursing Homes around Tulsa

The information below is reported by the Oklahoma State Department of Health, Protective Health Services.

5 facilities compared · CMS & OK Dept. of Health data

Trinity Woods
NH
AL
IL
MC
Tulsa
84
Facility 84
OK AVG 74
Rank #48 / 141
71.3%
Facility 71.3%
OK AVG 60.6%
Rank #82 / 132
+18%
5.96
Facility 5.96
OK AVG 4.57
Rank #6 / 51
+24%+30%
$0
Facility $0
OK AVG $48.8k
Rank #1 / 53
5
Facility 5
OK AVG 23.5
Rank #4 / 53
2.5
Facility 2.5
OK AVG 5.0
Rank #12 / 53
-54-
37
Facility 37
OK AVG 38
Rank #107 / 208
Trinity Woods
$24.7M
Facility $24.7M
OK AVG $6.4M
Rank #5 / 55
$11.8M
Facility $11.8M
OK AVG $2.8M
Rank #4 / 55
47.8%
Facility 47.8%
OK AVG 47.7%
Rank #34 / 55
375454
Aberdeen Heights Assisted Living
NH
AL
Tulsa (Southridge Estate)
96
Facility 96
OK AVG 74
Rank #34 / 141
54.2%
Facility 54.2%
OK AVG 60.6%
Rank #116 / 132
-11%
4.48
Facility 4.48
OK AVG 4.57
Rank #25 / 51
+79%-2%
$0
Facility $0
OK AVG $48.8k
Rank #1 / 53
9
Facility 9
OK AVG 23.5
Rank #10 / 53
3.0
Facility 3.0
OK AVG 5.0
Rank #17 / 53
-44F
43
Facility 43
OK AVG 38
Rank #93 / 208
-
$4.0M
Facility $4.0M
OK AVG $6.4M
Rank #49 / 55
$2.2M
Facility $2.2M
OK AVG $2.8M
Rank #47 / 55
56.2%
Facility 56.2%
OK AVG 47.7%
Rank #15 / 55
375580
The Villages at Southern Hills
NH
AL
HC
RC
Tulsa (South Peoria)
98
Facility 98
OK AVG 74
Rank #33 / 141
43.9%
Facility 43.9%
OK AVG 60.6%
Rank #126 / 132
-28%
3.90
Facility 3.90
OK AVG 4.57
Rank #41 / 51
-26%-15%
$0
Facility $0
OK AVG $48.8k
Rank #1 / 53
3
Facility 3
OK AVG 23.5
Rank #2 / 53
1.5
Facility 1.5
OK AVG 5.0
Rank #2 / 53
-43A+
46
Facility 46
OK AVG 38
Rank #84 / 208
Lee Sudbeck
$16.8M
Facility $16.8M
OK AVG $6.4M
Rank #7 / 55
$7.5M
Facility $7.5M
OK AVG $2.8M
Rank #11 / 55
44.9%
Facility 44.9%
OK AVG 47.7%
Rank #52 / 55
375546
University Village Retirement Community
NH
AL
IL
Tulsa
150
Facility 150
OK AVG 74
Rank #5 / 141
63.3%
Facility 63.3%
OK AVG 60.6%
Rank #102 / 132
+4%
4.98
Facility 4.98
OK AVG 4.57
Rank #16 / 51
+17%+9%
$0
Facility $0
OK AVG $48.8k
Rank #1 / 53
15
Facility 15
OK AVG 23.5
Rank #23 / 53
3.8
Facility 3.8
OK AVG 5.0
Rank #28 / 53
-95-
42
Facility 42
OK AVG 38
Rank #97 / 208
Blake Fail
$13.0M
Facility $13.0M
OK AVG $6.4M
Rank #15 / 55
$3.3M
Facility $3.3M
OK AVG $2.8M
Rank #39 / 55
25.6%
Facility 25.6%
OK AVG 47.7%
Rank #55 / 55
375531
Montereau
NH
AL
HC
IL
MC
Tulsa (South Granite Avenue)
80
Facility 80
OK AVG 74
Rank #49 / 141
66.3%
Facility 66.3%
OK AVG 60.6%
Rank #95 / 132
+9%
5.54
Facility 5.54
OK AVG 4.57
Rank #11 / 51
-50%+21%
$24.2k
Facility $24.2k
OK AVG $48.8k
Rank #39 / 53
13
Facility 13
OK AVG 23.5
Rank #19 / 53
2.6
Facility 2.6
OK AVG 5.0
Rank #14 / 53
156D-
48
Facility 48
OK AVG 38
Rank #74 / 208
Saunya Moore
$39.5M
Facility $39.5M
OK AVG $6.4M
Rank #1 / 55
$14.7M
Facility $14.7M
OK AVG $2.8M
Rank #1 / 55
37.2%
Facility 37.2%
OK AVG 47.7%
Rank #54 / 55
375460

Financial Assistance for
Nursing Home in Oklahoma

Trinity Woods is located in Tulsa, Oklahoma.
Here are the financial assistance programs available to residents in Oklahoma.

Get Financial aid guidance

ADvantage Waiver

Oklahoma Medicaid ADvantage

Age 65+ or disabled
General Oklahoma resident, Medicaid- eligible, nursing home-level care need.
Income Limits (2025) ~$2,829/month 300% FBR, individual
Asset Limits $2,000 (individual), $3,000 (couple).
OK

High rural demand; waitlists possible.

Benefits
Personal care (5-7 hours/day) Respite (240 hours/year) Adult day care ($60/day) Home modifications ($1,500 avg.)

Oklahoma Respite Voucher Program

OK Respite Vouchers

Age Caregiver of someone 60+
General Oklahoma resident.
Income Limits ~$2,500/month individual, varies
Asset Limits $40,000 individual
OK

Limited vouchers; rural focus.

Benefits
In-home respite (up to 30 days/year) Adult day care (~$60/day) Facility respite (up to 5 days)

Personal Care Program

Oklahoma Personal Care Program

Age 65+ (or disabled)
General OK resident, Medicaid-eligible, need help with 1+ ADL.
Income Limits (2025) ~$1,255/month (100% FPL, individual); QIT optional.
Asset Limits $2,000 (individual), $3,000 (couple).
OK

No NFLOC required (less stringent than ADvantage); statewide via SoonerCare.

Benefits
Personal care (5-20 hours/week) Bathing Grooming Light housekeeping Meal prep

Older Americans Act (OAA) Services

Oklahoma OAA Services

Age 60+
General OK resident (or spouse of any age); no income/asset limits.
Income Limits (2025) None; donations encouraged for some services.
Asset Limits Not assessed.
OK

11 AAAs; services vary by region (e.g., urban vs. rural).

Benefits
Meals (home-delivered or congregate, ~$5-$7/meal value) Transportation Homemaker services (~4 hours/week) Respite (~5 days/year) Legal aid

Medicare Savings Program (MSP)

Oklahoma Medicare Savings Program

Age 65+ or disabled
General OK resident, Medicare Part A/B.
Income Limits (2025) ~$2,510/month (QMB), ~$3,380/month (SLMB), ~$3,598/month (QI)—individual.
Asset Limits $9,430 (individual), $14,130 (couple).
OK

Three tiers; includes Extra Help for Part D; no waitlist.

Benefits
Covers Part B premiums ($174.70/month) Deductibles ($240/year) Copays (~20%)

VA Aid and Attendance (A&A) and Housebound Benefits

Oklahoma VA Aid and Attendance/Housebound

Age 65+ or disabled veteran/spouse
General OK resident, wartime service, need for ADL help (A&A) or homebound.
Income Limits (2025) Net income < ~$1,984/month (veteran with dependent, A&A); pension offsets income.
Asset Limits ~$155,356 net worth limit
OK

High veteran population; supports rural/urban care needs.

Benefits
Cash (~$1,433-$2,642/month veteran, ~$951-$1,318 spouse) for care costs (e.g., in-home, assisted living)

Senior Farmers’ Market Nutrition Program (SFMNP)

Oklahoma SFMNP

Age 60+
General OK resident, low-income.
Income Limits (2025) ~$2,322/month individual, 185% FPL
Asset Limits Not assessed.
OK

Vouchers (~$50/season) via 11 AAAs; farmers’ market focus.

Benefits
Vouchers (~$50/season) for fresh produce at approved markets

Property Tax Exemption for Seniors

Oklahoma Senior Property Tax Exemption

Age 65+
General OK resident, homeowner, low-income.
Income Limits (2025) ~$25,000/year individual, adjusted annually
Asset Limits Not assessed; home value < $1M.
OK

Exemption up to $1,000 of assessed value; homestead required.

Benefits
Tax reduction (~$100-$200/year avg., varies by county)

Frequently Asked Questions about Trinity Woods

Is Trinity Woods in a walkable area?

Trinity Woods has a walk score of 37. Somewhat walkable. A few nearby services may be reachable on foot, but most trips require transportation.

What is the occupancy rate at Trinity Woods?

Trinity Woods's occupancy is 71.3%.

Does Trinity Woods operate as a for-profit or non-profit?

Trinity Woods is registered as a non-profit.

Are there photos of Trinity Woods?

Yes — there are 4 photos of Trinity Woods in the photo gallery on this page.

What is the address of Trinity Woods?

Trinity Woods is located at 4134 E 31St St, Tulsa, OK 74135.

What is the phone number of Trinity Woods?

(918) 743-2565 will put you in contact with the team at Trinity Woods.

Is Trinity Woods Medicare or Medicaid certified?

Yes — Trinity Woods is a CMS-certified provider of Medicare and Medicaid.

Guides for Better Senior Living

Care Cost Calculator: See Prices in Your Area

Nursing Home Data Explorer

Don’t Wait Too Long: 7 Red Flag Signs Your Parent Needs Assisted Living Now

The True Cost of Assisted Living in 2025 – And How Families Are Paying For It

Understanding Senior Living Costs: Pricing Models, Discounts & Financial Assistance