


Total staff
216
Employees
133
Contractors
83
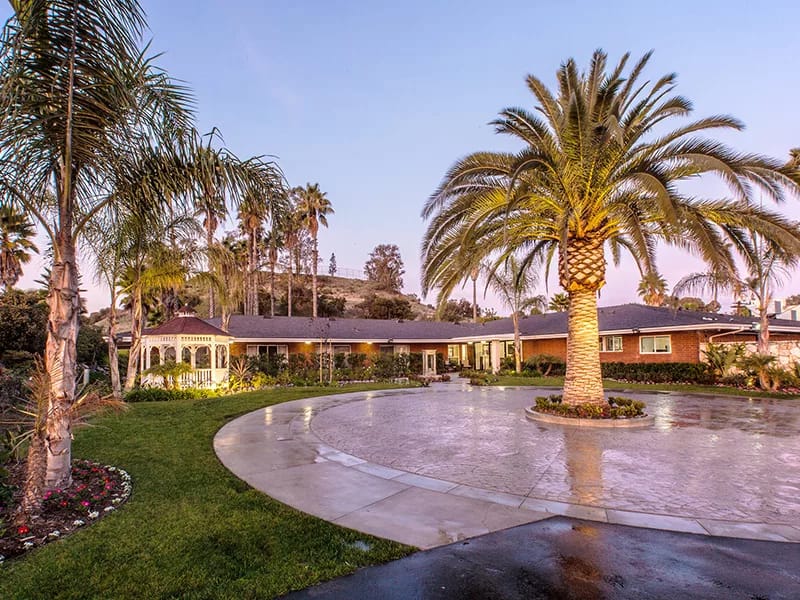
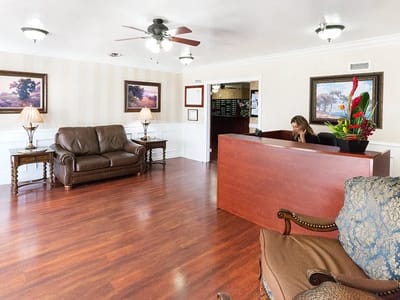
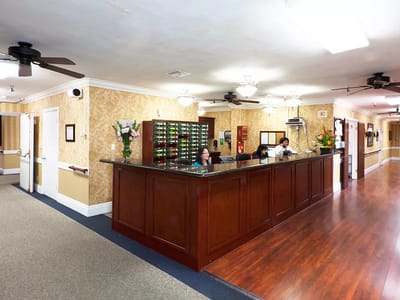
University Care Center, located in San Diego, is a 5-star Medicare facility that offers a variety of services, including short-term rehabilitation, skilled nursing, long-term care, wound care, and hospice services. The facility is conveniently located near top-notch hospitals and provides easy access to major freeways. Here, residents receive round-the-clock professional care from a dedicated staff. They accept a range of payment options, including private pay, Medicare, PPOs, and Medi-Cal. They also offer a variety of HMOs to provide flexibility in payment options.
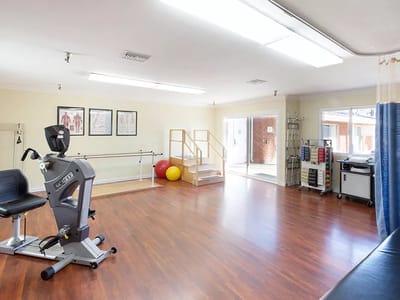
The facility boasts a state-of-the-art gym, as well as gorgeous courtyards and a homey lobby that provide a comfortable and welcoming atmosphere for residents. Their in-house registered dietitian also ensures that residents’ nutritional needs are met, combining comfort and sustainability to provide a holistic approach to care. Residents are sure to enjoy Southern California’s breathtaking beautiful city under University Care Center’s exemplary care.
| Staff type | Hours / Day / Resident | vs state avg |
|---|---|---|
|
Registered Nurse (RN)
| 27m per day | ▼ 30% State avg: 39m per day · National avg: 41m per day |
|
LPN / LVN
| 1h 1m per day | ▼ 16% State avg: 1h 13m per day · National avg: 52m per day |
|
Nurse Aide
| 2h 32m per day | ▼ 5% State avg: 2h 39m per day · National avg: 2h 21m per day |
|
Weekend Total Nursing
| 3h 46m per day | ▼ 8% State avg: 4h 5m per day · National avg: 3h 26m per day |
|
Physical Therapist
| 11m per day | ▲ 125% State avg: 5m per day · National avg: 4m per day |
|
Weekend RN
| 20m per day | ▼ 32% State avg: 30m per day · National avg: 29m per day |
Reporting period: October 1 – December 31, 2025 (Q4 2025). Source: CMS Payroll-Based Journal report.
Manages medical care and health needs.
Assists with medical care and medications.
Helps with daily care and mobility.
Total hours from contractors
1,427 contractor hours this quarter
| Certified Nursing Assistant | 70 | 69 | 139 | 18,499 | 92 | 100% | 7.2 |
| Licensed Practical Nurse | 17 | 11 | 28 | 7,088 | 92 | 100% | 7.9 |
| Registered Nurse | 6 | 3 | 9 | 2,529 | 92 | 100% | 7.2 |
| Speech Language Pathologist | 7 | 0 | 7 | 1,856 | 73 | 79% | 7.1 |
| Physical Therapy Aide | 9 | 0 | 9 | 1,615 | 76 | 83% | 6.9 |
| Respiratory Therapy Technician | 5 | 0 | 5 | 1,386 | 68 | 74% | 7.4 |
| Dental Services Staff | 4 | 0 | 4 | 1,240 | 65 | 71% | 7.6 |
| Physical Therapy Assistant | 3 | 0 | 3 | 902 | 70 | 76% | 7.2 |
| Other Dietary Services Staff | 2 | 0 | 2 | 751 | 91 | 99% | 6.4 |
| Administrator | 1 | 0 | 1 | 512 | 64 | 70% | 8 |
| Nurse Practitioner | 1 | 0 | 1 | 512 | 64 | 70% | 8 |
| Dietitian | 1 | 0 | 1 | 487 | 62 | 67% | 7.9 |
| Qualified Social Worker | 4 | 0 | 4 | 466 | 65 | 71% | 5.4 |
| RN Director of Nursing | 1 | 0 | 1 | 435 | 58 | 63% | 7.5 |
| Clinical Nurse Specialist | 1 | 0 | 1 | 323 | 45 | 49% | 7.2 |
| Nurse Aide in Training | 1 | 0 | 1 | 214 | 30 | 33% | 7.1 |
Federal penalties imposed by CMS for regulatory violations, including civil money penalties (fines) and denials of payment for new Medicare/Medicaid admissions.
Source: CMS Penalties Database
No penalties in the past 3 years
No civil money penalties or payment denials were reported in the last 3 years.
These measures show how residents usually do over time at this home, based on health outcomes and preventive care.
California average: 6.6
California average: 11.3
California average: 11.1%
California average: 12.0%
California average: 11.3%
California average: 1.7%
California average: 5.0%
California average: 1.2%
California average: 4.2%
California average: 6.7%
California average: 10.1%
California average: 98.5%
California average: 98.2%
California average: 2.25
California average: 1.59
California average: 94.0%
California average: 1.5%
California average: 93.2%
California average: 23.2%
California average: 11.2%
California average: 0.8%
California average: 53.7%
California average: 50.6%
Quality measures are calculated from Minimum Data Set (MDS) assessments. For most measures, lower percentages indicate better care quality.
41% of new residents, usually for short-term rehab.
57% of new residents, often for short stays.
2% of new residents, often for long-term daily care.
Source: CMS Long-Term Care Facility Characteristics (Data as of Jan 2026)
Residents meet regularly to discuss policies, care quality, and activities
State-approved Nurse Aide Training and Competency Evaluation Program on-site
Organized group of residents that meets regularly to discuss facility policies, quality of life, and activities.
Data sourced from CMS Long-Term Care Facility Characteristics quarterly report. Payer mix reflects the current resident census by primary payment source.
Historical financial and operational data for University Care Center from 2011–2023, based on CMS SNF Cost Reports.
Key figures below are for fiscal year ending in 12/2023.
Based on CMS SNF Cost Report for fiscal year ending in 12/2023.
This home supports both short-term rehab and long-term care, with residents staying for a wide range of durations.
Most new residents arrive under private pay (57% of admissions), and a typical private pay stay runs around 2 months.
Coverage residents most often arrive under.
Coverage residents most often leave under.
![]() 5.5 miles from city center
5.5 miles from city center
![]() Estimated distance in miles from San Diego's city center to University Care Center's address, calculated via Google Maps.
Estimated distance in miles from San Diego's city center to University Care Center's address, calculated via Google Maps.
Add your location
The information below is reported by the California Department of Social Services and Department of Public Health.
| Vi at La Jolla Village | NH AL IL MC SNF | San Diego (University City) | 783
Facility
783
CA AVG
104
Rank
#5 / 1648 |
69.3%
Facility
69.3%
CA AVG
73.8
Rank
#948 / 1496 | -6% | 5.26
Facility
5.26
CA AVG
4.22
Rank
#25 / 327 | +43% | +25% | $0
Facility
$0
CA AVG
$56.5k
Rank
#1 / 334 | 84
Facility
84
CA AVG
81
Rank
#730 / 1399 | 15
Facility
15
CA AVG
50.2
Rank
#22 / 327 | 2.1
Facility
2.1
CA AVG
4.6
Rank
#9 / 327 | - | 543 | - |
88
Facility
88
CA AVG
57
Rank
#218 / 2087 | Cc-La Jolla, Inc | $10.6MFiscal year ending 12/2023
Facility
$10.6MFiscal year ending 12/2023
CA AVG
$17.0M
Rank
#5 / 327 | $9.6MFiscal year ending 12/2023
Facility
$9.6MFiscal year ending 12/2023
CA AVG
$7.0M
Rank
#114 / 327 | 91.3%Fiscal year ending 12/2023
Facility
91.3%Fiscal year ending 12/2023
CA AVG
45.2%
Rank
#326 / 327 | 555793 | ||||
| Ridgeview Health Center | NH AL MC SNF | San Diego (Scripps Ranch) | 68
Facility
68
CA AVG
104
Rank
#1013 / 1648 |
85.3%
Facility
85.3%
CA AVG
73.8
Rank
#450 / 1496 | +16% | 5.54
Facility
5.54
CA AVG
4.22
Rank
#21 / 327 | -21% | +31% | $33.2k
Facility
$33.2k
CA AVG
$56.5k
Rank
#262 / 334 | 92
Facility
92
CA AVG
81
Rank
#308 / 1399 | 17
Facility
17
CA AVG
50.2
Rank
#26 / 327 | 2.8
Facility
2.8
CA AVG
4.6
Rank
#45 / 327 | - | 58 | - |
11
Facility
11
CA AVG
57
Rank
#1941 / 2087 | Crestview Hc LLC | - | - | - | 555928 | ||||
| University Care Center | NH HOS SNF | San Diego (Mid-City) | 87
Facility
87
CA AVG
104
Rank
#871 / 1648 |
92.4%
Facility
92.4%
CA AVG
73.8
Rank
#281 / 1496 | +25% | 3.30
Facility
3.30
CA AVG
4.22
Rank
#301 / 327 | -53% | -22% | $0
Facility
$0
CA AVG
$56.5k
Rank
#1 / 334 | - | 44
Facility
44
CA AVG
50.2
Rank
#178 / 327 | 2.9
Facility
2.9
CA AVG
4.6
Rank
#54 / 327 | - | 80 | - |
71
Facility
71
CA AVG
57
Rank
#701 / 2087 | Pouya Afshar | $17.1MFiscal year ending 12/2023
Facility
$17.1MFiscal year ending 12/2023
CA AVG
$17.0M
Rank
#105 / 327 | $8.4MFiscal year ending 12/2023
Facility
$8.4MFiscal year ending 12/2023
CA AVG
$7.0M
Rank
#159 / 327 | 48.9%Fiscal year ending 12/2023
Facility
48.9%Fiscal year ending 12/2023
CA AVG
45.2%
Rank
#275 / 327 | 55328 | ||||
| Bayshire Torrey Pines | NH AL IL MC SNF | San Diego (Carmel Valley) | 125
Facility
125
CA AVG
104
Rank
#526 / 1648 |
84.8%
Facility
84.8%
CA AVG
73.8
Rank
#461 / 1496 | +15% | 3.32
Facility
3.32
CA AVG
4.22
Rank
#301 / 327 | -2% | -21% | $110.1k
Facility
$110.1k
CA AVG
$56.5k
Rank
#323 / 334 | 95
Facility
95
CA AVG
81
Rank
#108 / 1399 | 52
Facility
52
CA AVG
50.2
Rank
#215 / 327 | 5.8
Facility
5.8
CA AVG
4.6
Rank
#265 / 327 | 1 | 106 | A+ |
81
Facility
81
CA AVG
57
Rank
#383 / 2087 | Jeremy Danenhauer | $13.4M*Fiscal year ending 12/2022These figures are from this home's most recent complete cost report — an older period than most facilities report. Compare with that in mind.
Facility
$13.4M*Fiscal year ending 12/2022These figures are from this home's most recent complete cost report — an older period than most facilities report. Compare with that in mind.
CA AVG
$17.0M
Rank
#216 / 327 | $7.4M*Fiscal year ending 12/2022These figures are from this home's most recent complete cost report — an older period than most facilities report. Compare with that in mind.
Facility
$7.4M*Fiscal year ending 12/2022These figures are from this home's most recent complete cost report — an older period than most facilities report. Compare with that in mind.
CA AVG
$7.0M
Rank
#202 / 327 | 55.5%*Fiscal year ending 12/2022These figures are from this home's most recent complete cost report — an older period than most facilities report. Compare with that in mind.
Facility
55.5%*Fiscal year ending 12/2022These figures are from this home's most recent complete cost report — an older period than most facilities report. Compare with that in mind.
CA AVG
45.2%
Rank
#136 / 327 | 555746 | ||||
| Jacob Health Care Center | NH SNF | San Diego (City Heights) | 40
Facility
40
CA AVG
104
Rank
#1201 / 1648 |
77.5%
Facility
77.5%
CA AVG
73.8
Rank
#730 / 1496 | +5% | 3.29
Facility
3.29
CA AVG
4.22
Rank
#301 / 327 | +11% | -22% | $0
Facility
$0
CA AVG
$56.5k
Rank
#1 / 334 | 87
Facility
87
CA AVG
81
Rank
#568 / 1399 | 30
Facility
30
CA AVG
50.2
Rank
#106 / 327 | 5.0
Facility
5.0
CA AVG
4.6
Rank
#222 / 327 | - | 31 | C+ |
49
Facility
49
CA AVG
57
Rank
#1368 / 2087 | Utah Lake Holdings, LLC | $22.7M*Fiscal year ending 12/2022These figures are from this home's most recent complete cost report — an older period than most facilities report. Compare with that in mind.
Facility
$22.7M*Fiscal year ending 12/2022These figures are from this home's most recent complete cost report — an older period than most facilities report. Compare with that in mind.
CA AVG
$17.0M
Rank
#66 / 327 | $15.9M*Fiscal year ending 12/2022These figures are from this home's most recent complete cost report — an older period than most facilities report. Compare with that in mind.
Facility
$15.9M*Fiscal year ending 12/2022These figures are from this home's most recent complete cost report — an older period than most facilities report. Compare with that in mind.
CA AVG
$7.0M
Rank
#20 / 327 | 70.1%*Fiscal year ending 12/2022These figures are from this home's most recent complete cost report — an older period than most facilities report. Compare with that in mind.
Facility
70.1%*Fiscal year ending 12/2022These figures are from this home's most recent complete cost report — an older period than most facilities report. Compare with that in mind.
CA AVG
45.2%
Rank
#74 / 327 | 55508 |
University Care Center is located in San Diego, California.
Here are the financial assistance programs available to residents in California.
University Care Center is in the Mid-City neighborhood.
University Care Center has a walk score of 71. Very walkable. Most errands can be accomplished on foot, and many essentials are within a short walk.
University Care Center's occupancy is 94.6%.
University Care Center is registered as a for-profit.
Yes — there are 6 photos of University Care Center in the photo gallery on this page.
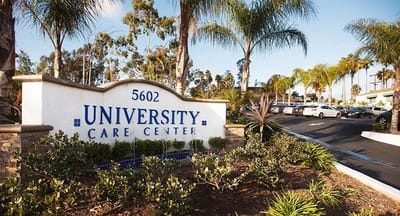
University Care Center is located at 5602 University Ave, San Diego, CA 92105.
(619) 583-1993 will put you in contact with the team at University Care Center.
Care Cost Calculator: See Prices in Your Area
Nursing Home Data Explorer
Don’t Wait Too Long: 7 Red Flag Signs Your Parent Needs Assisted Living Now
The True Cost of Assisted Living in 2025 – And How Families Are Paying For It
Understanding Senior Living Costs: Pricing Models, Discounts & Financial Assistance


