Explore Open Rooms

1 Contact details
2 What type of senior care service are you looking for?
3 What budget do you have in mind for senior care?
4 How soon do you need to find care?
5 Additional details

Thank you for your interest!

Our team will be in touch shortly to help with next steps.

Nursing Home

Valley Healthcare Center

Nursing Home

Valley Healthcare Center

1680 N Waterman Ave, San Bernardino, CA 92404 View map
Overview of Valley Healthcare Center

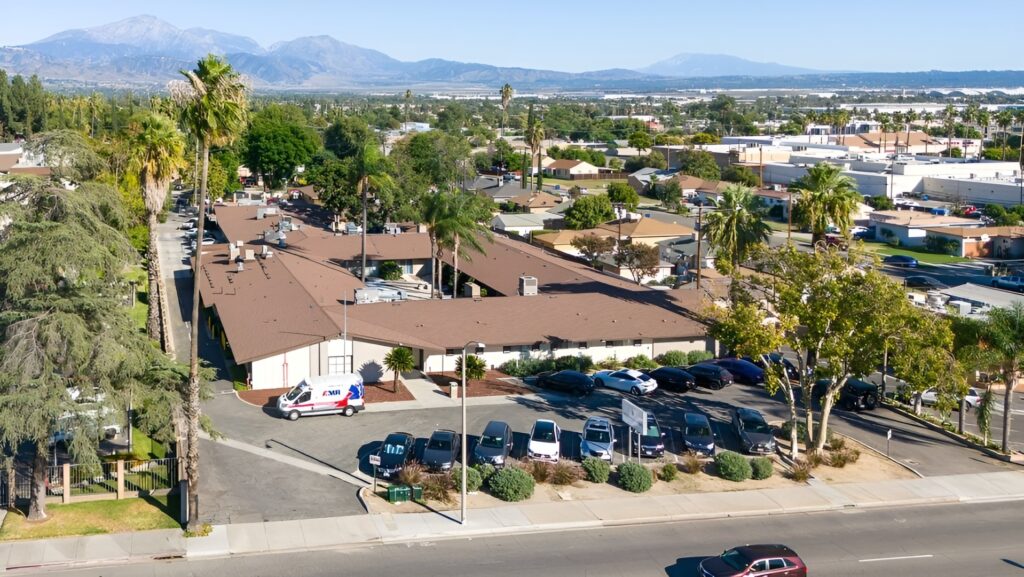
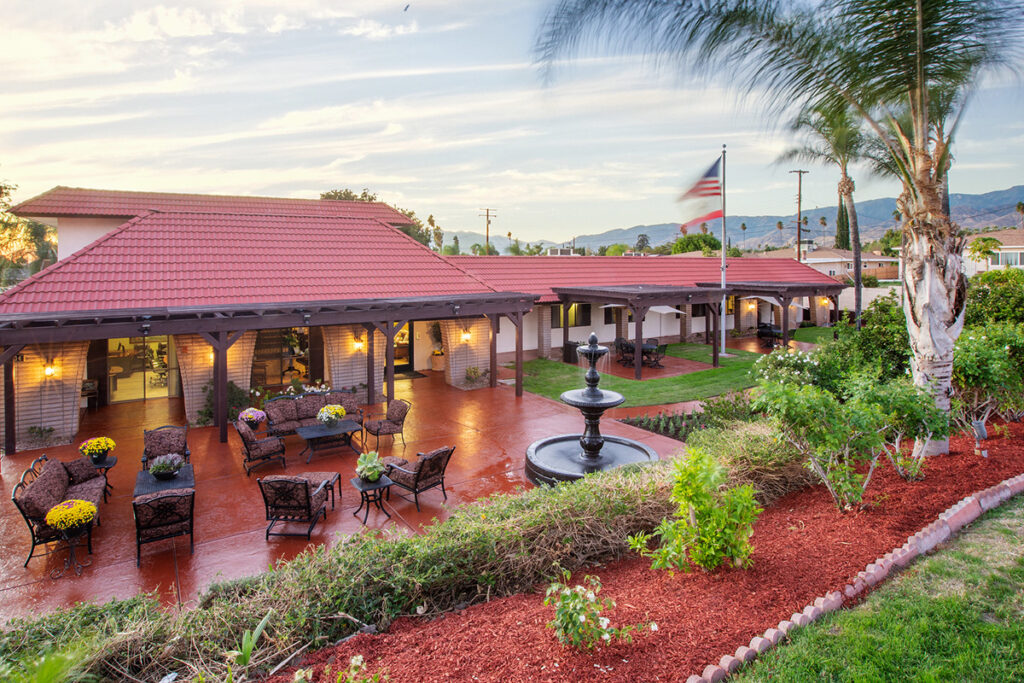
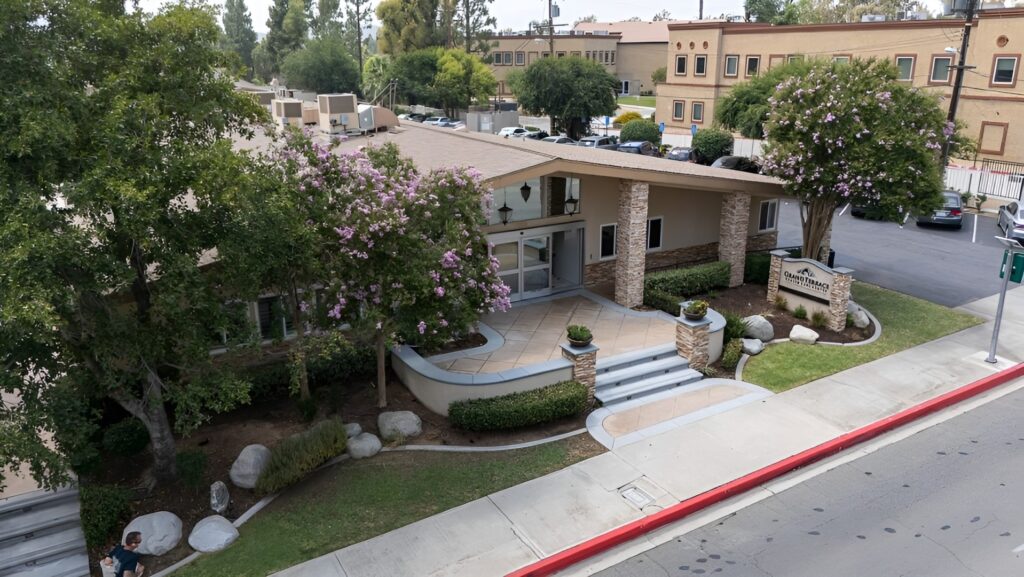
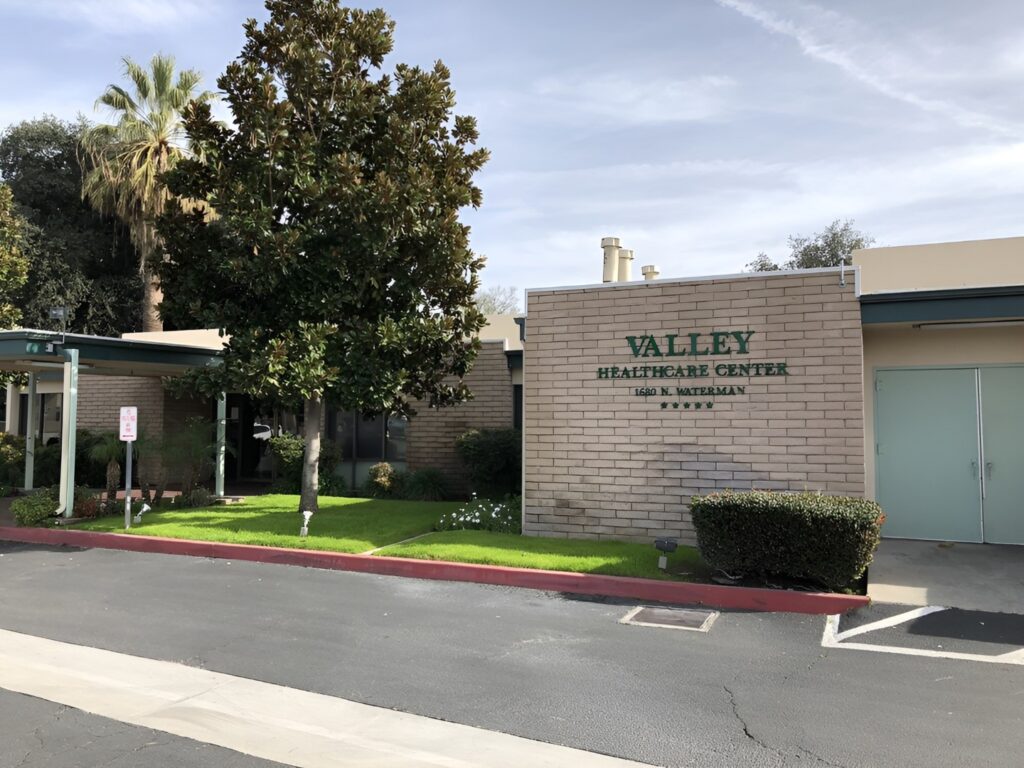
Conveniently located near trusted hospitals like Loma Linda University Medical Center and Community Hospital of San Bernardino in San Bernardino, CA, Valley Healthcare Center is an esteemed community that offers short-term and long-term care. Featuring 109 cozy and specially designed accommodations, the community ensures comfort and safety, especially with top-notch care and assistance tailored to residents’ special needs. Medicare is also accepted in the community, easing residents’ financial challenges.

With state-of-the-art amenities and innovative approaches, residents keep peace of mind and enjoy the highest quality of life. The community also offers continued care from home to ensure a worry-free recovery. Mealtimes are also something to look forward to, with delightful and healthy meals catering to residents’ dietary needs and preferences. Find the care you need with the community’s wide range of care and round-the-clock assistance.

(909) 886-5291

Quality ratings

Measured by Centers for Medicare & Medicaid Services (CMS)

Overall rating Info The Overall CMS Rating combines results from health inspections, staffing levels and quality measures. Health inspections carry the most weight. Staffing and quality scores can increase or decrease the final rating based on performance compared to state and national standards.
4/5
California average: 3.6/5
Health Inspection Info Based on the results of the facility's three most recent standard inspections and any complaint investigations. CMS reviews the number, scope, and severity of deficiencies, with more recent findings weighted more heavily.
3/5
California average: 3.2/5
Staffing Info Measures average nursing staff hours per resident per day, including Registered Nurses (RNs) and total nursing staff. Ratings are adjusted based on the level of care residents require and are compared to state and national benchmarks.
4/5
California average: 3.5/5
Quality Measures Info Based on clinical and physical health indicators reported to CMS, such as hospital readmissions, falls, pressure ulcers, and improvements in mobility. These measures reflect how well residents' health needs are being managed.
5/5
California average: 4.3/5

Nursing care per resident

Info This shows how many total hours of nursing staff time are available per resident each day. Higher numbers usually mean more staff support.
4h 11m per day

This home provides 4% less nursing time per resident than the California average.

California average: 4h 23m per day

Capacity and availability

Medium-capacity home

Offers a balance of services and community atmosphere.

Total beds 113

This home usually has availability

Lower occupancy suggests more openings may be available.

Lower demand than the California average
Occupancy rate 80.4%
Residents per day (avg) 190
Occupancy rate
80.4%
Residents per day (avg)
190

Who this home usually serves

TYPE OF STAY

Mostly long-term care residents

Most residents stay for extended periods and receive ongoing daily care.

Might be optimal for
Long-term daily care Ongoing support needs

Breakdown by payment type

Medicare

26% of new residents, usually for short-term rehab.

Typical stay 2 months

Private pay

26% of new residents, often for short stays.

Typical stay 1 - 2 months

Medicaid

48% of new residents, often for long-term daily care.

Typical stay 1 - 2 years

Finances and operations

Privately-owned community
Home revenue
$31.3M
Operating loss
-$2.5M
Privately-owned community
Home revenue
$31,328,613.00
Operating loss
$-2,516,773.00
Payroll costs Info The portion of the home's budget spent on staff, including nurses, caregivers, and other employees who support care and operations.
$10.4M
33.3% of revenue
Other operating costs Info All remaining costs needed to run the home, such as food, utilities, building maintenance, supplies and administrative expenses.
$23.4M
Total costs $33.8M
Walk Score
Walk Score: 60 / 100
Moderately walkable. Some errands can be accomplished on foot, with a mix of nearby amenities.
BBB Rating
BBB Rating: A+ (Not Accredited)
An independent rating from the Better Business Bureau based on factors such as complaint history, transparency, and business practices.
How BBB ratings work

Additional licensing details

CMS Certification Number: 56389

What does this home offer?

Housing options icon

Housing Options: Private / Semi-Private / 3 Bed Rooms

Building type icon
Building type icon

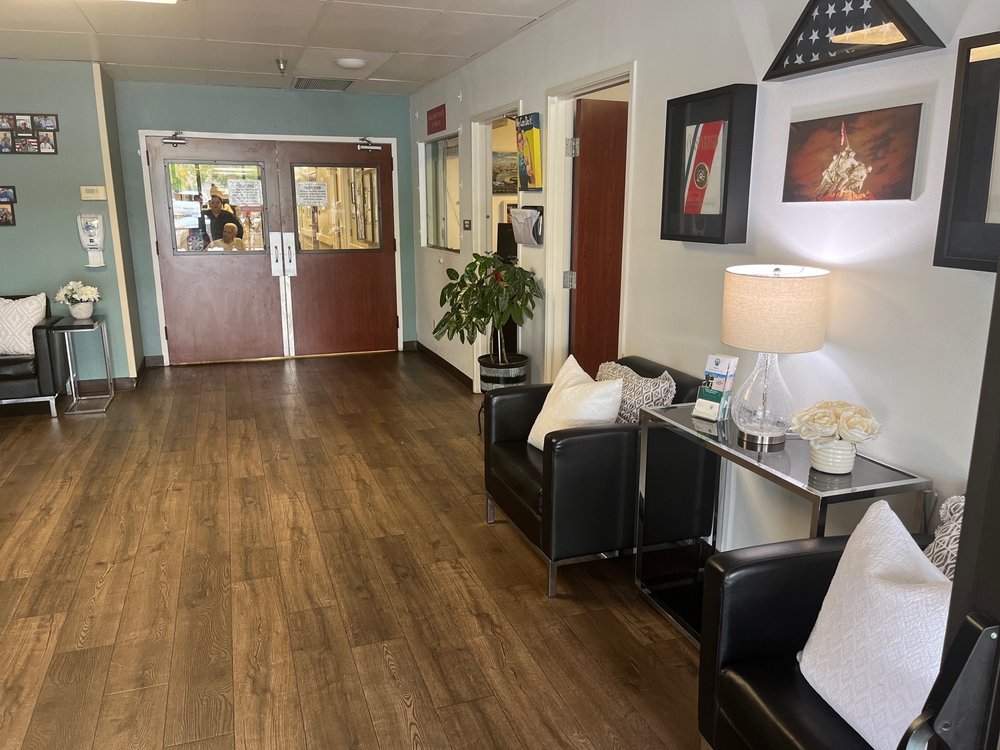
Building Type: Single-story

Dining services icon

Dining Services

Beauty services icon

Beauty Services

Recreational activities icon

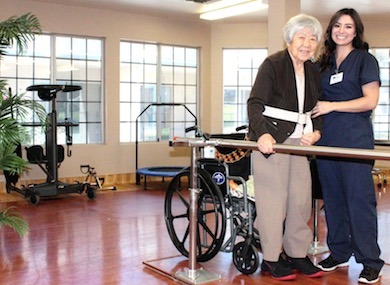
Recreational Activities

Health Programs icon

Health Programs

Types of Care at Valley Healthcare Center

Nursing Home
Contact Valley Healthcare Center

Health Inspection History

Inspections
Total health inspections 8

California average 12.5


Last Health inspection on Jul 2025

Total health citations 45

California average 50.2

Citations per inspection
5.62

California average 4.65


Health citations are formal notices following inspections when they fail to comply with safety and care standards.

37 of 45 citations resulted from standard inspections; and 8 of 45 resulted from complaint investigations.

Breakdown of citation severity (last 3 years)
Critical Health citations More info 0
100% better than California average

California average: 0.4


Serious Health citations More info 0
100% better than California average

California average: 1

0 critical citations More info California average: 0.4

0 serious citations More info California average: 1

42 moderate citations More info California average: 47.2

3 minor citations More info California average: 1.5
Citations history (last 3 years)
Environmental moderate citation Info Issues related to building safety, cleanliness, maintenance, and overall living conditions. Jul 25, 2025
Corrected

Environmental moderate citation Info Issues related to building safety, cleanliness, maintenance, and overall living conditions. Jul 25, 2025
Corrected

Infection Control moderate citation Info Issues related to preventing and controlling infections, including hygiene practices and safety protocols. Jul 25, 2025
Corrected

Nutrition moderate citation Info Issues related to food quality, meal service, and resident's nutritional needs. Jul 25, 2025
Corrected

Compare Nursing Homes around San Bernardino County The information below is reported by the California Department of Social Services and Department of Public Health.

5 facilities compared · CMS & CA Dept. of Health data · Updated Apr 2026

Arrowhead Springs Healthcare Center
NH

Nursing Home Licensed facility providing 24/7 skilled nursing care for residents with complex, ongoing medical needs. Staffed by RNs, LPNs, and CNAs. Inspected and star-rated annually by CMS. Accepts Medicare (short-term rehab) and Medicaid (long-term care).

San Bernardino (Perris Hills)
119
87.3%
+3%
4.56
+1%
+8%
0
32
0
107
-
69
Sanchez Gonzalez, Yamaliel
$19,7M
$7,4M
37.5%
55708
Private / Semi-Private Rooms
Highland Palms Healthcare Center
NH

Nursing Home Licensed facility providing 24/7 skilled nursing care for residents with complex, ongoing medical needs. Staffed by RNs, LPNs, and CNAs. Inspected and star-rated annually by CMS. Accepts Medicare (short-term rehab) and Medicaid (long-term care).

Highland (Cypress)
99
93.2%
+10%
3.17
-32%
-25%
0
33
0
92
A+
57
Sivapalan, Sivakami
$26,7M
$7,1M
26.8%
56024
Private Rooms
Grand Terrace Health Care Center
NH

Nursing Home Licensed facility providing 24/7 skilled nursing care for residents with complex, ongoing medical needs. Staffed by RNs, LPNs, and CNAs. Inspected and star-rated annually by CMS. Accepts Medicare (short-term rehab) and Medicaid (long-term care).

Grand Terrace
59
90.5%
+7%
4.11
+5%
-3%
0
30
1
51
-
67
-
$10,4M
$4,4M
42.5%
55129
Private / Semi-Private Rooms
Loma Linda Post Acute
NH

Nursing Home Licensed facility providing 24/7 skilled nursing care for residents with complex, ongoing medical needs. Staffed by RNs, LPNs, and CNAs. Inspected and star-rated annually by CMS. Accepts Medicare (short-term rehab) and Medicaid (long-term care).

Loma Linda
83
79.7%
-6%
3.85
-30%
-9%
0
29
0
79
-
39
Chancellor Health Care Inc
$6,4M
$2,4M
36.9%
55299
Semi-Private Rooms
Valley Healthcare Center
NH

Nursing Home Licensed facility providing 24/7 skilled nursing care for residents with complex, ongoing medical needs. Staffed by RNs, LPNs, and CNAs. Inspected and star-rated annually by CMS. Accepts Medicare (short-term rehab) and Medicaid (long-term care).

San Bernardino
202
80.4%
-5%
4.18
-27%
-1%
0
45
0
21
A+
60
Vale Holding Company Llc
$30,3M
$10,4M
34.4%
56389
Private / Semi-Private / 3 Bed Rooms

Places of interest near Valley Healthcare Center

Address 2 miles from city center
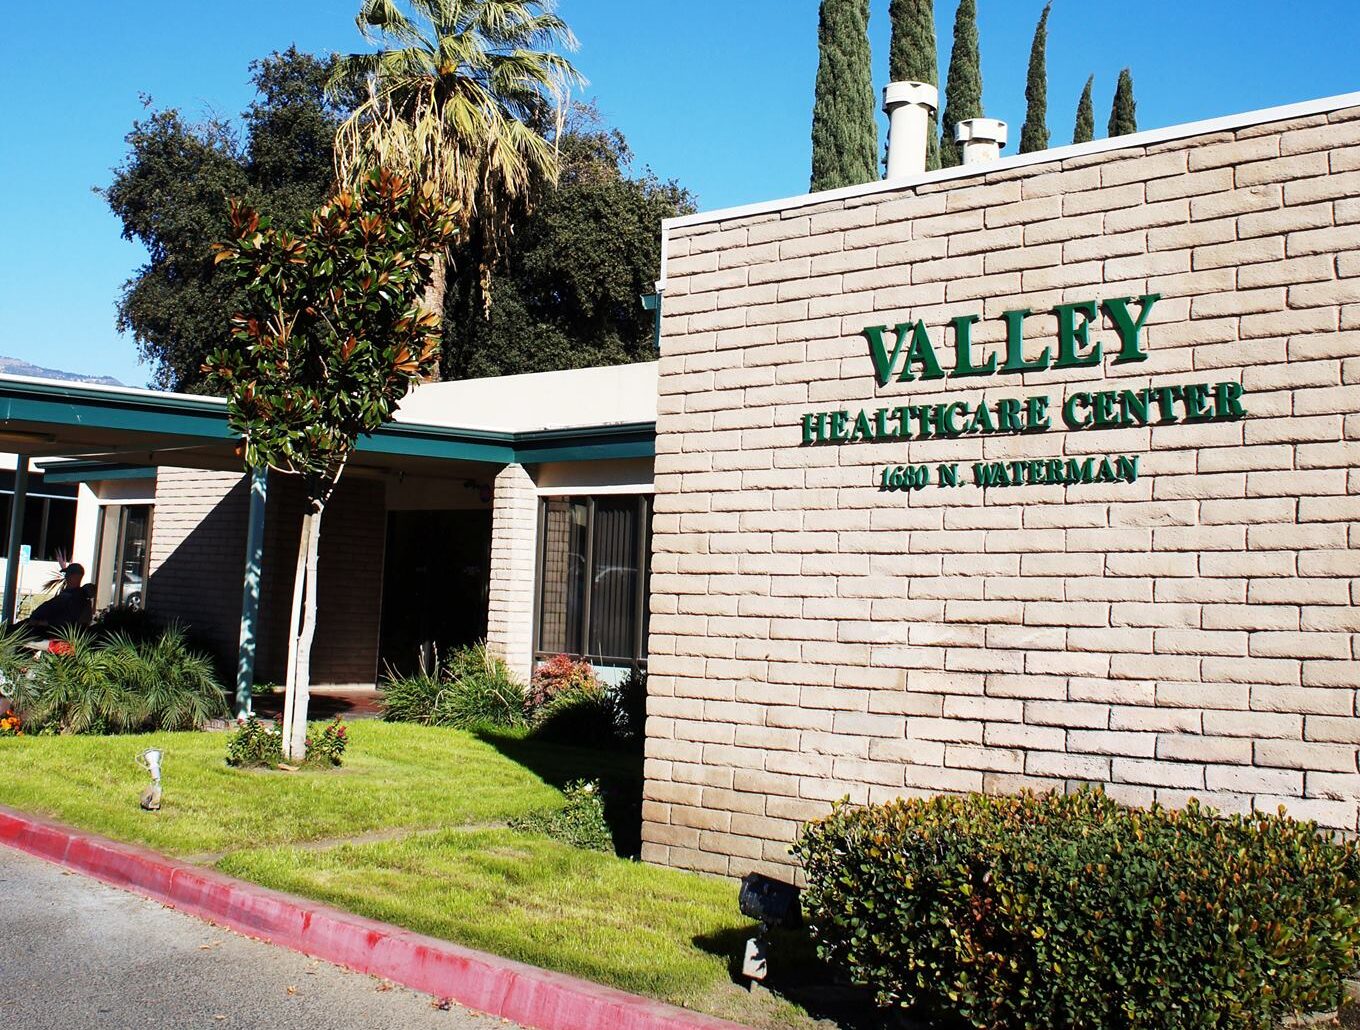
Address 1680 N Waterman Ave, San Bernardino, CA 92404

Calculate Travel Distance to Valley Healthcare Center

Add your location

Address

Staffing Data (Q2 2025)

This data corresponds to Q2 2025 and is based on CMS Payroll-Based Journal.

Total staff 402
Employees 143
Contractors 259
Staff to resident ratio 2.14:1
2138198% better than California average

California average ratio: 0.00:1

Avg staff/day 99
Average shift 8 hours
0% compared with California average

California average: 7.7 hours

Total staff hours (quarter) 71,949
Nursing staff breakdown
Registered Nurse

Manages medical care and health needs.

Total count 25
Average shift length Info Average shift length. Calculated as total hours divided by days worked and average staff per day. 7.3 hours

This role is partially covered by contractors.

Licensed Practical Nurse

Assists with medical care and medications.

Total count 92
Average shift length Info Average shift length. Calculated as total hours divided by days worked and average staff per day. 8.3 hours

This role is partially covered by contractors.

Certified Nursing Assistant

Helps with daily care and mobility.

Total count 258
Average shift length Info Average shift length. Calculated as total hours divided by days worked and average staff per day. 8 hours

This role is partially covered by contractors.

Contractor staffing

Total hours from contractors

31.5%

22,637 contractor hours this quarter

Certified Nursing Assistant: 179 Licensed Practical Nurse: 66 Registered Nurse: 10 Physical Therapy Assistant: 2 Respiratory Therapy Technician: 1 Qualified Social Worker: 1
Staff by category
Certified Nursing Assistant7917925843,82391100%8
Licensed Practical Nurse26669214,26791100%8.3
Registered Nurse1510254,53591100%7.3
Other Dietary Services Staff8082,01291100%7.9
RN Director of Nursing4041,7226673%7.9
Dental Services Staff3039487077%7.5
Speech Language Pathologist2028527785%6.7
Clinical Nurse Specialist2026396268%7.5
Physical Therapy Assistant0225207380%6.4
Dietitian1015126470%8
Nurse Practitioner1014886167%8
Occupational Therapy Aide1014886167%8
Respiratory Therapy Technician0114886167%8
Administrator1014725965%8
Qualified Social Worker0111832325%8
258 Certified Nursing Assistant
% of Days 100%
92 Licensed Practical Nurse
% of Days 100%
25 Registered Nurse
% of Days 100%
8 Other Dietary Services Staff
% of Days 100%
4 RN Director of Nursing
% of Days 73%
3 Dental Services Staff
% of Days 77%
2 Speech Language Pathologist
% of Days 85%
2 Clinical Nurse Specialist
% of Days 68%
2 Physical Therapy Assistant
% of Days 80%
1 Dietitian
% of Days 70%
1 Nurse Practitioner
% of Days 67%
1 Occupational Therapy Aide
% of Days 67%
1 Respiratory Therapy Technician
% of Days 67%
1 Administrator
% of Days 65%
1 Qualified Social Worker
% of Days 25%

Facility Characteristics

Source: CMS Long-Term Care Facility Characteristics (Data as of Jan 2026)

Total census
188 residents
Residents by payment source
Medicare
4 residents (2.1%)
Medicaid
164 residents (87.2%)
Private pay or other
20 residents (10.6%)
Programs & Services
Residents' Group

Residents meet regularly to discuss policies, care quality, and activities

Nurse Aide Training

State-approved Nurse Aide Training and Competency Evaluation Program on-site

Active Resident Council

Organized group of residents that meets regularly to discuss facility policies, quality of life, and activities.

Quality of care over time

These measures show how residents usually do over time at this home, based on health outcomes and preventive care.

High-risk clinical events score Info A composite score based on pressure ulcers, falls with injury, weight loss, walking ability decline, and activities of daily living decline. 4.8
28% better than California average

California average: 6.6

Functional decline score Info A composite score based on activities of daily living decline, walking ability decline, and incontinence. 6.0
47% better than California average

California average: 11.3

Long-stay resident measures
Significantly above average California avg: 4.3 Info CMS star rating based on long-stay quality measure performance. 5 stars = significantly above average, 1 star = significantly below average.
Need for Help with Daily Activities Increased Info Percent of long-stay residents whose need for help with daily activities has increased 4.3%
61% better than California average

California average: 11.1%

Walking Ability Worsened Info Percent of long-stay residents whose ability to move independently worsened 9.1%
24% better than California average

California average: 12.0%

Low Risk Residents with Bowel/Bladder Incontinence Info Percent of low risk long-stay residents who lose control of their bowels or bladder 4.6%
59% better than California average

California average: 11.3%

Falls with Major Injury Info Percent of long-stay residents experiencing one or more falls with major injury 1.4%
15% better than California average

California average: 1.7%

High Risk Residents with Pressure Ulcers Info Percent of long-stay high risk residents with pressure ulcers 3.5%
29% better than California average

California average: 5.0%

Urinary Tract Infection Info Percent of long-stay residents with a urinary tract infection 0.0%
100% better than California average

California average: 1.2%

Lost Too Much Weight Info Percent of long-stay residents who lose too much weight 5.5%
31% worse than California average

California average: 4.2%

Depressive Symptoms Info Percent of long-stay residents who have depressive symptoms 0.0%
100% better than California average

California average: 6.7%

Antipsychotic Use Info Percent of long-stay residents who received an antipsychotic medication 15.8%
57% worse than California average

California average: 10.1%

Pneumococcal Vaccine Info Percent of long-stay residents assessed and appropriately given the pneumococcal vaccine 99.9%
In line with California average

California average: 98.5%

Influenza Vaccine Info Percent of long-stay residents assessed and appropriately given the seasonal influenza vaccine 100.0%
In line with California average

California average: 98.2%

Hospitalizations per 1,000 days Info Number of hospitalizations per 1,000 long-stay resident days. 1.14
49% better than California average

California average: 2.25

ED visits per 1,000 days Info Number of outpatient emergency department visits per 1,000 long-stay resident days. 0.97
39% better than California average

California average: 1.59

Short-stay resident measures
Below average California avg: 3.5 Info CMS star rating based on short-stay quality measure performance. 5 stars = much above average, 1 star = much below average.
Pneumococcal Vaccine Info Percent of short-stay residents assessed and appropriately given the pneumococcal vaccine 100.0%
6% better than California average

California average: 94.0%

Antipsychotic medication increase Info Percent of short-stay residents who newly received an antipsychotic medication 0.0%
100% better than California average

California average: 1.5%

Influenza Vaccine Info Percent of short-stay residents assessed and appropriately given the seasonal influenza vaccine 100.0%
7% better than California average

California average: 93.2%

Falls with major injury Info Percentage of SNF residents who experience falls with major injury during their stay. 0.0%
100% better than California average

California average: 0.8%

Ability to care for self at discharge Info Percentage of residents at or above expected ability to care for themselves at discharge. 8.6%
84% worse than California average

California average: 53.7%

Guides for Better Senior Living

Care Cost Calculator: See Prices in Your Area

Nursing Home Data Explorer

Don’t Wait Too Long: 7 Red Flag Signs Your Parent Needs Assisted Living Now

The True Cost of Assisted Living in 2025 – And How Families Are Paying For It

Understanding Senior Living Costs: Pricing Models, Discounts & Financial Assistance

Financial Aid for California Seniors

Get financial aid guidance

Multipurpose Senior Services Program

MSSP (Medi-Cal Waiver)

Age 65+, California resident, Medi-Cal eligible, nursing home risk.

~$2,829/month (300% FBR, individual).

$2,000 (individual), $3,000 (couple).

County-managed; waitlists possible.

In-Home Supportive Services (IHSS)

California IHSS

Age 65+, California resident, Medicaid-eligible or low-income.

~$1,732/month (individual, Medi-Cal threshold).

$2,000 (individual).

Can hire family as caregivers.

Multipurpose Senior Services Program (MSSP)

CA MSSP

Age 65+, California resident, Medi-Cal-eligible, nursing home-eligible but community-capable.

~$2,829/month (300% FBR, individual).

$2,000 (individual).

Available in 38 counties; waitlists common.

Property Tax Postponement Program (PTP)

CA PTP

Age 62+, California resident, own and live in home, 40% equity.

~$51,500/year (household, adjusted annually).

Equity-based; no strict asset cap.

Deferred taxes accrue interest (5% as of 2024); repaid upon sale/death.

Assisted Living Waiver (ALW)

CA ALW

Age 65+ or disabled, California resident, Medi-Cal-eligible, nursing home-eligible.

~$2,829/month (300% FBR, individual).

$2,000 (individual).

Available in 15 counties (e.g., LA, Sacramento); waitlists common.

California CARES Program

CA CARES

Caregivers of California residents 60+ needing help with 3+ daily activities; no caregiver age limit.

No strict limit; cost-sharing above ~$2,500/month threshold.

Not applicable; need-based.

High demand in urban areas; complements IHSS respite.

Low-Income Home Energy Assistance Program (LIHEAP)

CA LIHEAP

Age 60+ priority, California resident, low-income, utility/heating need.

~$2,510/month (200% of poverty level, individual).

Not applicable; income-focused.

High demand in inland/coastal extremes; weatherization capped at $5,000/home.

Tour Icon
Planning a tour? Check our touring checklist.
Chat Icon
Thinking of living here? We can help you speak to a current resident