Explore Open Rooms

1 Contact details
2 What type of senior care service are you looking for?
3 What budget do you have in mind for senior care?
4 How soon do you need to find care?
5 Additional details

Thank you for your interest!

Our team will be in touch shortly to help with next steps.

Nursing Home in Indiana

CMS overall rating Info The Overall CMS Rating combines results from health inspections, staffing levels and quality measures. Health inspections carry the most weight. Staffing and quality scores can increase or decrease the final rating based on performance compared to state and national standards.

Vermillion Convalescent Center

1705 S Main St, Clinton, IN 47842 View map
Overview of Vermillion Convalescent Center

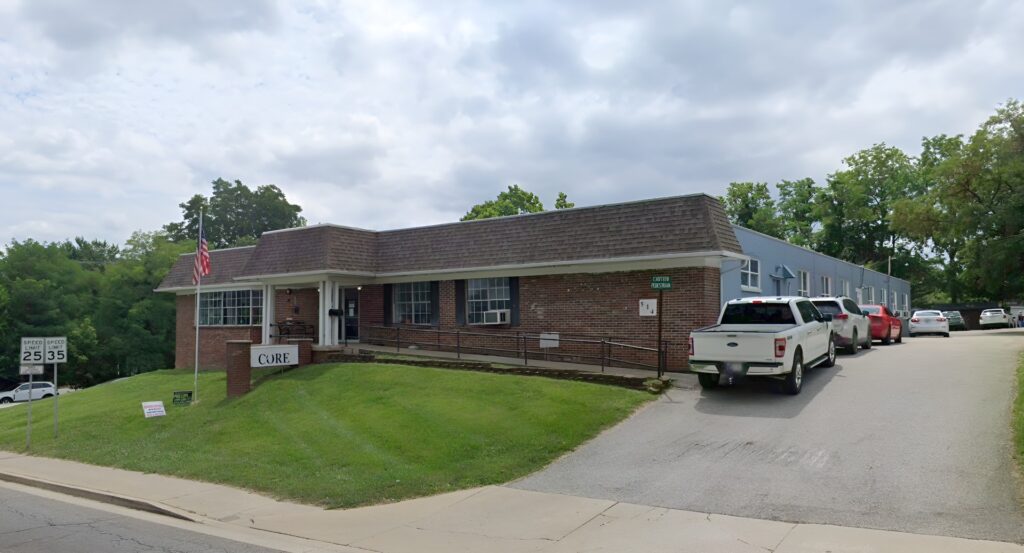
Enjoy the best of your golden years at Vermillion Convalescent Center, an exceptional community in Clinton, IN, offering skilled care, respiratory care, post-operative care, and palliative care. With comprehensive care options, residents receive top-notch care from a kind and highly trained team available around the clock. Medicare and Medicaid are also accepted to ease financial burdens.

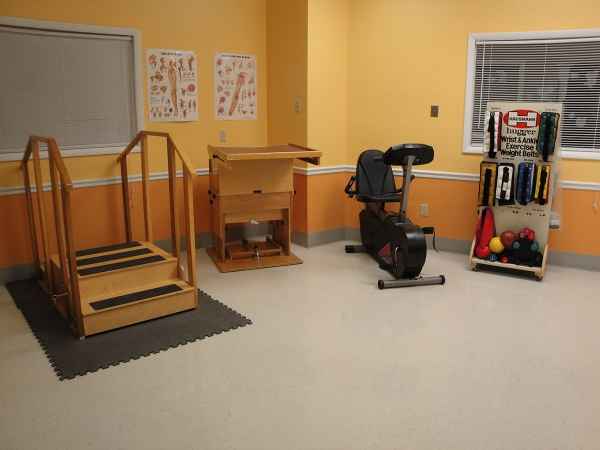
Physical, occupational, and speech therapy are provided to enhance residents’ living experiences. Medication management is also available to ensure residents take their prescriptions on time. The community’s wide range of care options and state-of-the-art amenities make it an ideal retirement option.

(765) 832-3573

Quality ratings

Measured by Centers for Medicare & Medicaid Services (CMS)

Overall rating Info The Overall CMS Rating combines results from health inspections, staffing levels and quality measures. Health inspections carry the most weight. Staffing and quality scores can increase or decrease the final rating based on performance compared to state and national standards.
3/5
Indiana average: 3.0/5
Health Inspection Info Based on the results of the facility's three most recent standard inspections and any complaint investigations. CMS reviews the number, scope, and severity of deficiencies, with more recent findings weighted more heavily.
4/5
Indiana average: 2.7/5
Staffing Info Measures average nursing staff hours per resident per day, including Registered Nurses (RNs) and total nursing staff. Ratings are adjusted based on the level of care residents require and are compared to state and national benchmarks.
2/5
Indiana average: 2.6/5
Quality Measures Info Based on clinical and physical health indicators reported to CMS, such as hospital readmissions, falls, pressure ulcers, and improvements in mobility. These measures reflect how well residents' health needs are being managed.
1/5
Indiana average: 4.1/5

Nursing care per resident

Info This shows how many total hours of nursing staff time are available per resident each day. Higher numbers usually mean more staff support.
3h 2m per day

This home provides 14% less nursing time per resident than the Indiana average.

Indiana average: 3h 32m per day

Staffing hours breakdown

Info Hours of care per resident per day, broken down by staff type. Data from CMS Medicare.
Staff type Facility State avg National avg
Registered Nurse (RN) Info Registered nurse hours per resident per day. 25m per day 40m per day 41m per day
Nurse Aide Info Nurse aide hours per resident per day. 2h 25m per day 2h 16m per day 2h 21m per day
Total Nursing (Weekend) Info Total number of nurse staff hours per resident per day on weekends. 2h 47m per day 3h 14m per day 3h 26m per day
Physical Therapist Info Physical therapist staff hours per resident per day. 5m per day 4m per day 4m per day
RN (Weekend) Info Registered nurse hours per resident per day on weekends. 17m per day 27m per day 29m per day

Capacity and availability

Medium-capacity home

Offers a balance of services and community atmosphere.

Total beds 100

This home usually has availability

Lower occupancy suggests more openings may be available.

Lower demand than the Indiana average
Occupancy rate 72%
Residents per day (avg) 75
Occupancy rate
72%
Residents per day (avg)
75

Who this home usually serves

TYPE OF STAY

Mostly short-term rehab stays

Most residents typically stay for a few weeks or months before returning home or moving on.

Might be optimal for
Short stays Recovery Medicare-covered care

Breakdown by payment type

Medicare

53% of new residents, usually for short-term rehab.

Typical stay 3 months

Private pay

16% of new residents, often for short stays.

Typical stay 2 years

Medicaid

31% of new residents, often for long-term daily care.

Typical stay 3 years

Finances and operations

Governmental community
Operated by county authorities.
Home revenue
$8.6M
Operating deficit
-$427.8K
Governmental community Operated by county authorities.
Home revenue
$8,587,152.00
Operating deficit
$-427,775.00
Payroll costs Info The portion of the home's budget spent on staff, including nurses, caregivers, and other employees who support care and operations.
$3.3M
38.7% of revenue
Other operating costs Info All remaining costs needed to run the home, such as food, utilities, building maintenance, supplies and administrative expenses.
$5.7M
Total costs $9.0M
Bed community size
100-bed community
A larger shared setting that may offer more common spaces and organized community services.
Years in operation
2 years in operation
A newer community that may feature more recent facilities and programs.
Walk Score
Walk Score: 3 / 100
Car-dependent. Most errands require a car, with limited nearby walkable options.

About this community

Occupancy

Occupancy rate
72%
6% higher than Indiana average

Indiana average: 68%

Occupied beds
72 / 100
Average residents 70 per day

License Details

Facility TypeNursing Home (skilled Nursing Facility)
IssuanceJanuary 11, 2024
ExpirationOctober 31, 2025

Additional Licensing Details

License Number24-000052-1
CMS Certification Number155124

Ownership & Operating Entity

Vermillion Convalescent Center is legally operated by Board Of Trustees Of Flavius J Witham Memorial, and administrated by Melissa Gum.

Profit StatusOTHER

Type Of Units

SNF/NF (Combined)
100 units
Total beds
100 units

Staffing

Key information about the people who lead and staff this community.

Leadership

Director of NursingAMANDA DOWELL

Contact Information

Fax(765) 832-3420

What does this home offer?

Accepts Medicaid icon

Accept Medicaid: Yes

Building type icon
Building type icon

Building Type: Single-story

On-site medical care and health services icon

On-site Medical Care and Health Services

Social and recreational activities icon

Social and Recreational Activities

Types of Care at Vermillion Convalescent Center

Nursing Home
Contact Vermillion Convalescent Center

Inspection History

In Indiana, the Department of Health, Division of Long Term Care is the primary regulatory body that performs onsite inspections and quality of care reviews for all licensed facilities.

Inspection Overview

16 total visits · Indiana avg: 19

Ranked 157th of 388 in Indiana

6 Inspections Indiana avg: 13 54% below Indiana avg
6 Complaint Visits Indiana avg: 8 25% below Indiana avg Ranked 148th of 367 2 formal complaints filed · avg: 5 Formal complaints can result in multiple visits
6 Visits with Citations Indiana avg: 7 14% below Indiana avg
24 Citations Total Indiana avg: 34 29% below Indiana avg Ranked 171st of 385
10 Visits without Citations Indiana avg: 12 17% below Indiana avg

2 complaints

Formal expressions of dissatisfaction or concern made by residents, or their families regarding various aspects of the care, services, and environment provided.

Indiana average: 5 complaints

Latest inspection

Date August 19, 2025
Routine

24 total citations

Citations indicate regulatory violations. A higher number implies the facility had several areas requiring improvement.

Indiana average: 34 citations

45 deficiencies

Deficiencies indicate regulatory issues. A higher number implies the facility had several areas requiring improvement.

Indiana average: 36 deficiencies

Inspection Report Summary for Vermillion Convalescent Center

The most recent inspection on June 30, 2025, found no deficiencies related to complaint investigations. Earlier inspections showed a pattern of deficiencies primarily involving Life Safety Code compliance, such as door closures, fire safety equipment, and electrical protections, as well as issues with resident care documentation and medication management. A substantiated complaint in November 2023 cited improper use of physical restraints, resulting in staff re-education and termination, but no fines or license actions were listed in the available reports. Most complaint investigations were unsubstantiated or found no related deficiencies. The facility’s recent inspections indicate improvement in compliance, particularly with no deficiencies noted in the latest complaint investigations and follow-up surveys confirming correction of prior Life Safety Code issues.

Health Inspection History

Inspections
Total health inspections 4

Indiana average 6


Last Health inspection on Jul 2024

Total health citations 15

Indiana average 25

Citations per inspection
3.75

Indiana average 4.12


Health citations are formal notices following inspections when they fail to comply with safety and care standards.

14 of 15 citations resulted from standard inspections; and 1 of 15 resulted from complaint investigations.

Breakdown of citation severity (last 3 years)
Critical Health citations More info 0
100% better than Indiana average

Indiana average: 0.2


Serious Health citations More info 0
100% better than Indiana average

Indiana average: 0.6

0 critical citations More info Indiana average: 0.2

0 serious citations More info Indiana average: 0.6

15 moderate citations More info Indiana average: 23.8

0 minor citations More info Indiana average: 0.4
Citations history (last 3 years)
Pharmacy moderate citation Info Issues related to medication management, including how drugs are stored, administered, and monitored. Jul 22, 2024
Corrected

Quality of Care moderate citation Info Issues related to how well residents receive appropriate treatment and support for their medical and daily care needs. Jul 22, 2024
Corrected

Care Planning moderate citation Info Issues related to creating and updating personalized care plans for residents based on their needs and conditions. Jul 22, 2024
Corrected

Resident Rights moderate citation Info Issues related to resident's rights, including dignity, privacy, and the ability to make decisions about their care. Jul 22, 2024
Corrected

Compare Nursing Homes around Indiana The information below is reported by the Indiana Department of Health, Division of Long Term Care.

5 facilities compared · CMS & IN Dept. of Health data · Updated Apr 2026

Filter by care type
Vermillion Convalescent Center
NH

Nursing Home Licensed facility providing 24/7 skilled nursing care for residents with complex, ongoing medical needs. Staffed by RNs, LPNs, and CNAs. Inspected and star-rated annually by CMS. Accepts Medicare (short-term rehab) and Medicaid (long-term care).

Clinton
119
72.0%
+4%
3.04
-11%
-12%
0
15
3.8
0
75
3
Magnolia Health Management Xxvii, Llc
$8.6M
$3.3M
38.6%
155124
-
Core of Bedford
NH

Nursing Home Licensed facility providing 24/7 skilled nursing care for residents with complex, ongoing medical needs. Staffed by RNs, LPNs, and CNAs. Inspected and star-rated annually by CMS. Accepts Medicare (short-term rehab) and Medicaid (long-term care).

Bedford
37
86.5%
+25%
3.03
-57%
-12%
0
15
2.5
1
32
65
Core Of Bedford Inc
$2.4M
$1.6M
68.9%
155388
-
Freelandville Community Home
NH

Nursing Home Licensed facility providing 24/7 skilled nursing care for residents with complex, ongoing medical needs. Staffed by RNs, LPNs, and CNAs. Inspected and star-rated annually by CMS. Accepts Medicare (short-term rehab) and Medicaid (long-term care).

Freelandville
50
70.0%
+1%
3.19
+29%
-7%
0
15
5.0
1
28
0
Freelandville Community Home, Inc.
$3.0M
$1.7M
56.9%
155688
-
Morgantown Woods of Journey
NH

Nursing Home Licensed facility providing 24/7 skilled nursing care for residents with complex, ongoing medical needs. Staffed by RNs, LPNs, and CNAs. Inspected and star-rated annually by CMS. Accepts Medicare (short-term rehab) and Medicaid (long-term care).

Morgantown
39
76.9%
+11%
2.75
-
-20%
0
0
0.0
0
35
44
Major Hospital
-
-
-
-
Private / Shared Suites
Hillside Manor Nursing Home
-
NH

Nursing Home Licensed facility providing 24/7 skilled nursing care for residents with complex, ongoing medical needs. Staffed by RNs, LPNs, and CNAs. Inspected and star-rated annually by CMS. Accepts Medicare (short-term rehab) and Medicaid (long-term care).

-
48
77.1%
+11%
-
-
-
-
-
-
0
0
0.0
0
-
57
Major Hospital
-
-
-
-
-

Places of interest near Vermillion Convalescent Center

Address 1.2 miles from city center

Address 1705 S Main St, Clinton, IN 47842

Calculate Travel Distance to Vermillion Convalescent Center

Add your location

Address

Staffing Data (Q2 2025)

This data corresponds to Q2 2025 and is based on CMS Payroll-Based Journal.

Total staff 107
Employees 92
Contractors 15
Staff to resident ratio 1.41:1
1407795% better than Indiana average

Indiana average ratio: 0.00:1

Avg staff/day 44
Average shift 7.4 hours
0% compared with Indiana average

Indiana average: 7.7 hours

Total staff hours (quarter) 29,497
Nursing staff breakdown
Registered Nurse

Manages medical care and health needs.

Total count 9
Average shift length Info Average shift length. Calculated as total hours divided by days worked and average staff per day. 8.2 hours

This role is partially covered by contractors.

Licensed Practical Nurse

Assists with medical care and medications.

Total count 12
Average shift length Info Average shift length. Calculated as total hours divided by days worked and average staff per day. 7.9 hours

No contractors work on this role.

Certified Nursing Assistant

Helps with daily care and mobility.

Total count 47
Average shift length Info Average shift length. Calculated as total hours divided by days worked and average staff per day. 7.2 hours

This role is partially covered by contractors.

Contractor staffing

Total hours from contractors

9.1%

2,692 contractor hours this quarter

Certified Nursing Assistant: 2 Qualified Social Worker: 2 Physical Therapy Aide: 2 Medication Aide/Technician: 1 Registered Nurse: 1 Physical Therapy Assistant: 1 Respiratory Therapy Technician: 1 Qualified Activities Professional: 1 Speech Language Pathologist: 1 Occupational Therapy Aide: 1 Medical Director: 1 Occupational Therapy Assistant: 1
Staff by category
Certified Nursing Assistant4524711,81091100%7.2
Licensed Practical Nurse120124,24091100%7.9
Other Dietary Services Staff8083,05091100%7.4
Medication Aide/Technician7182,5408796%7.9
Registered Nurse8192,50991100%8.2
Administrator2029846571%8
Nurse Aide in Training6067937279%7.3
Qualified Social Worker0226106673%5.7
Nurse Practitioner1015645864%9.7
Dietitian1014906673%7.4
Physical Therapy Assistant0114667279%6.5
Physical Therapy Aide0224626571%7
Respiratory Therapy Technician0114346470%6.8
Qualified Activities Professional1122683741%7.2
Occupational Therapy Aide0111122325%4.9
Speech Language Pathologist011801213%6.6
Mental Health Service Worker1014055%8
Occupational Therapy Assistant0113155%6.2
Medical Director0111455%2.8
47 Certified Nursing Assistant
% of Days 100%
12 Licensed Practical Nurse
% of Days 100%
8 Other Dietary Services Staff
% of Days 100%
8 Medication Aide/Technician
% of Days 96%
9 Registered Nurse
% of Days 100%
2 Administrator
% of Days 71%
6 Nurse Aide in Training
% of Days 79%
2 Qualified Social Worker
% of Days 73%
1 Nurse Practitioner
% of Days 64%
1 Dietitian
% of Days 73%
1 Physical Therapy Assistant
% of Days 79%
2 Physical Therapy Aide
% of Days 71%
1 Respiratory Therapy Technician
% of Days 70%
2 Qualified Activities Professional
% of Days 41%
1 Occupational Therapy Aide
% of Days 25%
1 Speech Language Pathologist
% of Days 13%
1 Mental Health Service Worker
% of Days 5%
1 Occupational Therapy Assistant
% of Days 5%
1 Medical Director
% of Days 5%

Facility Characteristics

Source: CMS Long-Term Care Facility Characteristics (Data as of Jan 2026)

Total census
76 residents
Residents by payment source
Medicare
11 residents (14.5%)
Medicaid
52 residents (68.4%)
Private pay or other
13 residents (17.1%)
Programs & Services
Residents' Group

Residents meet regularly to discuss policies, care quality, and activities

Nurse Aide Training

State-approved Nurse Aide Training and Competency Evaluation Program on-site

Active Resident Council

Organized group of residents that meets regularly to discuss facility policies, quality of life, and activities.

Quality of care over time

These measures show how residents usually do over time at this home, based on health outcomes and preventive care.

High-risk clinical events score Info A composite score based on pressure ulcers, falls with injury, weight loss, walking ability decline, and activities of daily living decline. 16.2
102% worse than Indiana average

Indiana average: 8.0

Functional decline score Info A composite score based on activities of daily living decline, walking ability decline, and incontinence. 28.1
65% worse than Indiana average

Indiana average: 17.1

Long-stay resident measures
Significantly below average Indiana avg: 4.3 Info CMS star rating based on long-stay quality measure performance. 5 stars = significantly above average, 1 star = significantly below average.
Need for Help with Daily Activities Increased Info Percent of long-stay residents whose need for help with daily activities has increased 27.0%
124% worse than Indiana average

Indiana average: 12.0%

Walking Ability Worsened Info Percent of long-stay residents whose ability to move independently worsened 33.0%
130% worse than Indiana average

Indiana average: 14.4%

Low Risk Residents with Bowel/Bladder Incontinence Info Percent of low risk long-stay residents who lose control of their bowels or bladder 24.2%
In line with Indiana average

Indiana average: 24.6%

Falls with Major Injury Info Percent of long-stay residents experiencing one or more falls with major injury 7.5%
95% worse than Indiana average

Indiana average: 3.9%

High Risk Residents with Pressure Ulcers Info Percent of long-stay high risk residents with pressure ulcers 4.8%
9% worse than Indiana average

Indiana average: 4.4%

Urinary Tract Infection Info Percent of long-stay residents with a urinary tract infection 7.2%
494% worse than Indiana average

Indiana average: 1.2%

Lost Too Much Weight Info Percent of long-stay residents who lose too much weight 8.5%
50% worse than Indiana average

Indiana average: 5.7%

Depressive Symptoms Info Percent of long-stay residents who have depressive symptoms 28.4%
18% worse than Indiana average

Indiana average: 24.1%

Antipsychotic Use Info Percent of long-stay residents who received an antipsychotic medication 11.8%
5% better than Indiana average

Indiana average: 12.4%

Pneumococcal Vaccine Info Percent of long-stay residents assessed and appropriately given the pneumococcal vaccine 100.0%
7% better than Indiana average

Indiana average: 93.7%

Influenza Vaccine Info Percent of long-stay residents assessed and appropriately given the seasonal influenza vaccine 100.0%
5% better than Indiana average

Indiana average: 95.4%

Hospitalizations per 1,000 days Info Number of hospitalizations per 1,000 long-stay resident days. 2.35
47% worse than Indiana average

Indiana average: 1.60

ED visits per 1,000 days Info Number of outpatient emergency department visits per 1,000 long-stay resident days. 2.34
58% worse than Indiana average

Indiana average: 1.48

Short-stay resident measures
Average Indiana avg: 2.6 Info CMS star rating based on short-stay quality measure performance. 5 stars = much above average, 1 star = much below average.
Pneumococcal Vaccine Info Percent of short-stay residents assessed and appropriately given the pneumococcal vaccine 98.3%
20% better than Indiana average

Indiana average: 81.7%

Antipsychotic medication increase Info Percent of short-stay residents who newly received an antipsychotic medication 1.3%
5% better than Indiana average

Indiana average: 1.4%

Influenza Vaccine Info Percent of short-stay residents assessed and appropriately given the seasonal influenza vaccine 100.0%
27% better than Indiana average

Indiana average: 79.0%

Re-hospitalized after SNF stay Info Percentage of short-stay residents who were re-hospitalized after their nursing home admission. 29.7%
33% worse than Indiana average

Indiana average: 22.4%

Emergency department visits Info Percentage of short-stay residents who had an outpatient emergency department visit. 3.7%
65% better than Indiana average

Indiana average: 10.5%

Falls with major injury Info Percentage of SNF residents who experience falls with major injury during their stay. 2.0%
160% worse than Indiana average

Indiana average: 0.8%

Ability to care for self at discharge Info Percentage of residents at or above expected ability to care for themselves at discharge. 68.8%
28% better than Indiana average

Indiana average: 53.7%

Successful return to home or community Info Rate of successful return to home or community from a skilled nursing facility. 50.8%
In line with Indiana average

Indiana average: 50.6%

Guides for Better Senior Living

Care Cost Calculator: See Prices in Your Area

Nursing Home Data Explorer

Don’t Wait Too Long: 7 Red Flag Signs Your Parent Needs Assisted Living Now

The True Cost of Assisted Living in 2025 – And How Families Are Paying For It

Understanding Senior Living Costs: Pricing Models, Discounts & Financial Assistance

Financial Aid for Indiana Seniors

Get financial aid guidance

Aged and Disabled Waiver

Indiana Medicaid A&D Waiver

Age 65+ or disabled, Indiana resident, Medicaid-eligible, nursing home-level care need.

~$2,829/month (300% FBR, individual).

$2,000 (individual), $3,000 (couple).

Requires level-of-care determination.

CHOICE Program

Indiana CHOICE

Age 60+, Indiana resident, at risk of nursing home.

~$2,000/month (varies).

$10,000 (individual).

Limited funding; regional variation.

Residential Care Assistance Program (RCAP)

Indiana Residential Care Assistance Program

Age 65+, or blind, or disabled, Indiana resident, in approved facility, low-income or SSI recipient.

~$1,004/month (including SSI).

$2,000 (individual), $3,000 (couple).

~50 facilities statewide; per diem rate set by FSSA.

Medicare Savings Program (MSP)

Indiana Medicare Savings Program

Age 65+ or disabled, Indiana resident, Medicare Part A/B.

~$2,510/month (QMB), ~$3,380/month (SLMB), ~$3,598/month (QI)—individual.

$9,430 (individual), $14,130 (couple).

Three tiers; no waitlist.

National Family Caregiver Support Program (NFCSP) Respite

Indiana NFCSP Respite Care

Caregivers of 60+ needing care or 55+ caregivers of others; Indiana resident; functional needs (2+ ADLs).

Prioritizes ~$24,980/year (individual); no strict cap.

Not assessed; need-based.

16 AAAs; prioritizes low-income, rural caregivers.

Senior Community Service Employment Program (SCSEP)

Indiana SCSEP

Age 55+, unemployed, low-income, Indiana resident.

~$1,983/month (125% FPL).

Not specified; income-focused.

Priority for veterans, rural residents.

VA Aid and Attendance (A&A) and Housebound Benefits

Indiana VA Aid and Attendance/Housebound

Age 65+ or disabled veteran/spouse, Indiana resident, wartime service, need for ADL help (A&A) or homebound.

Net income < ~$1,984/month (veteran with dependent, A&A); pension offsets income.

~$155,356 (net worth limit).

High veteran demand statewide.