


Village House of Ludington
Nursing Home, Assisted Living & Independent Living · Ludington, MI


Village House of Ludington
Nursing Home, Assisted Living & Independent Living · Ludington, MI
Overview of Village House of Ludington
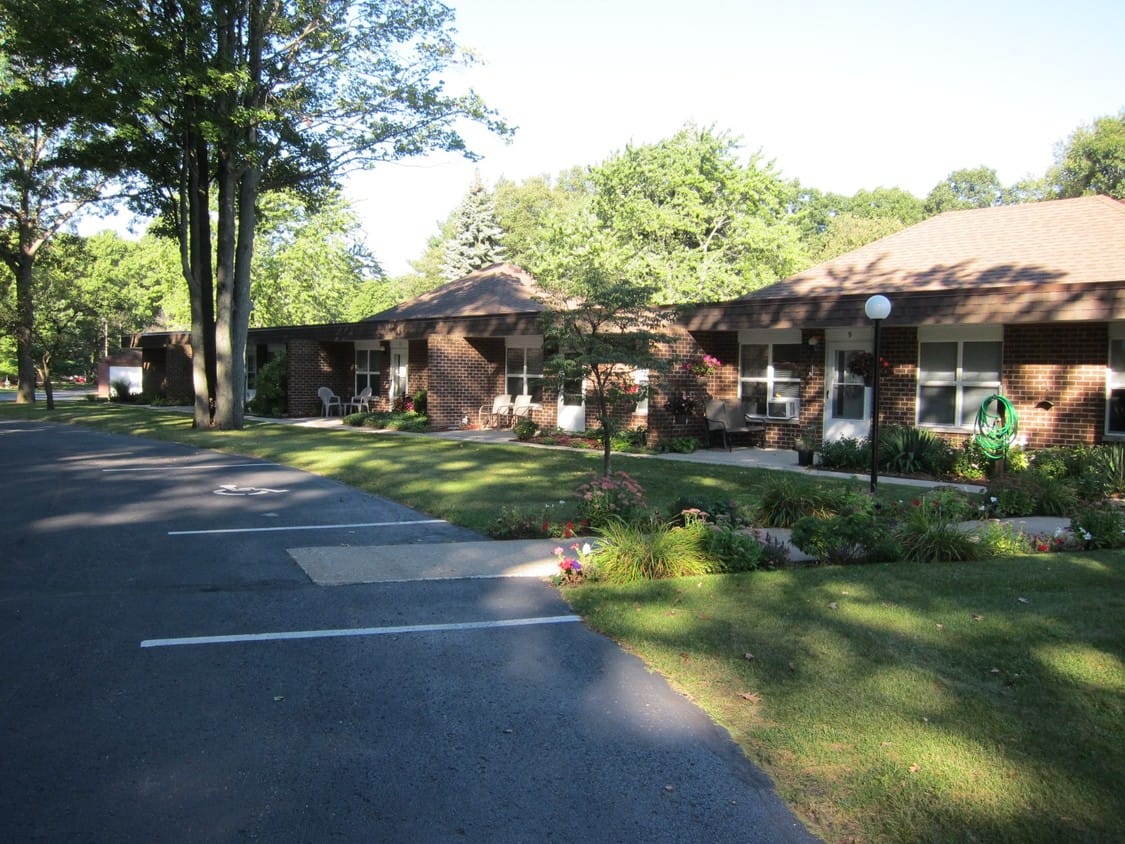
Nestled in the charming neighborhood of East Tinkham Avenue, Ludington, MI, Village House of Ludington is an idyllic senior living community offering assisted living, independent living, and in-home care. With top-tier care and assistance a kind and well-trained team around the clock, seniors can rest assured of enjoying unparalleled comfort and convenience. The community strives to understand seniors’ needs and aspirations to craft personalized care plans.
Promoting a nurturing and inviting atmosphere, the community empowers residents to live their best lives. Residents do not have to worry about meals with healthy and delicious dining options served to cater to their dietary needs and tastes. Village House of Ludington is a good place for seniors looking for various care with its comprehensive care services.
12-bed community Rank #385 / 430Bed count — State benchmarkedThis home is ranked 385th out of 430 homes in Michigan for bed count. Shows this facility's certified or reported bed count compared to other Michigan facilities. Larger communities may offer more amenities, programs, and on-site services for residents and families.Facilities with the same value for a metric share the same rank. Rankings are based only on facilities in Michigan that report data for that category. Facilities without available data are excluded from the ranking.Click the rank badge to see the full State ranking.Click here to see the full State ranking.
A smaller, more intimate setting that may offer a quieter environment and closer staff-resident interactions.
1 year in operation Rank #76 / 136Years in operation — State benchmarkedThis home is ranked 76th out of 136 homes in Michigan for years in operation. Shows how long this facility has been in operation compared to other Michigan facilities. Longer operating histories may benefit residents, families, and staff.Facilities with the same value for a metric share the same rank. Rankings are based only on facilities in Michigan that report data for that category. Facilities without available data are excluded from the ranking.Click the rank badge to see the full State ranking.Click here to see the full State ranking.
A newer community that may feature more recent facilities and programs.
Walk Score: 33 / 100 Rank #404 / 703Walk Score — State benchmarkedThis home is ranked 404th out of 703 homes in Michigan for walk score. Shows how walkable this facility's neighborhood is compared to the average walk score across Michigan facilities. Higher scores benefit residents, families, and staff.Facilities with the same value for a metric share the same rank. Rankings are based only on facilities in Michigan that report data for that category. Facilities without available data are excluded from the ranking.Click the rank badge to see the full State ranking.Click here to see the full State ranking.
Somewhat walkable. A few nearby services may be reachable on foot, but most trips require transportation.
BBB Rating: A+ (Not Accredited)
An independent rating from the Better Business Bureau based on factors such as complaint history, transparency, and business practices.
How BBB ratings work
How BBB ratings work
About this community
Facility TypeAdult Medium Group Home (capacity 7-12)
StatusRegular
IssuanceJanuary 10, 2025
ExpirationJanuary 9, 2027
CountyMason
License NumberAM530398793
Village House of Ludington is legally operated by Village Manor Of Ludington, Inc.
Safety FeaturesSecurity System, 24-hour Emergency System
Staffing
Key information about the people who lead and staff this community.
ContactMs. Roxanne Antczak, Manager (per BBB, record updated Jul 2026)
Rehabilitation Services
24-Hour Staffing
Home Care
Salon
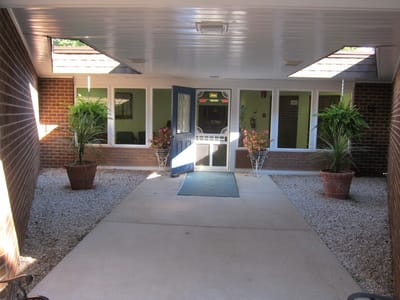
Patio
Transportation
Wifi
Housekeeping
Laundry
ActivitiesDaily activities are included with rent, featuring options like Bible studies, exercise classes, bingo, themed parties, live entertainment, and social hours
Wellness ProgramDaily exercise classes
Specific ProgramsCommunity Perks
Volunteer Program
Starting Price$1,450 per month
Inspection History
In Michigan, the Department of Licensing and Regulatory Affairs (LARA) conducts unannounced inspections and investigations to ensure long-term care facilities comply with state health codes.
Since 2020 · 6 years of data
0 deficiencies
3 inspections
Inspection Scorecard
 This scorecard compares key inspection, deficiency, and complaint metrics at this facility against the Michigan state average. Metrics rated ≥15% worse than average are highlighted in red; those ≥15% better are highlighted in green.
Since 2020 vs. Michigan state average
Overall vs. MI average
0 Worse
No metrics in this bucket.
1 Better
Metrics better than Michigan average:
• Total deficiencies (100% below)
• Total deficiencies (100% below)
Deficiencies
| This Facility | MI Average | vs. MI Avg |
|---|---|---|---|
|
Total deficiencies
| 0 | 8 | This facility has 100% fewer total deficiencies than a typical Michigan nursing home (0 vs. MI avg 8).↓ 100% better |
Inspections
| This Facility | MI Average | vs. MI Avg |
|---|---|---|---|
|
Total inspections
| 3 | 5 | This facility has had 40% fewer total inspections than the Michigan average (3 vs. MI avg 5). More inspections can mean more regulatory scrutiny rather than worse care.↓ 40% fewer |
Inspection Reports Summary
An editor-reviewed summary of the themes and findings across this facility's recent inspection reports.
- January 6, 2025 renewal inspection found no deficiencies and confirmed substantial compliance with all licensing rules and statutes.
- January 5, 2023 renewal inspection also found substantial compliance with no complaints or deficiencies noted.
- August 5, 2020 original licensing inspection found the facility met physical, staffing, and administrative standards and issued a temporary license for 12 residents.
What does this home offer?
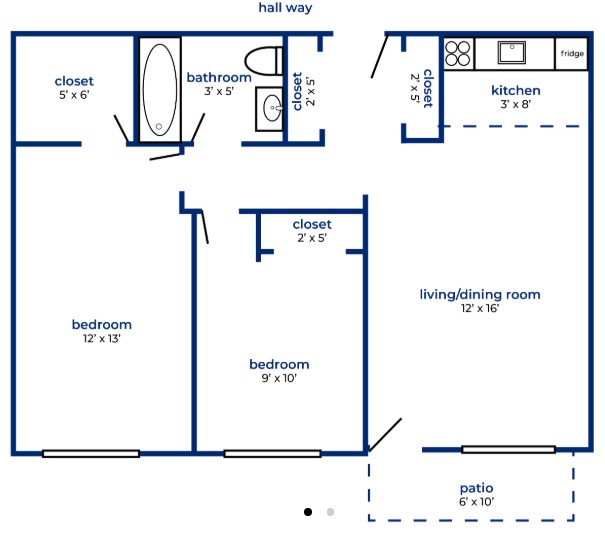
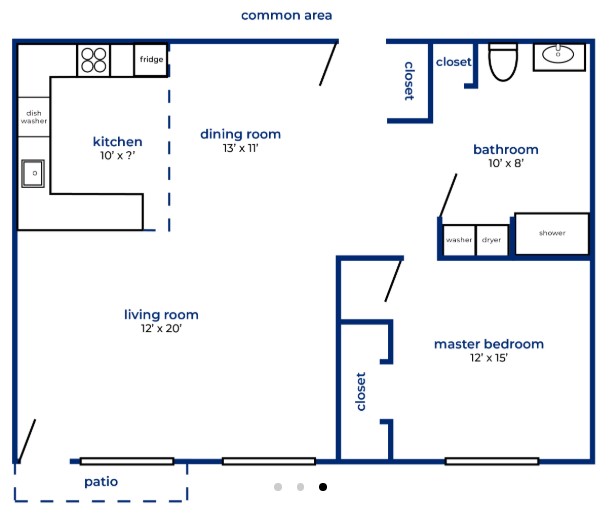
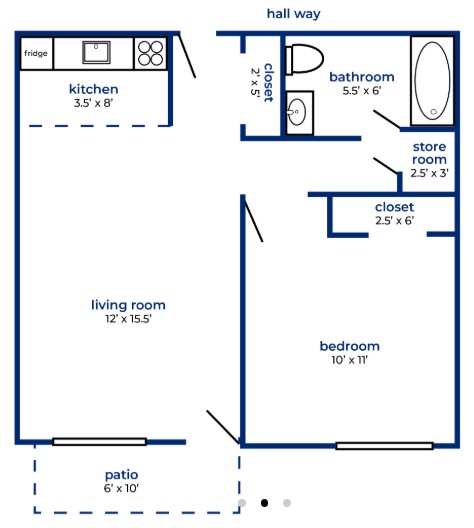
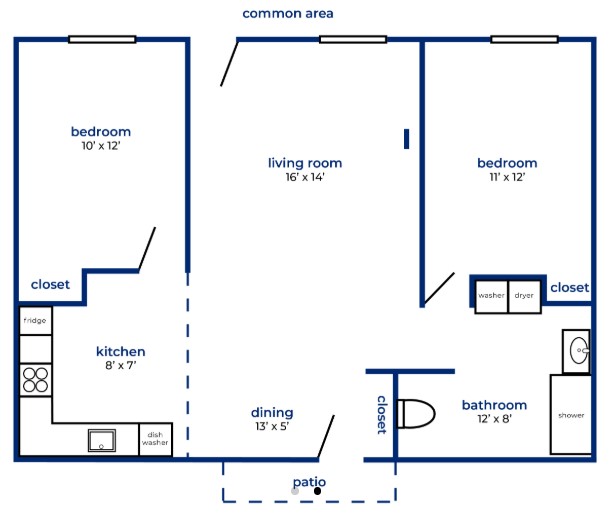
Room Sizes: 483 / 575 / 651 / 874 sq. ft
Housing Options: 1 Bed / 2 Bed
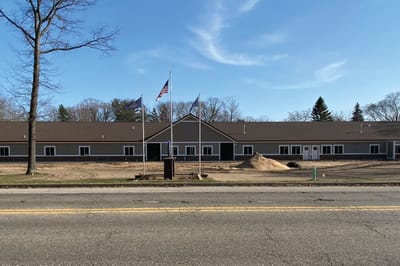
Building Type: Single-story
Transportation Services
Fitness and Recreation
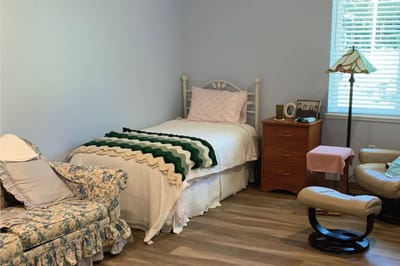
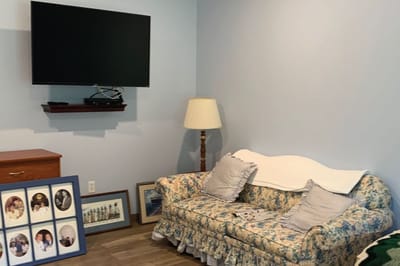
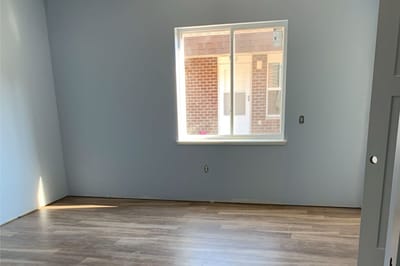
Living Spaces & Floor Plans for Village House of Ludington
Places of interest near Village House of Ludington
![]() 1.7 miles from city center
1.7 miles from city center
![]() Estimated distance in miles from Ludington's city center to Village House of Ludington's address, calculated via Google Maps.
Estimated distance in miles from Ludington's city center to Village House of Ludington's address, calculated via Google Maps.
Calculate Travel Distance to Village House of Ludington
Add your location
Financial Assistance for
Nursing Home in Michigan
Village House of Ludington is located in Ludington, Michigan.
Here are the financial assistance programs available to residents in Michigan.
Frequently Asked Questions about Village House of Ludington
Who is the owner of Village House of Ludington?
Village House of Ludington is legally operated by Village Manor Of Ludington, Inc.
Is Village House of Ludington in a walkable area?
Village House of Ludington has a walk score of 33. Somewhat walkable. A few nearby services may be reachable on foot, but most trips require transportation.
What is the license number of Village House of Ludington?
According to MI state health department records, Village House of Ludington's license number is AM530398793.
When does Village House of Ludington's license expire?
According to MI state health department records, Village House of Ludington's license expires on January 9, 2027.
How long has Village House of Ludington been in business?
Village House of Ludington has been operating for approximately 1 year, based on available licensing and registration records.
Are pets allowed at Village House of Ludington?
No, Village House of Ludington has a no-pet policy.
How many beds does Village House of Ludington have?
Village House of Ludington has 12 beds.
Guides for Better Senior Living
Care Cost Calculator: See Prices in Your Area
Nursing Home Data Explorer
Don’t Wait Too Long: 7 Red Flag Signs Your Parent Needs Assisted Living Now
The True Cost of Assisted Living in 2025 – And How Families Are Paying For It
Understanding Senior Living Costs: Pricing Models, Discounts & Financial Assistance
Updated on
