Explore Open Rooms

1 Contact details
2 What type of senior care service are you looking for?
3 What budget do you have in mind for senior care?
4 How soon do you need to find care?
5 Additional details

Thank you for your interest!

Our team will be in touch shortly to help with next steps.

Nursing Home

Waterbury Center for Nursing and Rehabilitation

Nursing Home

Waterbury Center for Nursing and Rehabilitation

177 Whitewood Rd, Waterbury, CT 06708 View map
Overview of Waterbury Center for Nursing and Rehabilitation

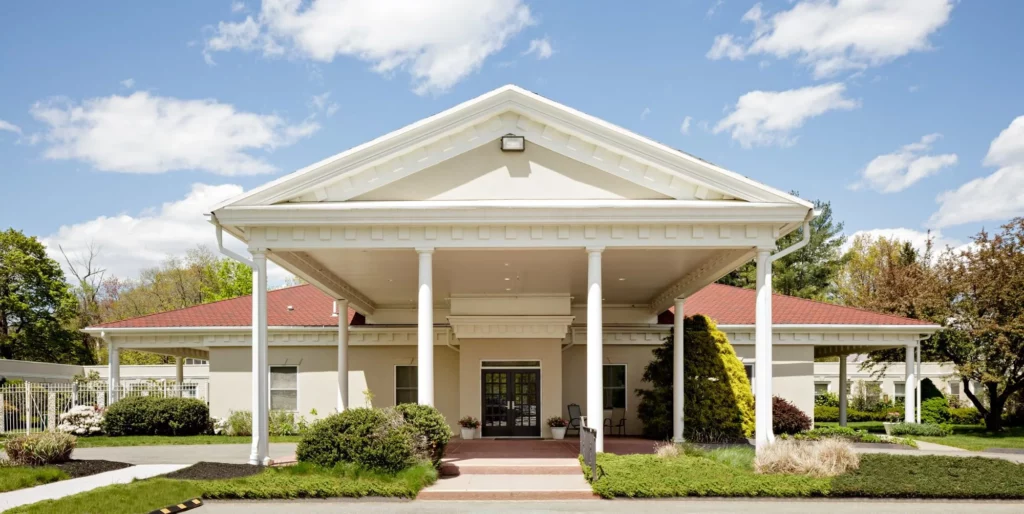
Waterbury Center for Nursing and Rehabilitation caters to the diverse needs of seniors, offering a range of clinical programs tailored for short-term rehabilitation or long-term skilled nursing care. With a highly regarded team of professional staff, residents can expect nothing less than top-notch care and expertise in various specialized services, including IV therapy, psych services, wound care, orthopedic care, hospice care, respite care, and dedicated dementia care.
The center also takes pride in its unique amputee rehab program, specifically designed to restore balance and mobility, empowering countless individuals to regain their maximum functionality. The facility’s commitment to clinical excellence ensures that each resident’s unique needs are met with utmost attention and expertise. From short-term rehabilitation to long-term skilled nursing, every aspect of care is carefully tailored to promote the well-being and comfort of those who call this place their home.

Quality ratings

Measured by Centers for Medicare & Medicaid Services (CMS)

Overall rating Info The Overall CMS Rating combines results from health inspections, staffing levels and quality measures. Health inspections carry the most weight. Staffing and quality scores can increase or decrease the final rating based on performance compared to state and national standards.
2/5
Connecticut average: 3.4/5
Health Inspection Info Based on the results of the facility's three most recent standard inspections and any complaint investigations. CMS reviews the number, scope, and severity of deficiencies, with more recent findings weighted more heavily.
2/5
Connecticut average: 3.1/5
Staffing Info Measures average nursing staff hours per resident per day, including Registered Nurses (RNs) and total nursing staff. Ratings are adjusted based on the level of care residents require and are compared to state and national benchmarks.
4/5
Connecticut average: 3.4/5
Quality Measures Info Based on clinical and physical health indicators reported to CMS, such as hospital readmissions, falls, pressure ulcers, and improvements in mobility. These measures reflect how well residents' health needs are being managed.
4/5
Connecticut average: 3.6/5

Nursing care per resident

Info This shows how many total hours of nursing staff time are available per resident each day. Higher numbers usually mean more staff support.
4h 22m per day

This home provides 7% more nursing time per resident than the Connecticut average.

Connecticut average: 4h 4m per day

Staffing hours breakdown

Info Hours of care per resident per day, broken down by staff type. Data from CMS Medicare.
Staff type Facility State avg National avg
Registered Nurse (RN) Info Registered nurse hours per resident per day. 45m per day 42m per day 41m per day
Nurse Aide Info Nurse aide hours per resident per day. 2h 15m per day 2h 17m per day 2h 21m per day
Total Nursing (Weekend) Info Total number of nurse staff hours per resident per day on weekends. 3h 4m per day 3h 25m per day 3h 26m per day
RN (Weekend) Info Registered nurse hours per resident per day on weekends. 25m per day 28m per day 29m per day

Capacity and availability

Medium-capacity home

Offers a balance of services and community atmosphere.

Total beds 120

This home usually has limited availability

Occupancy is moderate, suggesting balanced demand.

Similar demand to the Connecticut average
Occupancy rate 90%
Residents per day (avg) 107
Occupancy rate
90%
Residents per day (avg)
107

Who this home usually serves

TYPE OF STAY

Mostly long-term care residents

Most residents stay for extended periods and receive ongoing daily care.

Might be optimal for
Long-term daily care Ongoing support needs

Breakdown by payment type

Medicare

43% of new residents, usually for short-term rehab.

Typical stay 1 - 2 months

Private pay

6% of new residents, often for short stays.

Typical stay 7 months

Medicaid

51% of new residents, often for long-term daily care.

Typical stay 12 months

Finances and operations

Privately-owned community
Operated by a partnership between two or more business owners.
Home revenue
$14.7M
Operating loss
-$974.9K
Privately-owned community Operated by a partnership between two or more business owners.
Home revenue
$14,659,007.00
Operating loss
$-974,876.00
Payroll costs Info The portion of the home's budget spent on staff, including nurses, caregivers, and other employees who support care and operations.
$7.8M
53% of revenue
Other operating costs Info All remaining costs needed to run the home, such as food, utilities, building maintenance, supplies and administrative expenses.
$7.9M
Total costs $15.6M
Years in operation
4 years in operation
An established community with some operational experience and growing routines.
Walk Score
Walk Score: 39 / 100
Somewhat walkable. A few nearby services may be reachable on foot, but most trips require transportation.

Services

Alzheimers
Dementia Care
Hospice
Oncology
Pain Management
Pulmonary And Vascular Management
Recreation
Rehabilitation Therapy

About this community

Occupancy

Occupancy rate
90%
In line with Connecticut average
Occupied beds
108 / 120
Average residents 102 per day

License details

Facility type
Chronic & Convalescent Nursing Home
Status Active
Issuance July 11, 2021
Expiration September 30, 2027

Additional licensing details

License number: 2469

Room costs

Private Room (2 rooms) $475 per day
Semi-Private Room (59 rooms) $450 per day

Staffing

Key information about the people who lead and staff this community.

Languages Spoken

Albanian Arabic Creole Dutch Farsi Hindi Serbian Spanish Thai Ukrainian

Staff Composition (State Data)

Admin
3 FTE
Registered Nurse
12 FTE
Licensed Practical Nurse
18 FTE
Nursing Assistant
50 FTE
Recreation
2 FTE
Social Services
2 FTE
Food Service Supervisor
1 FTE
Physical Therapy
2 FTE
Occupational Therapy
1 FTE
Speech Therapy
1 FTE
Dietary
12 FTE
Other Staff
5 FTE

Care Services

Nursing Services
Rehabilitation Services
Respite Care
Skilled Nursing
Licensed Nurses/CNAs
Short-Term Rehab

All Levels of Care

Short term rehabilitation
Long-term skilled nursing

Additional Policies & Features

Religious Affiliation: Pentecostal
Religious Services: 7th Day Adventist, Baptist, Catholic, Christian Science, Jehovah\'s Witness, Jewish, Lutheran, Methodist, Protestant

Programs & Activities

Specific Programs
Short Term Rehab, Clinical Excellence, Amputee Rehab Program, Careers, Contact Us, Covid-19 Updates
Contact Waterbury Center for Nursing and Rehabilitation

Inspection History

In Connecticut, the Department of Public Health, Facility Licensing and Investigations Section conducts mandatory inspections and unannounced surveys to monitor the quality of care in long-term facilities.

6 visits/inspections

1 visits/inspections triggered by complaints

5 routine inspections

Breakdown by inspection type
  • 1 complaint investigation
  • 1 plan of correction

Results

1 with issues

0 without issues

Connecticut average: 13 visits/inspections

Latest inspection

Date:November 10, 2025

Inspection history

03-25-2025 Inspection Report
06-26-2024 Inspection Report
06-27-2024 Inspection Report
08-27-2024 Inspection Report
11-10-2025 Inspection Report
11-29-2022 Plan of Correction
12-23-2024 Inspection Report

Inspection Report Summary for Waterbury Center for Nursing and Rehabilitation

The most recent inspection on November 10, 2025, identified deficiencies and resulted in a citation related to a complaint investigation. Earlier inspections showed a mixed record, with some renewal inspections finding no violations, such as the one on March 21, 2025, while others, including the December 20, 2024 renewal, noted violations. The main themes of deficiencies involved regulatory compliance issues linked to complaint investigations, though follow-up audits in mid-2024 confirmed correction of prior cited deficiencies. Complaint investigations were mostly unsubstantiated except for the recent case leading to the citation. The inspection history suggests some recurring compliance challenges, but also shows efforts to address and correct identified issues over time.

Health Inspection History

Inspections
Total health inspections 6

Connecticut average 5.7


Last Health inspection on Feb 2025

Total health citations 31

Connecticut average 32

Citations per inspection
5.17

Connecticut average 5.82


Health citations are formal notices following inspections when they fail to comply with safety and care standards.

24 of 31 citations resulted from standard inspections; and 7 of 31 resulted from complaint investigations.

Breakdown of citation severity (last 3 years)
Critical Health citations More info 0
100% better than Connecticut average

Connecticut average: 0.3


Serious Health citations More info 0
100% better than Connecticut average

Connecticut average: 0.7

0 critical citations More info Connecticut average: 0.3

0 serious citations More info Connecticut average: 0.7

28 moderate citations More info Connecticut average: 28.8

3 minor citations More info Connecticut average: 2.3
Citations history (last 3 years)
Care Planning moderate citation Info Issues related to creating and updating personalized care plans for residents based on their needs and conditions. Feb 11, 2025
Corrected

Abuse/Neglect moderate citation Info Issues related to protecting resident's from harm, including abuse, neglect, or mistreatment. Dec 20, 2024
Corrected

Infection Control moderate citation Info Issues related to preventing and controlling infections, including hygiene practices and safety protocols. Dec 20, 2024
Corrected

Nutrition moderate citation Info Issues related to food quality, meal service, and resident's nutritional needs. Dec 20, 2024
Corrected

Compare Nursing Homes around Waterbury The information below is reported by the Connecticut Department of Public Health, Facility Licensing and Investigations Section.

5 facilities compared · CMS & CT Dept. of Health data · Updated Mar 2026

Autumn Lake Healthcare at Bucks Hill
NH

Nursing Home Licensed facility providing 24/7 skilled nursing care for residents with complex, ongoing medical needs. Staffed by RNs, LPNs, and CNAs. Inspected and star-rated annually by CMS. Accepts Medicare (short-term rehab) and Medicaid (long-term care).

AL

Assisted Living A licensed, long-term care setting for seniors or individuals with disabilities who need help with daily activities — like bathing, dressing, and medication management — but not 24-hour skilled nursing. Offers housing, meals, and around-the-clock support while aiming to maximize resident independence.

Waterbury
90
94.0%
+12%
3.26
-43%
-18%
0
24
0
85
-
15
Bucks Hill Parent Llc
$13,3M
$1,5M
11.2%
75418
Waterbury Center for Nursing and Rehabilitation
NH

Nursing Home Licensed facility providing 24/7 skilled nursing care for residents with complex, ongoing medical needs. Staffed by RNs, LPNs, and CNAs. Inspected and star-rated annually by CMS. Accepts Medicare (short-term rehab) and Medicaid (long-term care).

AL

Assisted Living A licensed, long-term care setting for seniors or individuals with disabilities who need help with daily activities — like bathing, dressing, and medication management — but not 24-hour skilled nursing. Offers housing, meals, and around-the-clock support while aiming to maximize resident independence.

Waterbury
120
94.1%
+12%
4.36
+91%
+10%
0
31
0
107
-
39
Landa, Joseph
$14,7M
$7,8M
53%
75219
Cheshire House
NH

Nursing Home Licensed facility providing 24/7 skilled nursing care for residents with complex, ongoing medical needs. Staffed by RNs, LPNs, and CNAs. Inspected and star-rated annually by CMS. Accepts Medicare (short-term rehab) and Medicaid (long-term care).

AL

Assisted Living A licensed, long-term care setting for seniors or individuals with disabilities who need help with daily activities — like bathing, dressing, and medication management — but not 24-hour skilled nursing. Offers housing, meals, and around-the-clock support while aiming to maximize resident independence.

Waterbury
75
93.2%
+11%
4.00
-15%
+1%
0
52
0
70
A+
38
-
$12,9M
$5,4M
41.7%
75373
Abbott Terrace Health Center
-
NH

Nursing Home Licensed facility providing 24/7 skilled nursing care for residents with complex, ongoing medical needs. Staffed by RNs, LPNs, and CNAs. Inspected and star-rated annually by CMS. Accepts Medicare (short-term rehab) and Medicaid (long-term care).

AL

Assisted Living A licensed, long-term care setting for seniors or individuals with disabilities who need help with daily activities — like bathing, dressing, and medication management — but not 24-hour skilled nursing. Offers housing, meals, and around-the-clock support while aiming to maximize resident independence.

Waterbury
205
93.7%
+12%
-
-
-
-
-
-
0
0
0
-
-
89
-
$50,7M
$13,1M
25.9%
75351
NCE Homecare
-
NH

Nursing Home Licensed facility providing 24/7 skilled nursing care for residents with complex, ongoing medical needs. Staffed by RNs, LPNs, and CNAs. Inspected and star-rated annually by CMS. Accepts Medicare (short-term rehab) and Medicaid (long-term care).

AL

Assisted Living A licensed, long-term care setting for seniors or individuals with disabilities who need help with daily activities — like bathing, dressing, and medication management — but not 24-hour skilled nursing. Offers housing, meals, and around-the-clock support while aiming to maximize resident independence.

Waterbury
-
-
-
-
-
-
-
-
-
0
0
0
-
A+
71
-
-
-
-
-

Places of interest near Waterbury Center for Nursing and Rehabilitation

Address 2.1 miles from city center — 1.71 miles to nearest hospital (UConn Health Waterbury Hospital)

Address 177 Whitewood Rd, Waterbury, CT 06708

Calculate Travel Distance to Waterbury Center for Nursing and Rehabilitation

Add your location

Address

Staffing Data (Q2 2025)

This data corresponds to Q2 2025 and is based on CMS Payroll-Based Journal.

Total staff 162
Employees 152
Contractors 10
Staff to resident ratio 1.49:1
21% worse than Connecticut average

Connecticut average ratio: 1.88:1

Avg staff/day 62
Average shift 7.4 hours
0% compared with Connecticut average

Connecticut average: 7.5 hours

Total staff hours (quarter) 41,540
Nursing staff breakdown
Registered Nurse

Manages medical care and health needs.

Total count 34
Average shift length Info Average shift length. Calculated as total hours divided by days worked and average staff per day. 7.3 hours

This role is partially covered by contractors.

Licensed Practical Nurse

Assists with medical care and medications.

Total count 27
Average shift length Info Average shift length. Calculated as total hours divided by days worked and average staff per day. 7.9 hours

No contractors work on this role.

Certified Nursing Assistant

Helps with daily care and mobility.

Total count 83
Average shift length Info Average shift length. Calculated as total hours divided by days worked and average staff per day. 7.4 hours

No contractors work on this role.

Contractor staffing

Total hours from contractors

3.2%

1,330 contractor hours this quarter

Registered Nurse: 6 Occupational Therapy Assistant: 3 Medical Director: 1
Staff by category
Certified Nursing Assistant 83 0 83 22,250 91 100% 7.4
Licensed Practical Nurse 27 0 27 8,111 91 100% 7.9
Registered Nurse 28 6 34 7,395 91 100% 7.3
Mental Health Service Worker 2 0 2 717 65 71% 6.4
Administrator 1 0 1 488 65 71% 7.5
Physical Therapy Assistant 3 0 3 481 66 73% 5.4
Dietitian 2 0 2 468 59 65% 7.6
Other Dietary Services Staff 1 0 1 425 58 64% 7.3
Occupational Therapy Aide 1 0 1 363 51 56% 7.1
Speech Language Pathologist 1 0 1 325 51 56% 6.4
Qualified Social Worker 1 0 1 230 26 29% 8.8
Therapeutic Recreation Specialist 1 0 1 135 19 21% 7.1
Respiratory Therapy Technician 1 0 1 58 17 19% 3.4
Medical Director 0 1 1 52 26 29% 2
Occupational Therapy Assistant 0 3 3 43 30 33% 1.3
83 Certified Nursing Assistant
% of Days 100%
27 Licensed Practical Nurse
% of Days 100%
34 Registered Nurse
% of Days 100%
2 Mental Health Service Worker
% of Days 71%
1 Administrator
% of Days 71%
3 Physical Therapy Assistant
% of Days 73%
2 Dietitian
% of Days 65%
1 Other Dietary Services Staff
% of Days 64%
1 Occupational Therapy Aide
% of Days 56%
1 Speech Language Pathologist
% of Days 56%
1 Qualified Social Worker
% of Days 29%
1 Therapeutic Recreation Specialist
% of Days 21%
1 Respiratory Therapy Technician
% of Days 19%
1 Medical Director
% of Days 29%
3 Occupational Therapy Assistant
% of Days 33%

Facility Characteristics

Source: CMS Long-Term Care Facility Characteristics (Data as of Jan 2026)

Total census
109 residents
Residents by payment source
Medicare
9 residents (8.3%)
Medicaid
91 residents (83.5%)
Private pay or other
9 residents (8.3%)
Programs & Services
Residents' Group

Residents meet regularly to discuss policies, care quality, and activities

Active Resident Council

Organized group of residents that meets regularly to discuss facility policies, quality of life, and activities.

Quality of care over time

These measures show how residents usually do over time at this home, based on health outcomes and preventive care.

High-risk clinical events score Info A composite score based on pressure ulcers, falls with injury, weight loss, walking ability decline, and activities of daily living decline. 6.5
37% better than Connecticut average

Connecticut average: 10.4

Functional decline score Info A composite score based on activities of daily living decline, walking ability decline, and incontinence. 13.6
35% better than Connecticut average

Connecticut average: 21.1

Long-stay resident measures
Significantly above average Connecticut avg: 3.2 Info CMS star rating based on long-stay quality measure performance. 5 stars = significantly above average, 1 star = significantly below average.
Need for Help with Daily Activities Increased Info Percent of long-stay residents whose need for help with daily activities has increased 12.5%
34% better than Connecticut average

Connecticut average: 18.9%

Walking Ability Worsened Info Percent of long-stay residents whose ability to move independently worsened 7.7%
60% better than Connecticut average

Connecticut average: 19.2%

Low Risk Residents with Bowel/Bladder Incontinence Info Percent of low risk long-stay residents who lose control of their bowels or bladder 20.7%
17% better than Connecticut average

Connecticut average: 24.9%

Falls with Major Injury Info Percent of long-stay residents experiencing one or more falls with major injury 1.7%
50% better than Connecticut average

Connecticut average: 3.5%

High Risk Residents with Pressure Ulcers Info Percent of long-stay high risk residents with pressure ulcers 7.0%
53% worse than Connecticut average

Connecticut average: 4.6%

Urinary Tract Infection Info Percent of long-stay residents with a urinary tract infection 0.0%
100% better than Connecticut average

Connecticut average: 1.7%

Lost Too Much Weight Info Percent of long-stay residents who lose too much weight 3.7%
41% better than Connecticut average

Connecticut average: 6.3%

Depressive Symptoms Info Percent of long-stay residents who have depressive symptoms 9.1%
40% better than Connecticut average

Connecticut average: 15.2%

Antipsychotic Use Info Percent of long-stay residents who received an antipsychotic medication 32.5%
89% worse than Connecticut average

Connecticut average: 17.2%

Pneumococcal Vaccine Info Percent of long-stay residents assessed and appropriately given the pneumococcal vaccine 89.7%
In line with Connecticut average

Connecticut average: 87.5%

Influenza Vaccine Info Percent of long-stay residents assessed and appropriately given the seasonal influenza vaccine 84.9%
9% worse than Connecticut average

Connecticut average: 93.5%

Hospitalizations per 1,000 days Info Number of hospitalizations per 1,000 long-stay resident days. 1.41
33% better than Connecticut average

Connecticut average: 2.10

ED visits per 1,000 days Info Number of outpatient emergency department visits per 1,000 long-stay resident days. 1.12
27% better than Connecticut average

Connecticut average: 1.53

Short-stay resident measures
Average Connecticut avg: 3.3 Info CMS star rating based on short-stay quality measure performance. 5 stars = much above average, 1 star = much below average.
Pneumococcal Vaccine Info Percent of short-stay residents assessed and appropriately given the pneumococcal vaccine 62.9%
10% worse than Connecticut average

Connecticut average: 70.1%

Antipsychotic medication increase Info Percent of short-stay residents who newly received an antipsychotic medication 0.7%
56% better than Connecticut average

Connecticut average: 1.5%

Influenza Vaccine Info Percent of short-stay residents assessed and appropriately given the seasonal influenza vaccine 49.5%
29% worse than Connecticut average

Connecticut average: 69.8%

Re-hospitalized after SNF stay Info Percentage of short-stay residents who were re-hospitalized after their nursing home admission. 23.7%
5% better than Connecticut average

Connecticut average: 25.0%

Emergency department visits Info Percentage of short-stay residents who had an outpatient emergency department visit. 13.8%
24% worse than Connecticut average

Connecticut average: 11.1%

Falls with major injury Info Percentage of SNF residents who experience falls with major injury during their stay. 0.0%
100% better than Connecticut average

Connecticut average: 0.8%

Ability to care for self at discharge Info Percentage of residents at or above expected ability to care for themselves at discharge. 70.0%
30% better than Connecticut average

Connecticut average: 53.7%

Successful return to home or community Info Rate of successful return to home or community from a skilled nursing facility. 47.6%
6% worse than Connecticut average

Connecticut average: 50.6%

Guides for Better Senior Living

Care Cost Calculator: See Prices in Your Area

Nursing Home Data Explorer

Don’t Wait Too Long: 7 Red Flag Signs Your Parent Needs Assisted Living Now

The True Cost of Assisted Living in 2025 – And How Families Are Paying For It

Understanding Senior Living Costs: Pricing Models, Discounts & Financial Assistance

Financial Aid for Connecticut Seniors

Get financial aid guidance

Connecticut Home Care Program for Elders

CHCPE

Age 65+, Connecticut resident, at risk of nursing home placement.

State-funded: ~$1,600/month; Medicaid: ~$2,829/month (300% FBR).

$1,600 (state), $2,000 (Medicaid, individual).

Two tiers (state and Medicaid); waitlists possible.

Statewide Respite Care Program

CT Respite Care

Caregiver of senior with dementia, Connecticut resident.

~$2,500/month (individual, varies).

$40,000 (individual).

Limited to dementia caregivers; capped funding.

Congregate Housing Services Program (CHSP)

Connecticut Congregate Housing Services Program

Age 62+, Connecticut resident, frail but not needing 24/7 care, resides in CHSP-eligible housing.

~$41,000/year (individual, adjusted annually).

Not specified; focus is income-based.

Limited to 14 state-subsidized sites; participants pay 10% of service costs.

Medicare Savings Program (MSP)

Connecticut Medicare Savings Program

Age 65+ or disabled, Connecticut resident, enrolled in Medicare Part A/B.

~$2,510/month (individual, QMB); ~$3,380/month (SLMB); ~$3,598/month (ALMB)—adjusted annually.

None since 2023 policy change.

Three tiers (Qualified Medicare Beneficiary, Specified Low-Income, Additional Low-Income); no asset test.

Senior Community Service Employment Program (SCSEP)

Connecticut SCSEP (federally funded, state-administered)

Age 55+, unemployed, low-income, Connecticut resident.

~$1,983/month (125% FPL, individual).

Not specified; income-focused.

Priority for veterans, rural residents; limited slots (~500/year).