Waterman Canyon Post Acute

Nursing Home
Overview of Waterman Canyon Post Acute

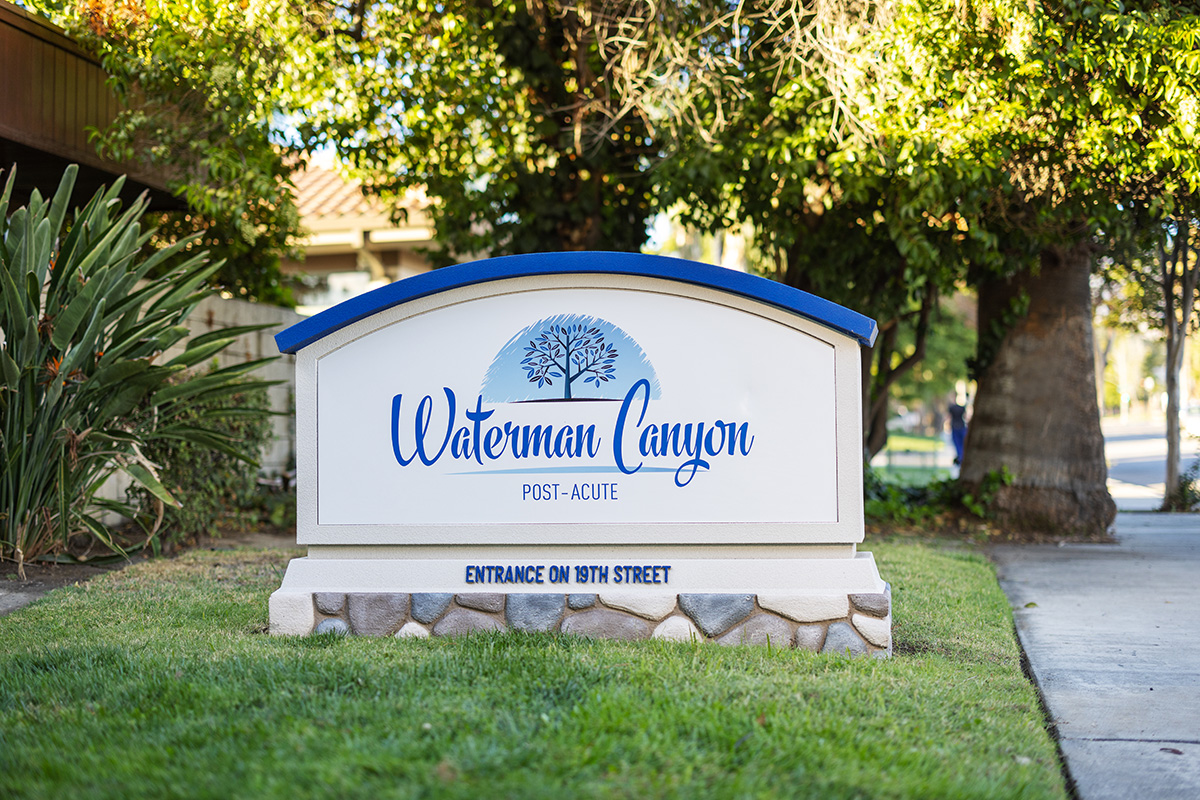
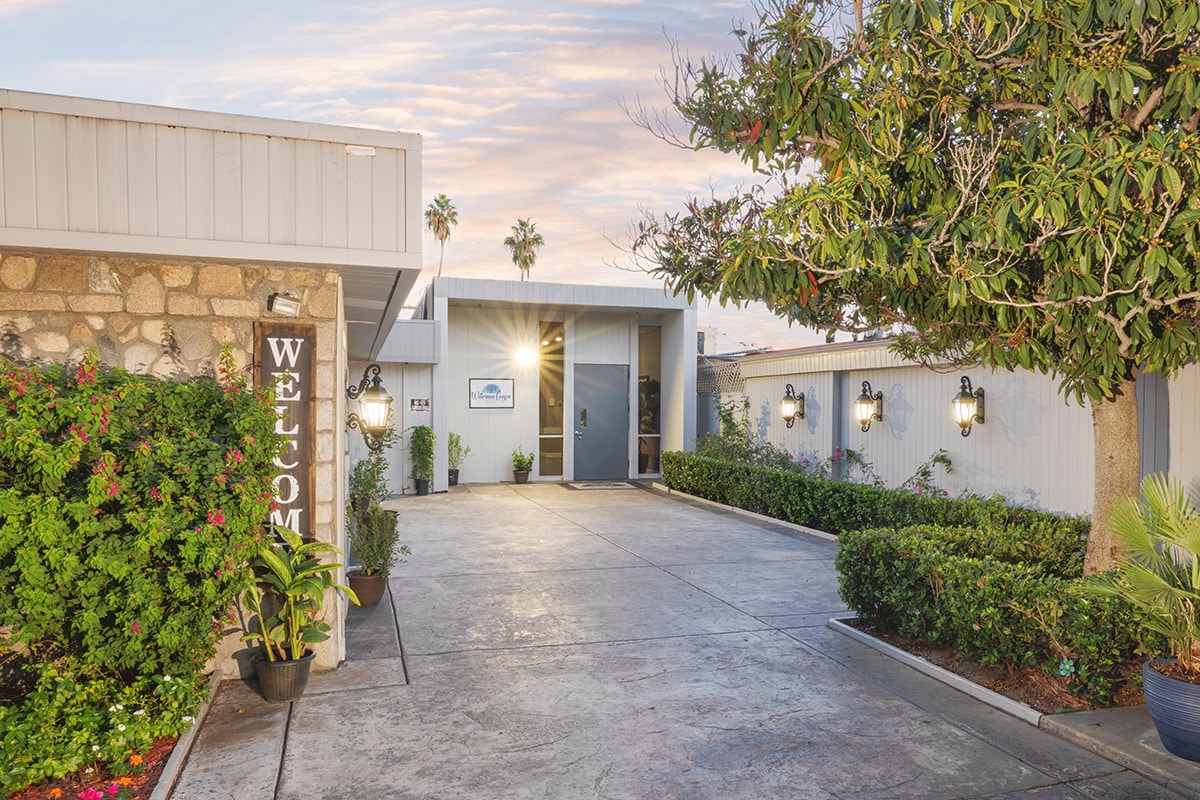
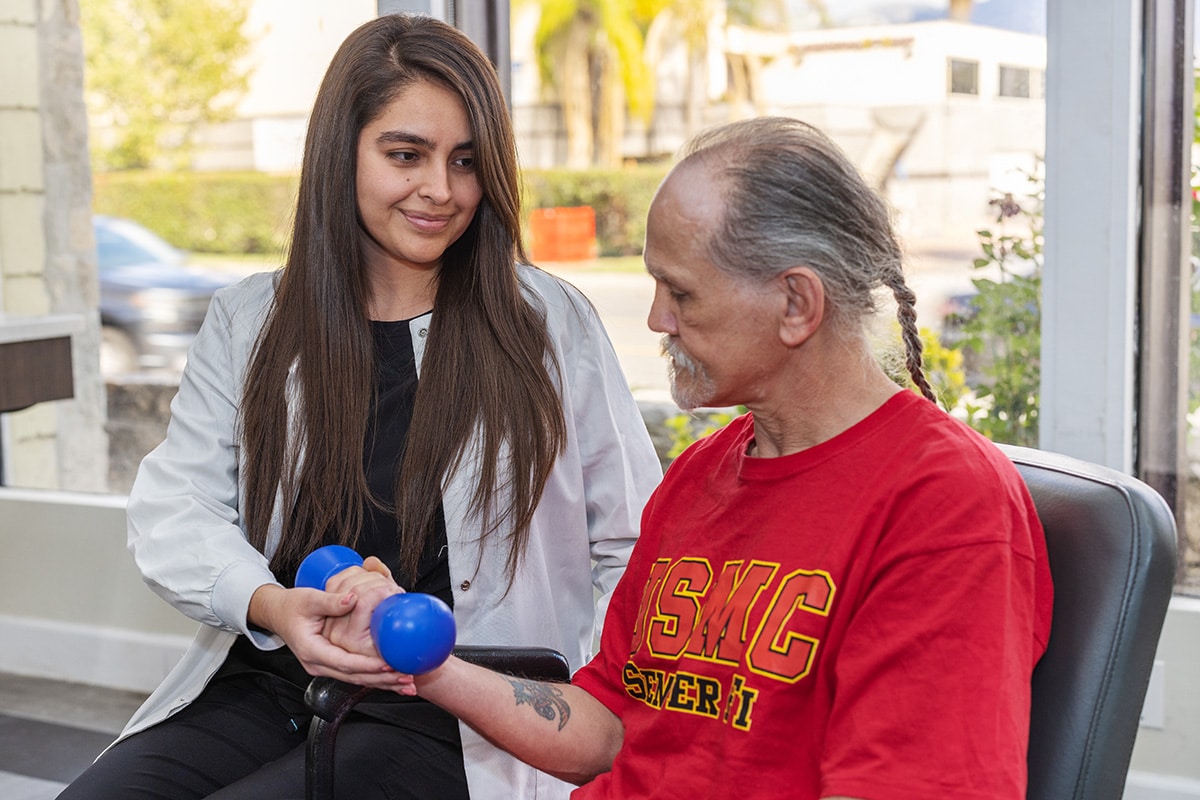
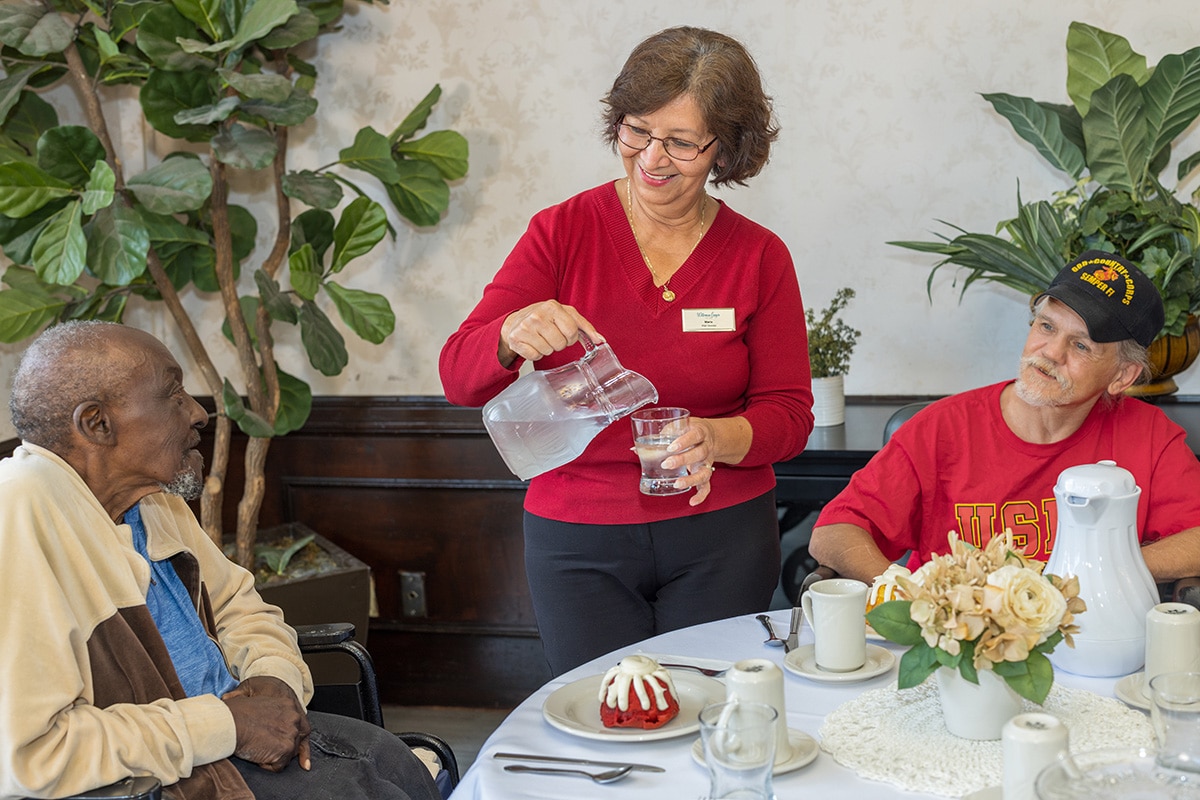
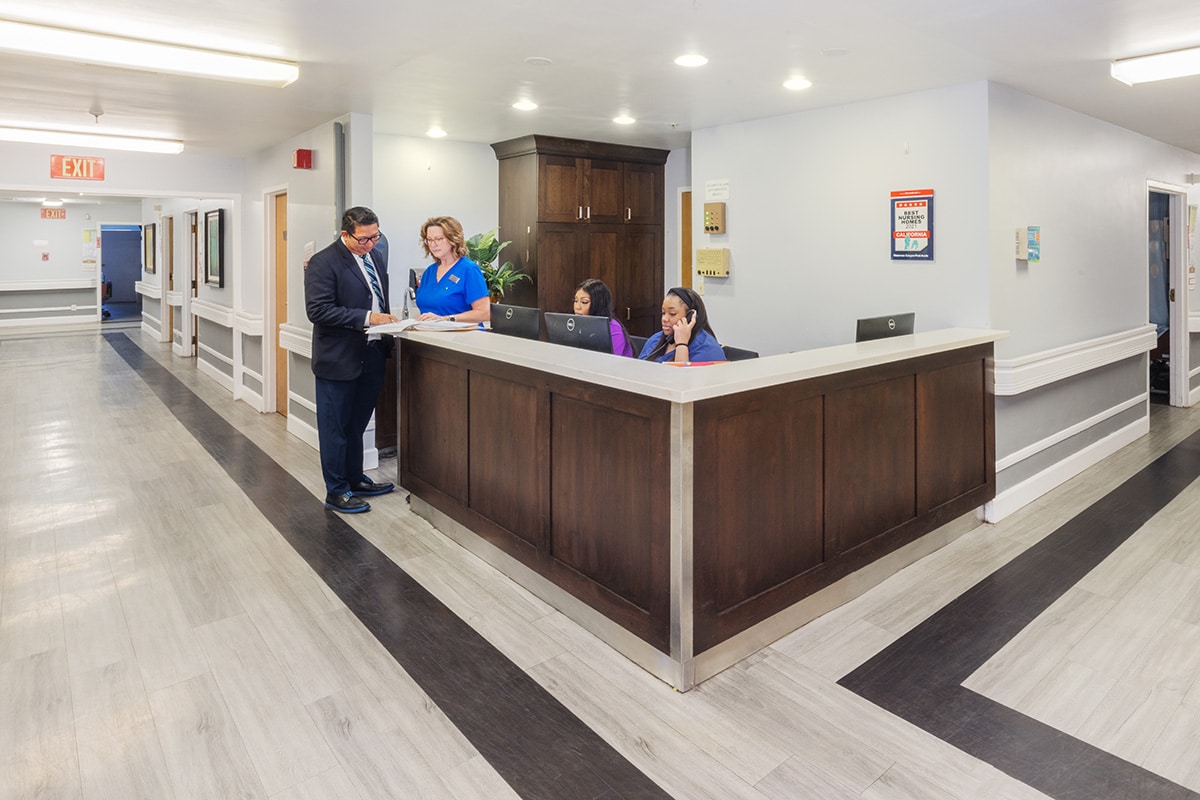
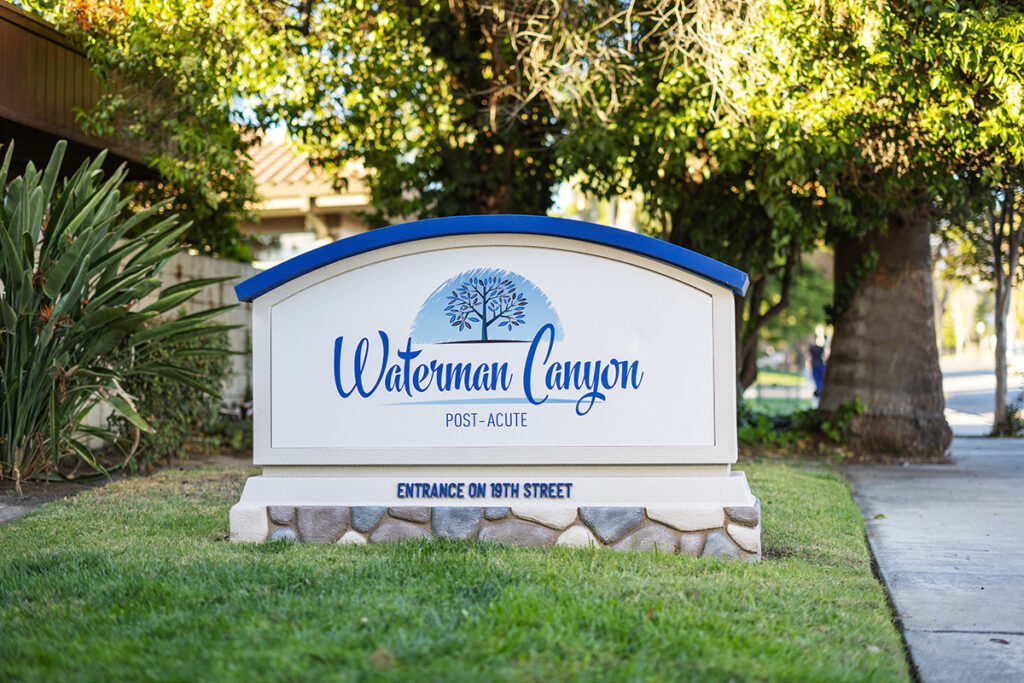
Waterman Canyon Post Acute is San Bernardino’s premier nursing center. The dedicated team of professionals approaches their service with the understanding that their residents need a sense of safety and wellness– both physically and emotionally. They inspire residents to grow as better individuals through their enhanced lifestyle in a vibrant and positive environment. Waterman Canyon is the place to experience effective care.

Waterman Canyon’s nursing and rehab experience is centered on skilled nursing, wellness, and therapy. Residents can feel confident knowing it is filled with safe, comfortable, and therapeutic service. Seniors are encouraged to maintain independence and individuality by staying active and engaged with social, recreational, and stimulating activities.

(909) 882-1215

Quality ratings

Measured by Centers for Medicare & Medicaid Services (CMS)

Overall rating Info Official CMS rating based on health inspections, staffing and quality measures.
4/5
California average: 3.1/5
Health Inspection Info Official CMS rating based on deficiencies found during state health inspections.
4/5
California average: 2.8/5
Staffing Info Official CMS rating based on nurse staffing hours per resident per day.
3/5
California average: 3.1/5
Quality Measures Info Official CMS rating based on clinical outcomes for residents.
4/5
California average: 4.1/5

Nursing care per resident

Info Average daily nursing hours per resident (adjusted for acuity). Higher values indicate more nursing time per resident.
3h 32m per day

This home provides 16% less nursing time per resident than the state average.

California average: 4h 13m per day

Staffing hours breakdown

Info Hours of care per resident per day, broken down by staff type. Data from CMS Medicare.
Staff type Facility State avg National avg
Registered Nurse (RN) Info Registered nurse hours per resident per day. 15m per day 39m per day 41m per day
LPN / LVN Info Licensed Practical Nurse / Licensed Vocational Nurse hours per resident per day. 1h 11m per day 1h 13m per day 52m per day
Nurse Aide Info Nurse aide hours per resident per day. 2h 30m per day 2h 39m per day 2h 21m per day
Total Nursing (Weekend) Info Total number of nurse staff hours per resident per day on weekends. 3h 40m per day 4h 5m per day 3h 26m per day
Physical Therapist Info Physical therapist staff hours per resident per day. 2m per day 5m per day 4m per day
RN (Weekend) Info Registered nurse hours per resident per day on weekends. 10m per day 30m per day 29m per day

Capacity and availability

Medium-capacity home

Offers a balance of services and community atmosphere.

Total beds 166

This home usually has limited availability

Occupancy is moderate, suggesting balanced demand.

Similar demand to the California average
Occupancy rate 93.6%
Residents per day (avg) 159
Occupancy rate
93.6%
Residents per day (avg)
159

Who this home usually serves

TYPE OF STAY

Primarily short stays

Residents typically stay for brief periods, with frequent admissions and discharges throughout the year.

Might be optimal for
Post-acute recovery Temporary care Transitional stays

Breakdown by payment type

Medicare

19% of new residents, usually for short-term rehab.

Typical stay 3 - 4 months

Private pay

77% of new residents, often for short stays.

Typical stay 3 - 4 months

Medicaid

4% of new residents, often for long-term daily care.

Typical stay 4 - 5 months

Finances and operations

Proprietary home
Other
Home revenue
$33.6M
Profit
$4.0M
Proprietary home Other
Home revenue
$33,617,902.00
Profit
$4,039,618.00
Payroll costs Info The portion of the home's budget spent on staff, including nurses, caregivers, and other employees who support care and operations.
$11.3M
33.7% of revenue
Other operating costs Info All remaining costs needed to run the home, such as food, utilities, building maintenance, supplies and administrative expenses.
$18.2M
Total costs $29.6M
Walk Score
Walk Score: 63 / 100
Moderately walkable. Some errands can be accomplished on foot, with a mix of nearby amenities.
BBB Rating
BBB Rating: A+ (Not Accredited)
An independent rating from the Better Business Bureau based on factors such as complaint history, transparency, and business practices.
How BBB ratings work

About this community

Additional licensing details

CMS Certification Number: 55565
Awards: Newsweek Top Nursing Home 2026, Four-Star Ratings from Medicare

Care Services

Accepts Medicare
Nursing Services
Rehabilitation Services
Skilled Nursing
Licensed Nurses/CNAs
24-Hour Staffing
Short-Term Rehab

All Levels of Care

Short-Term Rehabilitation
Long-Term Care
Complex Wound Care
Hospice Services

Amenities & Lifestyle

Spacious accommodations
Expansive rehab gym
Beautiful courtyards and common areas
24/7 nursing care
Personalized rehabilitation and nursing services
Complex wound care
Hospice services

Programs & Activities

Specific Programs
About Us, What We Do, New Patient FAQs, Activity Calendar, Newsweek Award, Photos, Careers, Contact Us, Map and Directions, Send a Greeting, Online Bill Pay
Operating Hours
Monday – Friday: 8am – 4pm

Types of Care at Waterman Canyon Post Acute

Skilled Nursing
Contact Waterman Canyon Post Acute

Access & Eligibility

Ways to qualify for care at this community, including accepted programs and payment options.

Medicare Accepted

This facility is certified for eligible Medicare services.

Payment & Funding Options

Medicare

Compare Nursing Homes around San Bernardino

The information below is reported by the California Department of Social Services and Department of Public Health.
Arrowhead Healthcare Center
AL

Assisted Living For seniors needing help with daily tasks but not full-time nursing.

SNF

Nursing Homes 24/7 care needed

San Bernardino (Wildwood Park)
58
No
-
79
ARROWHEAD HEALTHCARE CENTER LLC
96.5%
$12,421,097.00
$6,513,570.00
52.4%
55.60
5/5
4.8497
4/5
4/5
5/5
-
21
-
-22%
+15%
+14%
Haven Post Acute
AL

Assisted Living For seniors needing help with daily tasks but not full-time nursing.

SNF

Nursing Homes 24/7 care needed

San Bernardino (Del Rosa)
99
No
-
67
-
93.2%
$15,757,223.00
$6,063,777.00
38.5%
92.00
4/5
4.7702
4/5
3/5
4/5
3
25
1
-50%
+13%
+10%
Waterman Canyon Post Acute
AL

Assisted Living For seniors needing help with daily tasks but not full-time nursing.

SNF

Nursing Homes 24/7 care needed

San Bernardino
166
No
A+
63
JENKINS, NICOLETTA
93.6%
$33,616,309.00
$11,333,305.00
33.7%
158.70
4/5
3.5266
4/5
3/5
4/5
-
46
-
-30%
-16%
+11%
Del Rosa Villa Post Acute
AL

Assisted Living For seniors needing help with daily tasks but not full-time nursing.

SNF

Nursing Homes 24/7 care needed

San Bernardino (Pacific)
104
No
-
74
ESKANDER, ASHRAF
87.8%
$23,642,888.00
$7,322,906.00
31%
93.80
1/5
3.1480
2/5
1/5
4/5
1
31
1
-68%
-25%
+4%

Places of interest near Waterman Canyon Post Acute

Address 2.2 miles from city center — 0.21 miles to nearest hospital (St. Bernardine Medical Center)

Address 1850 N Waterman Ave, San Bernardino, CA 92404

Calculate Travel Distance to Waterman Canyon Post Acute

Add your location

Address

Staffing Data

Source: CMS Payroll-Based Journal (Q2 2025)

218
Total Staff
215
Employees
3
Contractors
69,920
Total Hours (Quarter)
102
Avg Staff/Day
7.5
Avg Shift (hrs)
Nursing Staff Breakdown
Role Count Avg Shift (hrs) Uses Contractors?
Registered Nurse137.8 No
Licensed Practical Nurse397.7 No
Certified Nursing Assistant1197.4 No
Staff by Category
Administration
2 staff
4.4hs shift avg
Nursing Staff
176 staff
7.5hs shift avg
Physicians & Practitioners
2 staff
7.6hs shift avg
Therapy Services
25 staff
7.8hs shift avg
Activities & Recreation
3 staff
6.7hs shift avg
Social Services
1 staff
9.8hs shift avg
Dietary Services
6 staff
7.8hs shift avg
Other Services
3 staff
8hs shift avg
Contractor Analysis
0.4%
of total hours from contractors
262 contractor hours this quarter
Medical Director: 1 Other Physician: 1 Occupational Therapy Assistant: 1
Role Employees Contractors Total Staff Total Hours Days Worked % of Days Avg Shift (hrs)
Certified Nursing Assistant119011936,17891100%7.4
Licensed Practical Nurse3903914,48891100%7.7
Registered Nurse130133,32591100%7.8
Physical Therapy Aide8082,7468088%7.9
Speech Language Pathologist6062,6487582%7.9
RN Director of Nursing5052,0466875%8
Physical Therapy Assistant6061,7557582%8.7
Other Dietary Services Staff4049668796%7.8
Dental Services Staff2029446571%8.2
Respiratory Therapy Technician3037588088%5.7
Qualified Social Worker1017277481%9.8
Therapeutic Recreation Specialist3037147279%6.7
Dietitian2027046470%7.9
Nurse Practitioner1015126470%8
Mental Health Service Worker1014786268%7.7
Occupational Therapy Aide1014165257%8
Administrator1012566470%4
Medical Director0111492730%5.5
Occupational Therapy Assistant011681011%6.8
Other Physician01145910%5

Health Inspection History

Inspections
Total health inspections 19

California average 12.5


Last Health inspection on Sep 2025

Total health citations 46
Citations per inspection
2.42

Health citations are formal notices following inspections when they fail to comply with safety and care standards.

30 of 46 citations resulted from standard inspections; and 16 of 46 resulted from complaint investigations.

Breakdown of citation severity (last 3 years)
Critical Health citations More info 0
100% better than California average

California average: 0.4


Serious Health citations More info 0
100% better than California average

California average: 1

0 critical citations More info California average: 0.4

0 serious citations More info California average: 1

44 moderate citations More info California average: 47.2

2 minor citations More info California average: 1.5
Citations history (last 3 years)
Resident Rights moderate citation Sep 23, 2025
Corrected

Resident Rights moderate citation May 13, 2025
Corrected

Abuse/Neglect moderate citation Mar 21, 2025
Corrected

Environmental moderate citation Mar 21, 2025
Corrected

Facility Characteristics

Source: CMS Long-Term Care Facility Characteristics (Data as of Jan 2026)

Ownership: For-Profit LLC
Resident Census by Payment Source
164 Total Residents
Medicare 50 (30.5%)
Medicaid 4 (2.4%)
Private Pay/Other 110 (67.1%)
Programs & Services
Residents' Group
Family Engagement

Active councils help families stay involved in care decisions and facility operations.

Quality of care over time

These measures show how residents usually do over time at this home, based on health outcomes and preventive care.

High-risk clinical events score Info A composite score based on pressure ulcers, falls with injury, weight loss, walking ability decline, and activities of daily living decline. 8.8
32% worse than California average

California average: 6.6

Functional decline score Info A composite score based on activities of daily living decline, walking ability decline, and incontinence. 15.5
37% worse than California average

California average: 11.3

Long-stay resident measures
Need for Help with Daily Activities Increased Info Percent of long-stay residents whose need for help with daily activities has increased 16.6%
50% worse than California average

California average: 11.1%

Walking Ability Worsened Info Percent of long-stay residents whose ability to move independently worsened 17.0%
42% worse than California average

California average: 12.0%

Low Risk Residents with Bowel/Bladder Incontinence Info Percent of low risk long-stay residents who lose control of their bowels or bladder 12.9%
15% worse than California average

California average: 11.3%

Falls with Major Injury Info Percent of long-stay residents experiencing one or more falls with major injury 0.5%
68% better than California average

California average: 1.7%

High Risk Residents with Pressure Ulcers Info Percent of long-stay high risk residents with pressure ulcers 4.1%
18% better than California average

California average: 5.0%

Urinary Tract Infection Info Percent of long-stay residents with a urinary tract infection 0.4%
68% better than California average

California average: 1.2%

Lost Too Much Weight Info Percent of long-stay residents who lose too much weight 5.7%
36% worse than California average

California average: 4.2%

Depressive Symptoms Info Percent of long-stay residents who have depressive symptoms 41.9%
526% worse than California average

California average: 6.7%

Antipsychotic Use Info Percent of long-stay residents who received an antipsychotic medication 4.0%
60% better than California average

California average: 10.1%

Pneumococcal Vaccine Info Percent of long-stay residents assessed and appropriately given the pneumococcal vaccine 100.0%
In line with California average

California average: 98.5%

Influenza Vaccine Info Percent of long-stay residents assessed and appropriately given the seasonal influenza vaccine 100.0%
In line with California average

California average: 98.2%

Hospitalizations per 1,000 days Info Number of hospitalizations per 1,000 long-stay resident days. 4.84
115% worse than California average

California average: 2.25

ED visits per 1,000 days Info Number of outpatient emergency department visits per 1,000 long-stay resident days. 1.47
8% better than California average

California average: 1.59

Short-stay resident measures
Pneumococcal Vaccine Info Percent of short-stay residents assessed and appropriately given the pneumococcal vaccine 99.7%
6% better than California average

California average: 94.0%

Antipsychotic medication increase Info Percent of short-stay residents who newly received an antipsychotic medication 0.7%
53% better than California average

California average: 1.5%

Influenza Vaccine Info Percent of short-stay residents assessed and appropriately given the seasonal influenza vaccine 99.3%
7% better than California average

California average: 93.2%

Re-hospitalized after SNF stay Info Percentage of short-stay residents who were re-hospitalized after their nursing home admission. 20.1%
13% better than California average

California average: 23.2%

Emergency department visits Info Percentage of short-stay residents who had an outpatient emergency department visit. 9.1%
19% better than California average

California average: 11.2%

Falls with major injury Info Percentage of SNF residents who experience falls with major injury during their stay. 0.0%
100% better than California average

California average: 0.8%

Ability to care for self at discharge Info Percentage of residents at or above expected ability to care for themselves at discharge. 46.8%
13% worse than California average

California average: 53.7%

Successful return to home or community Info Rate of successful return to home or community from a skilled nursing facility. 25.9%
49% worse than California average

California average: 50.6%

Guides for Better Senior Living

Care Cost Calculator: See Prices in Your Area

Nursing Home Data Explorer

Don’t Wait Too Long: 7 Red Flag Signs Your Parent Needs Assisted Living Now

The True Cost of Assisted Living in 2025 – And How Families Are Paying For It

Understanding Senior Living Costs: Pricing Models, Discounts & Financial Assistance

Financial Aid for California Seniors

Get financial aid guidance

Multipurpose Senior Services Program

MSSP (Medi-Cal Waiver)

Age 65+, California resident, Medi-Cal eligible, nursing home risk.

~$2,829/month (300% FBR, individual).

$2,000 (individual), $3,000 (couple).

County-managed; waitlists possible.

In-Home Supportive Services (IHSS)

California IHSS

Age 65+, California resident, Medicaid-eligible or low-income.

~$1,732/month (individual, Medi-Cal threshold).

$2,000 (individual).

Can hire family as caregivers.

Multipurpose Senior Services Program (MSSP)

CA MSSP

Age 65+, California resident, Medi-Cal-eligible, nursing home-eligible but community-capable.

~$2,829/month (300% FBR, individual).

$2,000 (individual).

Available in 38 counties; waitlists common.

Property Tax Postponement Program (PTP)

CA PTP

Age 62+, California resident, own and live in home, 40% equity.

~$51,500/year (household, adjusted annually).

Equity-based; no strict asset cap.

Deferred taxes accrue interest (5% as of 2024); repaid upon sale/death.

Assisted Living Waiver (ALW)

CA ALW

Age 65+ or disabled, California resident, Medi-Cal-eligible, nursing home-eligible.

~$2,829/month (300% FBR, individual).

$2,000 (individual).

Available in 15 counties (e.g., LA, Sacramento); waitlists common.

California CARES Program

CA CARES

Caregivers of California residents 60+ needing help with 3+ daily activities; no caregiver age limit.

No strict limit; cost-sharing above ~$2,500/month threshold.

Not applicable; need-based.

High demand in urban areas; complements IHSS respite.

Low-Income Home Energy Assistance Program (LIHEAP)

CA LIHEAP

Age 60+ priority, California resident, low-income, utility/heating need.

~$2,510/month (200% of poverty level, individual).

Not applicable; income-focused.

High demand in inland/coastal extremes; weatherization capped at $5,000/home.

Who we are

Your Senior Care Partner, Every Step of the Way

We help families find affordable senior communities and unlock same day discounts, Medicaid, and Medicare options tailored to your needs.

Contact us Today
Tour Icon
Planning a tour? Check our touring checklist.
Chat Icon
Thinking of living here? We can help you speak to a current resident