Watertown Health Care Center

Nursing Home in Watertown

CMS overall rating Info The Overall CMS Rating is scored from 1 to 5 stars and combines results from health inspections, staffing levels, and quality measures. Health inspections carry the most weight. Staffing and quality scores can increase or decrease the final rating based on performance compared to state and national standards.
Calculator: See prices in your area
Watertown Health Care Center accepts Medicare, Medicaid, and private pay.

Overview of Watertown Health Care Center

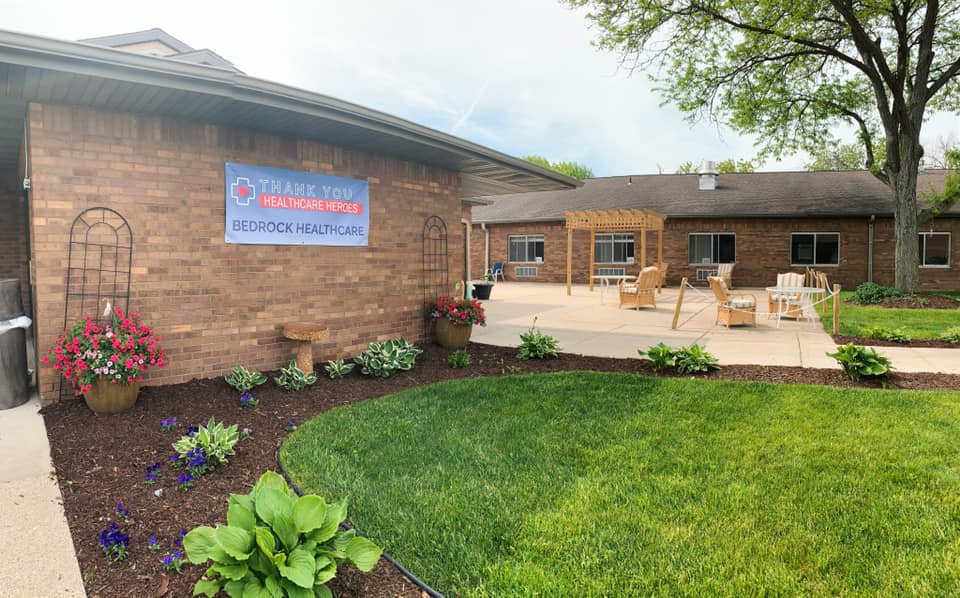
Watertown Health Care Center serves families in the Jefferson, Dodge, and surrounding counties with their award-winning care. What truly sets them apart is their highly skilled clinical nursing team, meticulously chosen for their expertise and dedication to providing unparalleled service. Their focus spans a spectrum of services, from short-term rehab to wound care programs, catering to complex healthcare needs.

The home takes pride in its team of physical, speech, and occupational therapists, who are deeply committed to employing innovative approaches in aiding their patients’ recovery journey. Their holistic approach to wellness encompasses not only treatment and medication therapy but also specialized programs designed to nurture the mind, body, and spirit. Within these walls, residents find comfort and support, making Watertown Health Care Center one of the foremost nursing home facilities in Wisconsin.

(860) 274-6666

Quality ratings

Measured by Centers for Medicare & Medicaid Services (CMS)

Overall rating Info The Overall CMS Rating combines results from health inspections, staffing levels and quality measures. Health inspections carry the most weight. Staffing and quality scores can increase or decrease the final rating based on performance compared to state and national standards.
1/5 ▼ 2.0 Wisconsin average: 3.0/5
Health Inspection Info Based on the results of the facility's three most recent standard inspections and any complaint investigations. CMS reviews the number, scope, and severity of deficiencies, with more recent findings weighted more heavily.
1/5 ▼ 1.8 Wisconsin average: 2.8/5
Staffing Info Measures average nursing staff hours per resident per day, including Registered Nurses (RNs) and total nursing staff. Ratings are adjusted based on the level of care residents require and are compared to state and national benchmarks.
2/5 ▼ 1.6 Wisconsin average: 3.6/5
Quality Measures Info Based on clinical and physical health indicators reported to CMS, such as hospital readmissions, falls, pressure ulcers, and improvements in mobility. These measures reflect how well residents' health needs are being managed.
2/5 ▼ 1.1 Wisconsin average: 3.1/5

Staffing hours breakdown

Info Daily nursing hours per resident by staff type, reported to CMS. Higher is generally better — compare this facility to state and national averages to see where staffing stands.

Hours per resident per day — compared to Wisconsin state averages

Total nursing care / resident Info This home is ranked 130th out of 167 homes in Wisconsin.

Total adjusted nursing hours per resident per day, combining RN, LPN, and aide time. CMS adjusts this for case-mix so facilities can be fairly compared.
3h 20m per day
Rank #130 / 167Nurse hours — state benchmarkedThis home is ranked 130th out of 167 homes in Wisconsin.Shows adjusted nurse hours per resident per day benchmarked to the Wisconsin average, with a ranking across 167 Wisconsin SNFs. More hours mean more direct care. The national average is about 3.5 hrs; below 3.0 is a red flag.
This facility Wisconsin avg (4h 17m per day)
vs Wisconsin avg
-22%

5 of 6 metrics below state avg

Standout metric LPN / LVN is +24% above state avg
Staff typeHours / dayvs state avg
Registered Nurse (RN) Info RNs hold the highest nursing license and can assess residents, interpret test results, and direct care plans. More RN hours per day often signals stronger clinical oversight and faster response to health changes. 31m per day ▼ 47% State avg: 58m per day · National avg: 41m per day
LPN / LVN Info Licensed Practical Nurses (LPNs) or Licensed Vocational Nurses (LVNs) deliver routine hands-on care — medication administration, wound dressing, and monitoring vital signs. They work under RN supervision and make up a large share of daily bedside care. 47m per day ▲ 24% State avg: 38m per day · National avg: 52m per day
Nurse Aide Info Certified Nurse Aides (CNAs) provide the most direct day-to-day assistance: bathing, dressing, feeding, and mobility. Nurse aide hours are typically the largest staffing category and directly affect residents' quality of life. 1h 38m per day ▼ 37% State avg: 2h 35m per day · National avg: 2h 21m per day
Total Nursing (Weekend) Info Combined nursing hours (RN + LPN + Nurse Aide) per resident per day on weekends. Staffing often drops on weekends — this figure reveals whether the facility maintains adequate coverage outside of weekday hours. 2h 52m per day ▼ 23% State avg: 3h 43m per day · National avg: 3h 26m per day
Physical Therapist Info Hours per resident per day provided by licensed Physical Therapists (PTs) or PT Assistants. PT services help residents recover mobility after injury or illness and are especially important for post-acute (short-stay) rehabilitation. 1m per day ▼ 75% State avg: 4m per day · National avg: 4m per day
RN (Weekend) Info Registered nurse hours specifically on weekends. Facilities sometimes reduce RN presence on Saturdays and Sundays — a low weekend RN figure compared to weekday hours can indicate reduced clinical oversight when most administrative staff are absent. 24m per day ▼ 38% State avg: 39m per day · National avg: 29m per day

Capacity and availability

This home usually has availability

Occupancy lower than 85% suggests more openings may be available.

Lower occupancy than the Wisconsin average: 70%
Occupancy rate 68.5% Rank #83 / 170Occupancy rate — state benchmarkedThis home is ranked 83rd out of 170 homes in Wisconsin.Shows this facility's occupancy rate versus the Wisconsin average, with its statewide rank out of 170. Higher occupancy signals strong local demand and financial stability.
Avg. Length of Stay 72 days
Occupancy rate
68.5% Rank #83 / 170Occupancy rate — state benchmarkedThis home is ranked 83rd out of 170 homes in Wisconsin.Shows this facility's occupancy rate versus the Wisconsin average, with its statewide rank out of 170. Higher occupancy signals strong local demand and financial stability.
Avg. Length of Stay
72 days

Who this home usually serves

TYPE OF STAY

Primarily short stays

Residents typically stay for brief periods, with frequent admissions and discharges throughout the year.

Breakdown by payment type

Medicare

25% of new residents, usually for short-term rehab.

Typical stay 1 - 2 months

Private pay

66% of new residents, often for short stays.

Typical stay 1 - 2 months

Medicaid

10% of new residents, often for long-term daily care.

Typical stay 10 - 11 months

Finances and operations

Privately-owned community
Operated by a business corporation.
Home revenue
$11.8M
Profit
$621.5K
Privately-owned community Operated by a business corporation.
Home revenue
$11.8M Rank #42 / 170Revenue — state benchmarkedThis home is ranked 42nd out of 170 homes in Wisconsin.Shows this facility's annual revenue compared to the Wisconsin SNF average. Higher revenue generally means more resources for staffing and capital — read alongside Payroll %.
Profit
$621.5K
Payroll costs Info The portion of the home's budget spent on staff, including nurses, caregivers, and other employees who support care and operations. Rank #120 / 170Payroll — state benchmarkedThis home is ranked 120th out of 170 homes in Wisconsin.Shows total annual staff payroll benchmarked to the Wisconsin average. Higher payroll investment relative to peers often signals better staffing and less reliance on cheaper contract labor.
$2.8M
23.5% of revenue Rank #164 / 170Payroll % — state benchmarkedThis home is ranked 164th out of 170 homes in Wisconsin.Shows payroll as a percentage of revenue versus the Wisconsin average. Well-run SNFs often land around 55–65%. Below 25% may signal understaffing or heavy agency use — read with Staffing ratings.
Other operating costs Info All remaining costs needed to run the home, such as food, utilities, building maintenance, supplies and administrative expenses.
$8.4M
Total costs $11.1M
Walk Score
Walk Score: 28 / 100 Rank #42 / 57Walk Score — state benchmarkedThis home is ranked 42nd out of 57 homes in Wisconsin.Shows how walkable this facility's neighborhood is compared to the average Walk Score across Wisconsin SNFs. Higher scores benefit residents, families, and staff.
Somewhat walkable. A few nearby services may be reachable on foot, but most trips require transportation.

About this community

License Details

Payment & Insurance

2 services
Accept Medicaid
Accept Medicare

Therapy & Rehabilitation

3 services
Rehabilitation Services
Respite Care
Short-Term Rehab

Staffing & Medical

1 service
24-Hour Staffing

Amenities & Lifestyle

Specific ProgramsLong Term Care, Wound Care, Hospice palliative care

Types of Care at Watertown Health Care Center

Skilled Nursing

Contact Watertown Health Care Center

Health Inspection History

Inspections
Total health inspections 20

Wisconsin average 6


Last Health inspection on Feb 2025

Total health citations
62 Rank #151 / 169Health citations — state benchmarkedThis home is ranked 151st out of 169 homes in Wisconsin.Shows this facility's total health deficiency citations benchmarked to the Wisconsin state average, with a ranking across all 169 WI SNFs. Lower citation counts earn a better rank.

Wisconsin average 27.3

Citations per inspection
3.1 Rank #49 / 169Citations per inspection — state benchmarkedThis home is ranked 49th out of 169 homes in Wisconsin.Shows average deficiency citations per CMS inspection for this facility versus the Wisconsin mean across 169 SNFs with citation data. Lower is better.

Wisconsin average 4.19


Health citations are formal notices following inspections when they fail to comply with safety and care standards.

15 of 62 citations resulted from standard inspections; 38 of 62 resulted from complaint investigations; and 9 of 62 came from combined inspections (standard and complaint).

Breakdown of citation severity (last 3 years)
Critical Health citations More info
6
567% worse than Wisconsin average

Wisconsin average: 0.9


Serious Health citations More info 3
150% worse than Wisconsin average

Wisconsin average: 1.2

6 critical citations More info Wisconsin average: 0.9

3 serious citations More info Wisconsin average: 1.2

53 moderate citations More info Wisconsin average: 24.7

0 minor citations More info Wisconsin average: 0.6
Citations history (last 3 years)
Resident Rights moderate citation Info Issues related to resident's rights, including dignity, privacy, and the ability to make decisions about their care. Feb 19, 2025
Corrected

Administration moderate citation Info Issues related to how the facility is managed, including policies, procedures, and compliance with regulations. Nov 14, 2024
Corrected

Infection Control critical citation Info Issues related to preventing and controlling infections, including hygiene practices and safety protocols. Nov 14, 2024
Corrected

Infection Control moderate citation Info Issues related to preventing and controlling infections, including hygiene practices and safety protocols. Nov 14, 2024
Corrected

Financial Assistance for
Nursing Home in Wisconsin

Watertown Health Care Center is located in Watertown, Wisconsin.
Here are the financial assistance programs available to residents in Wisconsin.

Get Financial aid guidance

Family Care Program

WI Medicaid Family Care

Age 65+ or disabled
General Wisconsin resident, Medicaid-eligible, long-term care need.
Income Limits (2025) ~$2,829/month 300% FBR, individual
Asset Limits $2,000 (individual), $3,000 (couple).
WI

Managed care model; rural/urban balance.

Benefits
Personal care (5-7 hours/day) Respite (240 hours/year) Adult day care ($65/day) Home modifications ($1,500 avg.)

Wisconsin Caregiver Support Program

WI NFCSP Respite

Age Caregiver of someone 60+ (or with dementia)
General Wisconsin resident.
Income Limits No strict limit; prioritizes low-income.
Asset Limits Not applicable.
WI

High rural demand; ADRC coordination.

Benefits
In-home respite (4-6 hours/day) Adult day care (~$65/day) Short-term facility care (up to 5 days)

IRIS (Include, Respect, I Self-Direct)

Wisconsin IRIS

Age 65+ (or disabled 18+)
General WI resident, Medicaid-eligible, NFLOC.
Income Limits (2025) ~$2,829/month; QIT optional.
Asset Limits $2,000 (individual), $3,000 (couple).
WI

Flexible budget; serves ~20,000; participant hires caregivers.

Benefits
Personal care (custom hours) Respite Home mods Equipment Transportation Support services

SeniorCare Prescription Drug Assistance

Wisconsin SeniorCare

Age 65+
General WI resident, US citizen/qualified immigrant, not on full Medicaid.
Income Limits (2025) ~$24,980-$34,980/year (Level 1-2B, individual); varies by level.
Asset Limits None.
WI

Four benefit levels; serves ~50,000 annually.

Benefits
$5 generic/$15 brand copays (Level 1); deductibles ($500-$850) for higher levels; covers most Rx drugs

Medicare Savings Program (MSP)

Wisconsin Medicare Savings Program

Age 65+ or disabled
General WI resident, Medicare Part A/B.
Income Limits (2025) ~$2,510/month (QMB), ~$3,380/month (SLMB), ~$3,598/month (QI)—individual.
Asset Limits $9,430 (individual), $14,130 (couple).
WI

Includes Extra Help for Part D; no waitlist.

Benefits
Covers Part B premiums ($174.70/month) Deductibles ($240/year) Copays (~20%)

Wisconsin Home Energy Assistance Program (WHEAP)

Wisconsin WHEAP

Age 60+ prioritized
General WI resident, low-income household.
Income Limits (2025) ~$3,970/month 185% FPL
Asset Limits Not assessed.
WI

Covers gas, electric, wood; crisis aid available.

Benefits
Heating/electric aid ($300-$1,000/season) Crisis aid ($500 max) Weatherization

Senior Community Service Employment Program (SCSEP)

Wisconsin SCSEP

Age 55+
General unemployed, low-income, WI resident.
Income Limits (2025) ~$1,983/month 125% FPL
Asset Limits Not specified.
WI

Priority for veterans, rural residents; Goodwill/AARP partnership.

Benefits
Paid training (~20 hours/week at ~$7.25/hour) Job placement

VA Aid and Attendance (A&A) and Housebound Benefits

Wisconsin VA Aid and Attendance/Housebound

Age 65+ or disabled veteran/spouse
General WI resident, wartime service, ADL help (A&A) or homebound.
Income Limits (2025) Net income < ~$1,984/month (veteran with dependent, A&A); pension offsets income.
Asset Limits ~$155,356 net worth
WI

High rural veteran use; supports care costs.

Benefits
Cash (~$1,433-$2,642/month veteran, ~$951-$1,318 spouse) for care costs

Property Tax Deferral Loan Program

Wisconsin Property Tax Deferral Loan

Age 65+
General WI resident, homeowner, live in home 6+ months/year.
Income Limits (2025) ~$24,980/year household
Asset Limits Home equity < $500,000; limited other assets.
WI

Saves ~$500-$1,500/year; interest ~2%-3%.

Benefits
Deferred tax payment (~$500-$1,500/year avg.)

Senior Farmers’ Market Nutrition Program (SFMNP)

Wisconsin SFMNP

Age 60+
General WI resident, low-income.
Income Limits (2025) ~$2,322/month 185% FPL
Asset Limits Not assessed.
WI

Vouchers (~$45/season); serves ~15,000 annually.

Benefits
Vouchers (~$45/season) for produce at farmers’ markets

Places of interest near Watertown Health Care Center

Address 2.4 miles from city center Info Estimated distance in miles from Watertown's city center to Watertown Health Care Center's address, calculated via Google Maps. — 0.09 miles to nearest hospital (Watertown Regional Medical Center)

Calculate Travel Distance to Watertown Health Care Center

Add your location

Address

Staffing Data (Q2 2025)

This data corresponds to Q2 2025 and is based on CMS Payroll-Based Journal.

Total staff 68
Employees 64
Contractors 4
Staff to resident ratio 1.01:1
58% worse than Wisconsin average

Wisconsin average ratio: 2.41:1

Avg staff/day 28
Average shift 7.7 hours
5% better than Wisconsin average

Wisconsin average: 7.3 hours

Total staff hours (quarter) 19,580
Nursing staff breakdown
Registered Nurse

Manages medical care and health needs.

Total count 8
Average shift length Info Average shift length. Calculated as total hours divided by days worked and average staff per day. 8.9 hours

No contractors work on this role.

Licensed Practical Nurse

Assists with medical care and medications.

Total count 13
Average shift length Info Average shift length. Calculated as total hours divided by days worked and average staff per day. 7.7 hours

No contractors work on this role.

Certified Nursing Assistant

Helps with daily care and mobility.

Total count 33
Average shift length Info Average shift length. Calculated as total hours divided by days worked and average staff per day. 7.6 hours

No contractors work on this role.

Contractor staffing

Total hours from contractors

0.5%

104 contractor hours this quarter

Occupational Therapy Aide: 2 Medical Director: 1 Occupational Therapy Assistant: 1
Staff by category
Certified Nursing Assistant330339,29291100%7.6
Licensed Practical Nurse130133,55091100%7.7
Registered Nurse8082,99291100%8.9
RN Director of Nursing2025255560%7.7
Administrator1015126470%8
Nurse Practitioner1015126470%8
Dietitian1015126470%8
Mental Health Service Worker1014806066%8
Dental Services Staff1014726066%7.9
Medication Aide/Technician2024566167%7.3
Other Dietary Services Staff1011742730%6.4
Occupational Therapy Aide0226189%7.6
Medical Director0112567%4.1
Occupational Therapy Assistant01119910%2.1
33 Certified Nursing Assistant
% of Days 100%
13 Licensed Practical Nurse
% of Days 100%
8 Registered Nurse
% of Days 100%
2 RN Director of Nursing
% of Days 60%
1 Administrator
% of Days 70%
1 Nurse Practitioner
% of Days 70%
1 Dietitian
% of Days 70%
1 Mental Health Service Worker
% of Days 66%
1 Dental Services Staff
% of Days 66%
2 Medication Aide/Technician
% of Days 67%
1 Other Dietary Services Staff
% of Days 30%
2 Occupational Therapy Aide
% of Days 9%
1 Medical Director
% of Days 7%
1 Occupational Therapy Assistant
% of Days 10%

Facility Characteristics

Source: CMS Long-Term Care Facility Characteristics (Data as of Jan 2026)

Total residents 67
Medicare
9
13.4% of residents
Medicaid
47
70.1% of residents
Private pay or other
11
16.4% of residents
Programs & Services
Residents Group

Residents meet regularly to discuss policies, care quality, and activities

Active Resident Council

Organized group of residents that meets regularly to discuss facility policies, quality of life, and activities.

Quality of care over time

These measures show how residents usually do over time at this home, based on health outcomes and preventive care.

High-risk clinical events score Info A composite score based on pressure ulcers, falls with injury, weight loss, walking ability decline, and activities of daily living decline. 9.9
5% better than Wisconsin average

Wisconsin average: 10.5

Functional decline score Info A composite score based on activities of daily living decline, walking ability decline, and incontinence. 17.3
22% better than Wisconsin average

Wisconsin average: 22.1

Long-stay resident measures
Below average Wisconsin avg: 3.0 Info CMS star rating based on long-stay quality measure performance. 5 stars = significantly above average, 1 star = significantly below average.
Need for Help with Daily Activities Increased Info Percent of long-stay residents whose need for help with daily activities has increased 11.1%
37% better than Wisconsin average

Wisconsin average: 17.6%

Walking Ability Worsened Info Percent of long-stay residents whose ability to move independently worsened 17.6%
23% better than Wisconsin average

Wisconsin average: 22.8%

Low Risk Residents with Bowel/Bladder Incontinence Info Percent of low risk long-stay residents who lose control of their bowels or bladder 23.2%
11% better than Wisconsin average

Wisconsin average: 26.0%

Falls with Major Injury Info Percent of long-stay residents experiencing one or more falls with major injury 3.3%
In line with Wisconsin average

Wisconsin average: 3.2%

High Risk Residents with Pressure Ulcers Info Percent of long-stay high risk residents with pressure ulcers 13.3%
143% worse than Wisconsin average

Wisconsin average: 5.4%

Urinary Tract Infection Info Percent of long-stay residents with a urinary tract infection 6.7%
110% worse than Wisconsin average

Wisconsin average: 3.2%

Lost Too Much Weight Info Percent of long-stay residents who lose too much weight 4.3%
11% better than Wisconsin average

Wisconsin average: 4.9%

Depressive Symptoms Info Percent of long-stay residents who have depressive symptoms 6.5%
30% worse than Wisconsin average

Wisconsin average: 5.0%

Antipsychotic Use Info Percent of long-stay residents who received an antipsychotic medication 29.3%
83% worse than Wisconsin average

Wisconsin average: 16.1%

Pneumococcal Vaccine Info Percent of long-stay residents assessed and appropriately given the pneumococcal vaccine 100.0%
In line with Wisconsin average

Wisconsin average: 95.9%

Influenza Vaccine Info Percent of long-stay residents assessed and appropriately given the seasonal influenza vaccine 100.0%
5% better than Wisconsin average

Wisconsin average: 95.0%

Hospitalizations per 1,000 days Info Number of hospitalizations per 1,000 long-stay resident days. 1.65
In line with Wisconsin average

Wisconsin average: 1.61

ED visits per 1,000 days Info Number of outpatient emergency department visits per 1,000 long-stay resident days. 3.76
72% worse than Wisconsin average

Wisconsin average: 2.19

Short-stay resident measures
Significantly below average Wisconsin avg: 2.9 Info CMS star rating based on short-stay quality measure performance. 5 stars = much above average, 1 star = much below average.
Pneumococcal Vaccine Info Percent of short-stay residents assessed and appropriately given the pneumococcal vaccine 95.0%
9% better than Wisconsin average

Wisconsin average: 87.3%

Antipsychotic medication increase Info Percent of short-stay residents who newly received an antipsychotic medication 1.1%
10% better than Wisconsin average

Wisconsin average: 1.2%

Influenza Vaccine Info Percent of short-stay residents assessed and appropriately given the seasonal influenza vaccine 90.0%
9% better than Wisconsin average

Wisconsin average: 82.2%

Re-hospitalized after SNF stay Info Percentage of short-stay residents who were re-hospitalized after their nursing home admission. 22.3%
In line with Wisconsin average

Wisconsin average: 22.7%

Emergency department visits Info Percentage of short-stay residents who had an outpatient emergency department visit. 13.8%
8% better than Wisconsin average

Wisconsin average: 15.0%

Falls with major injury Info Percentage of SNF residents who experience falls with major injury during their stay. 0.0%
100% better than Wisconsin average

Wisconsin average: 0.8%

Successful return to home or community Info Rate of successful return to home or community from a skilled nursing facility. 49.0%
In line with Wisconsin average

Wisconsin average: 50.6%

Penalties and fines

Federal penalties imposed by CMS for regulatory violations, including civil money penalties (fines) and denials of payment for new Medicare/Medicaid admissions.

Source: CMS Penalties Database (Data as of Jan 2026)

Total fines amount $286K
199% higher than Wisconsin average

Wisconsin average: $95K

Number of fines 6
191% more fines than Wisconsin average

Wisconsin average: 2.1

Payment Denials Info Serious action where Medicare and/or Medicaid temporarily stops payments for new residents until issues are fixed. 2
202% more payment denials than Wisconsin average

Wisconsin average: 0.7

Fines amount comparison
This facility $286K
Wisconsin average $95K
Penalty History

Penalties are imposed by CMS for violations of federal nursing home regulations.

7 penalties in the past 3 years

Multiple penalties were reported in the last 3 years.

Civil Money Penalty Info Fines imposed for noncompliance, which can be assessed per day or per instance of violation. Oct 17, 2024
$175K
Payment Denial Info Serious action where Medicare and/or Medicaid temporarily stops payments for new residents until issues are fixed. Oct 17, 2024
43 days
Civil Money Penalty Info Fines imposed for noncompliance, which can be assessed per day or per instance of violation. Jun 4, 2024
$16K
Civil Money Penalty Info Fines imposed for noncompliance, which can be assessed per day or per instance of violation. Jun 4, 2024
$40K

Last updated: Jan 2026

Compare Nursing Homes around Watertown The information below is reported by the Wisconsin Department of Health Services, Division of Quality Assurance.

Filter by care type
Watertown Health Care Center
NH

Nursing Home Licensed facility providing 24/7 skilled nursing care for residents with complex, ongoing medical needs. Staffed by RNs, LPNs, and CNAs. Inspected and star-rated annually by CMS. Accepts Medicare (short-term rehab) and Medicaid (long-term care).

Watertown -112 28-

Guides for Better Senior Living

Care Cost Calculator: See Prices in Your Area

Nursing Home Data Explorer

Don’t Wait Too Long: 7 Red Flag Signs Your Parent Needs Assisted Living Now

The True Cost of Assisted Living in 2025 – And How Families Are Paying For It

Understanding Senior Living Costs: Pricing Models, Discounts & Financial Assistance

Explore Open Rooms
1 Contact details
2 What type of senior care service are you looking for?
3 What budget do you have in mind for senior care?
4 How soon do you need to find care?
5 Additional details

Thank you for your interest!

Our team will be in touch shortly to help with next steps.