Welbrook Centennial Hills, Llc
Nursing Home, Nursing Care, Palliative Care & Respite Care · Las Vegas, NV
CMS overall rating Info CMS (the Centers for Medicare & Medicaid Services) is the federal agency that rates nursing home quality. Its Overall Rating runs from 1 to 5 stars, combining health inspections, staffing, and quality measures, with inspections weighted most heavily.

Welbrook Centennial Hills, Llc

Nursing Home, Nursing Care, Palliative Care & Respite Care · Las Vegas, NV
CMS overall rating Info CMS (the Centers for Medicare & Medicaid Services) is the federal agency that rates nursing home quality. Its Overall Rating runs from 1 to 5 stars, combining health inspections, staffing, and quality measures, with inspections weighted most heavily.
Calculator: See prices in your area
Welbrook Centennial Hills, Llc accepts Medicare and private pay.

Overview of Welbrook Centennial Hills, LLC

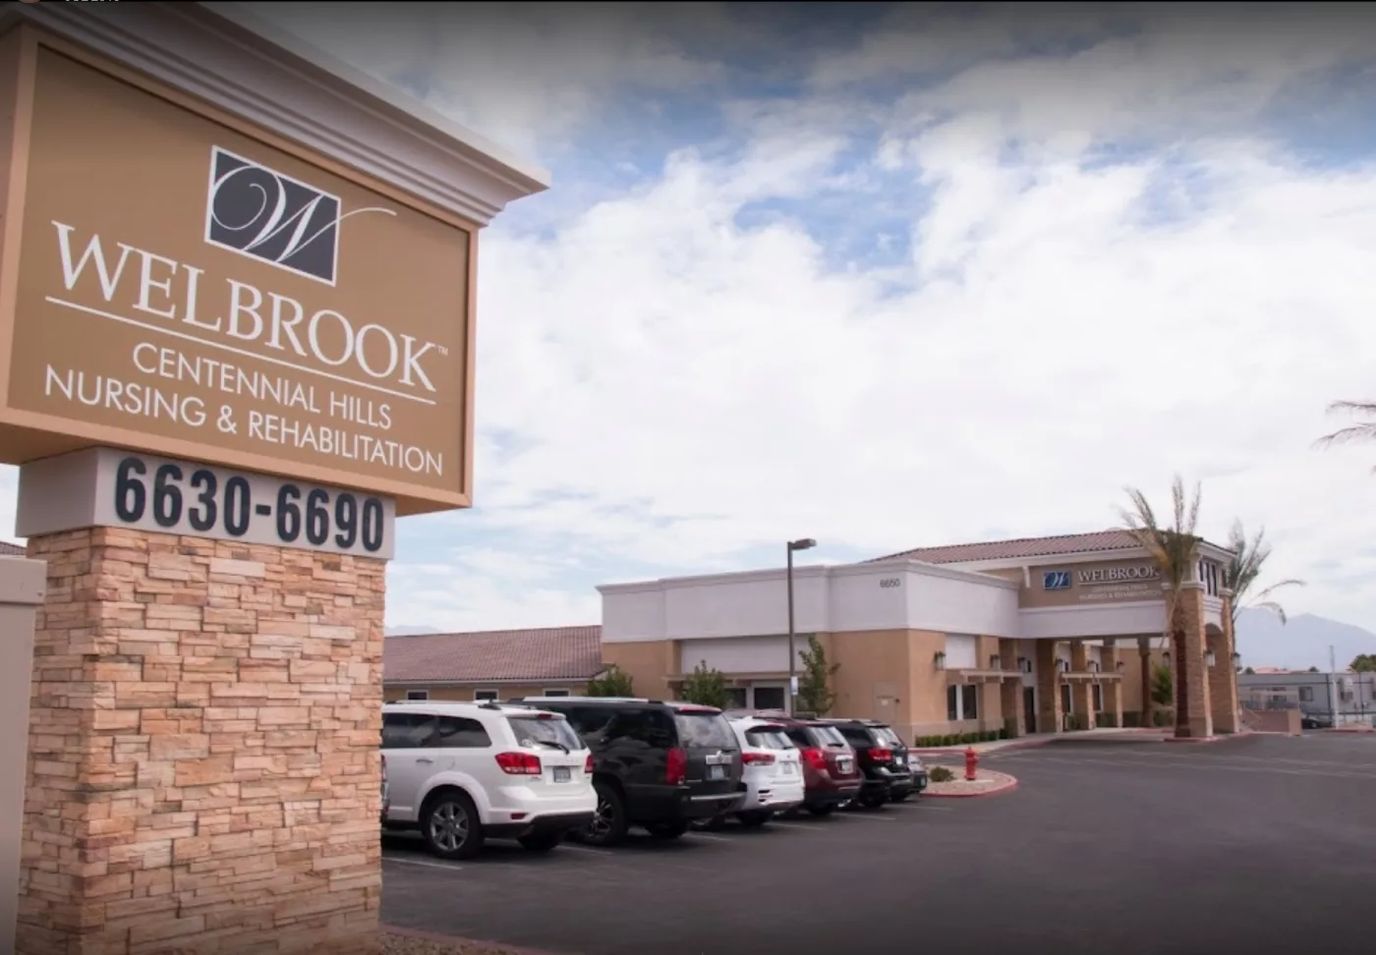
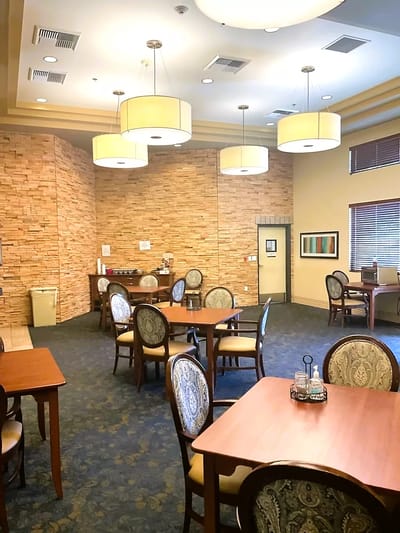
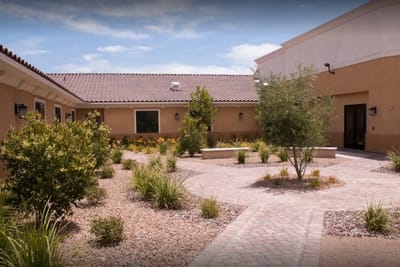
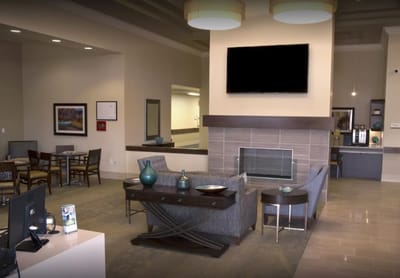
Welbrook Centennial Hills provides an excellent standard for resident-centered service and a personalized care program. The nursing home promotes independence while receiving assistance with daily living. The dedicated and compassionate care staff in the community ensure to encourage a welcoming and comfortable atmosphere for their residents to feel at home. Welbrook Centennial Hills provides the highest quality of standard rehabilitative service for their residents, sure to bring them as quickly as possible to their loved ones. 
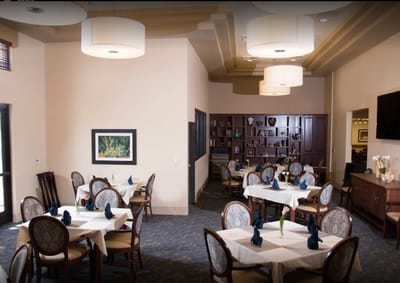
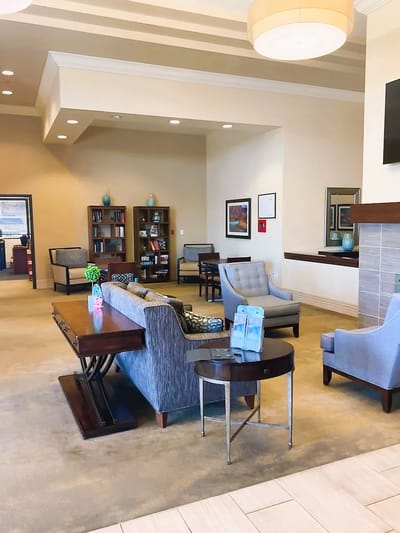
The Welbrook lifestyle difference strives in providing an empowering and engaging environment for its residents to thrive and grow as individuals. The list of community services and amenities is designed to highly encourage an experience that is comfortable and secure. From movie rooms to spa features, Welbook strives to maintain a luxurious level of rehabilitation. 

Quality ratings

Measured by Centers for Medicare & Medicaid Services (CMS)

Overall rating Info The Overall CMS Rating combines results from health inspections, staffing levels and quality measures. Health inspections carry the most weight. Staffing and quality scores can increase or decrease the final rating based on performance compared to state and national standards.
▲ 65.8% Above NV avg. ▲ 65.8% Above NV avg.NV average: 3.0Click the badge to see the full State ranking.Click here to see the full State ranking.
Health Inspection Info Based on the results of the facility's three most recent standard inspections and any complaint investigations. CMS reviews the number, scope, and severity of deficiencies, with more recent findings weighted more heavily.
▲ 40.5% Above NV avg. ▲ 40.5% Above NV avg.NV average: 2.8Click the badge to see the full State ranking.Click here to see the full State ranking.
Staffing Info Measures average nursing staff hours per resident per day, including Registered Nurses (RNs) and total nursing staff. Ratings are adjusted based on the level of care residents require and are compared to state and national benchmarks.
▼ 3.5% Below NV avg. ▼ 3.5% Below NV avg.NV average: 3.1Click the badge to see the full State ranking.Click here to see the full State ranking.
Quality Measures Info Based on clinical and physical health indicators reported to CMS, such as hospital readmissions, falls, pressure ulcers, and improvements in mobility. These measures reflect how well residents' health needs are being managed.
▲ 37.9% Above NV avg. ▲ 37.9% Above NV avg.NV average: 3.6Click the badge to see the full State ranking.Click here to see the full State ranking.

Staffing hours breakdown

Info Daily nursing hours per resident by staff type, reported to CMS. Higher is generally better — compare this facility to state and national averages to see where staffing stands.

Hours per resident per day — compared to Nevada state averages

Total nursing care / resident Info This home is ranked 30th out of 46 homes in Nevada for nurse hours. Total adjusted nursing hours per resident per day, combining RN, LPN, and aide time. CMS adjusts this for case-mix so facilities can be fairly compared.
3h 18m per day
Rank #30 / 46Nurse hours — State benchmarkedThis home is ranked 30th out of 46 homes in Nevada. Shows adjusted nurse hours per resident per day benchmarked to the Nevada average, with a ranking across 46 Nevada facilities. More hours mean more direct care. The national average is about 3.5 hrs; below 3.0 is a red flag.Rankings are based only on facilities in Nevada that report data for that category. Facilities without available data are excluded from the ranking.Click the rank badge to see the full State ranking.Click here to see the full State ranking.
This facility Nevada avg (4h 2m per day)
vs Nevada avg
-18%

2 of 6 metrics below state avg

Standout metric Physical Therapist is +178% above state avg
Staff typeHours / Day / Residentvs state avg
Registered Nurse (RN) Info RNs hold the highest nursing license and can assess residents, interpret test results, and direct care plans. More RN hours per day often signals stronger clinical oversight and faster response to health changes. 1h 53m per day ▲ 76% State avg: 1h 4m per day · National avg: 41m per day
LPN / LVN Info Licensed Practical Nurses (LPNs) or Licensed Vocational Nurses (LVNs) deliver routine hands-on care — medication administration, wound dressing, and monitoring vital signs. They work under RN supervision and make up a large share of daily bedside care. 47m per day ▼ 13% State avg: 54m per day · National avg: 52m per day
Nurse Aide Info Certified Nurse Aides (CNAs) provide the most direct day-to-day assistance: bathing, dressing, feeding, and mobility. Nurse aide hours are typically the largest staffing category and directly affect residents' quality of life. 2h 2m per day ▼ 15% State avg: 2h 23m per day · National avg: 2h 21m per day
Weekend Total Nursing Info Combined nursing hours (RN + LPN + Nurse Aide) per resident per day on weekends. Staffing often drops on weekends — this figure reveals whether the facility maintains adequate coverage outside of weekday hours. 4h 9m per day ▲ 8% State avg: 3h 51m per day · National avg: 3h 26m per day
Physical Therapist Info Hours per resident per day provided by licensed Physical Therapists (PTs) or PT Assistants. PT services help residents recover mobility after injury or illness and are especially important for post-acute (short-stay) rehabilitation. 14m per day ▲ 178% State avg: 5m per day · National avg: 4m per day
Weekend RN Info Registered nurse hours specifically on weekends. Facilities sometimes reduce RN presence on Saturdays and Sundays — a low weekend RN figure compared to weekday hours can indicate reduced clinical oversight when most administrative staff are absent. 1h 40m per day ▲ 97% State avg: 51m per day · National avg: 29m per day

Capacity and availability

This home is often near full

Higher occupancy than the Nevada average: 81.5%
Occupancy rate
133.3% Rank #203 / 267Occupancy rate — State benchmarkedThis home is ranked 203rd out of 267 homes in Nevada. Shows this facility's occupancy rate versus the Nevada average, with its Statewide rank out of 267. Higher occupancy signals strong local demand and financial stability.Rankings are based only on facilities in Nevada that report data for that category. Facilities without available data are excluded from the ranking.Click the rank badge to see the full State ranking.Click here to see the full State ranking.
Avg. Length of Stay
17 days
Bed community size
45-bed community Rank #93 / 321Bed count — State benchmarkedThis home is ranked 93rd out of 321 homes in Nevada. Shows this facility's certified or reported bed count compared to other Nevada facilities. Larger communities may offer more amenities, programs, and on-site services for residents and families.Rankings are based only on facilities in Nevada that report data for that category. Facilities without available data are excluded from the ranking.Click the rank badge to see the full State ranking.Click here to see the full State ranking.
A moderately sized community that may balance personal attention with shared amenities and social activities.
Years in operation
12 years in operation Rank #130 / 277Years in operation — State benchmarkedThis home is ranked 130th out of 277 homes in Nevada. Shows how long this facility has been in operation compared to other Nevada facilities. Longer operating histories may benefit residents, families, and staff.Rankings are based only on facilities in Nevada that report data for that category. Facilities without available data are excluded from the ranking.Click the rank badge to see the full State ranking.Click here to see the full State ranking.
A community with a solid operating history and experience delivering ongoing care.
Walk Score
Walk Score: 48 / 100 Rank #199 / 414Walk Score — State benchmarkedThis home is ranked 199th out of 414 homes in Nevada. Shows how walkable this facility's neighborhood is compared to the average Walk Score across Nevada facilities. Higher scores benefit residents, families, and staff.Rankings are based only on facilities in Nevada that report data for that category. Facilities without available data are excluded from the ranking.Click the rank badge to see the full State ranking.Click here to see the full State ranking.
Somewhat walkable. A few nearby services may be reachable on foot, but most trips require transportation.
BBB Rating
BBB Rating: B- (Not Accredited)
An independent rating from the Better Business Bureau based on factors such as complaint history, transparency, and business practices.
How BBB ratings work

About this community

License Details

CMS Certification Number295097

Staffing

Key information about the people who lead and staff this community.

Leadership

ContactMx. Hari Mali, Manager

Contact Welbrook Centennial Hills, Llc

Inspection History

In Nevada, the Department of Health and Human Services, Bureau of Health Care Quality and Compliance performs unannounced onsite surveys to evaluate resident safety and care quality.

Since 2023 · 3 years of data 31 deficiencies

Inspection Scorecard Info This scorecard compares key inspection, deficiency, and complaint metrics at this facility against the Nevada state average. Metrics rated ≥15% worse than average are highlighted in red; those ≥15% better are highlighted in green.

Since 2023 vs. Nevada state average
Overall vs. NV average 0 Worse No metrics in this bucket. 2 Better Metrics better than Nevada average:
• Total deficiencies (50% below)
• Deficiencies per year (50% below)
Latest Inspection April 9, 2025 Annual Inspection

Deficiencies Info Deficiencies are formal regulatory issues recorded during state inspections.

This FacilityNV Averagevs. NV Avg
Total deficiencies Info Formal regulatory issues recorded by inspectors across all inspection types. 3162 This facility has 50% fewer total deficiencies than a typical Nevada nursing home (31 vs. NV avg 62).↓ 50% better
Deficiencies per year Info Average deficiencies per year since 2023. 10.320.7 This facility has 50% fewer deficiencies per year than a typical Nevada nursing home (10.3 vs. NV avg 20.7).↓ 50% better

Inspection Reports Summary Info An editor-reviewed summary of the themes and findings across this facility's recent inspection reports.

  • April 9, 2025 annual inspection cited 4 deficiencies including medication labeling and privacy, all with minimal or potential harm and no complaints substantiated.
  • August 9, 2023 complaint investigation found 5 deficiencies including resident abuse by spouse, failure to follow CPR protocols, and failure to prevent elopement.
  • April 28, 2023 routine inspection cited 15 deficiencies covering staffing shortages, wound care, medication security, and infection control, indicating widespread compliance issues.

Health Inspection History

Inspections since 2023
Total health inspections 4

Nevada average 5.1


Last Health inspection on Apr 2025

Total health citations
30 Rank #21 / 48Health citations — State benchmarkedThis home is ranked 21st out of 48 homes in Nevada. Shows this facility's total health deficiency citations benchmarked to the Nevada State average, with a ranking across all 48 NV facilities. Lower citation counts earn a better rank.Rankings are based only on facilities in Nevada that report data for that category. Facilities without available data are excluded from the ranking.Click the rank badge to see the full State ranking.Click here to see the full State ranking.

Nevada average 36.2

Citations per inspection
7.5 Rank #33 / 48Citations per inspection — State benchmarkedThis home is ranked 33rd out of 48 homes in Nevada. Shows average deficiency citations per CMS inspection for this facility versus the Nevada mean across 48 facilities with citation data. Lower is better.Rankings are based only on facilities in Nevada that report data for that category. Facilities without available data are excluded from the ranking.Click the rank badge to see the full State ranking.Click here to see the full State ranking.

Nevada average 7.08


Health citations are formal notices following inspections when they fail to comply with safety and care standards.

19 of 30 citations resulted from standard inspections; 6 of 30 resulted from complaint investigations; and 5 of 30 came from combined inspections (standard and complaint).

Breakdown of citation severity (last 3 years)
Critical health citations
0
100% better than Nevada average

Nevada average: 0.1


Serious health citations
0
100% better than Nevada average

Nevada average: 0.5

0 critical citations Nevada average: 0.1

0 serious citations Nevada average: 0.5

30 moderate citations Nevada average: 35

0 minor citations Nevada average: 0.5
Citations history (last 3 years)
Nursing Services moderate citation Apr 09, 2025
Corrected

Pharmacy moderate citation Apr 09, 2025
Corrected

Quality of Care moderate citation Apr 09, 2025
Corrected

Resident Rights moderate citation Apr 09, 2025
Corrected

Staffing Data

Reporting period: October 1 – December 31, 2025 (Q4 2025). Source: CMS Payroll-Based Journal report.

Total staff 147
Employees 146
Contractors 1
Staff to resident ratio 3.59 : 1
133% more staff per resident than Nevada average
Nevada average ratio: 1.54 : 1 Nevada average ratio: 1.54 : 1See full Nevada ranking
Avg staff/day 36
Average shift 8.2 hours
7% worse than Nevada average
Nevada average: 8.8 hours Nevada average shift: 8.8 hoursSee full Nevada ranking
Total staff hours (quarter) 27,261

Nursing staff breakdown

Q4 2025 · Oct 1 – Dec 31 More info This data comes from the CMS Payroll-Based Journal report covering October 1 – December 31, 2025.
Registered Nurse

Manages medical care and health needs.

RN Staff Info All 33 RN Staff are full-time employees. No contractors work on this role. 33
Average shift length Info Average shift length. Calculated as total hours divided by days worked and average staff per day. 9.3 hours
Licensed Practical Nurse

Assists with medical care and medications.

LPN Staff Info All 15 LPN Staff are full-time employees. No contractors work on this role. 15
Average shift length Info Average shift length. Calculated as total hours divided by days worked and average staff per day. 8.9 hours
Certified Nursing Assistant

Helps with daily care and mobility.

CNA Staff Info All 46 CNA Staff are full-time employees. No contractors work on this role. 46
Average shift length Info Average shift length. Calculated as total hours divided by days worked and average staff per day. 9.4 hours

Contractor staffing

Q4 2025 · Oct 1 – Dec 31 More info This data comes from the CMS Payroll-Based Journal report covering October 1 – December 31, 2025.

Total hours from contractors

0.5%

148 contractor hours this quarter

Medical Director: 1

Staff by category

Q4 2025 · Oct 1 – Dec 31 More info This data comes from the CMS Payroll-Based Journal report covering October 1 – December 31, 2025.
Certified Nursing Assistant460467,97492100%9.4
Registered Nurse330336,39592100%9.3
Licensed Practical Nurse150152,5639098%8.9
Physical Therapy Aide9091,5368693%7.1
Speech Language Pathologist7071,5108795%6.9
Other Dietary Services Staff4049477986%6.8
Physical Therapy Assistant8089198491%6
Respiratory Therapy Technician8089118997%6.4
Qualified Social Worker2026017784%5.8
Occupational Therapy Aide2025347784%6.9
RN Director of Nursing2025345762%8.9
Nurse Practitioner1015126470%8
Administrator2025086470%7.9
Clinical Nurse Specialist3034855560%8.1
Dietitian1014725964%8
Mental Health Service Worker1013844852%8
Dental Services Staff2023293841%8.2
Medical Director0111483740%4
46 Certified Nursing Assistant
% of Days 100%
33 Registered Nurse
% of Days 100%
15 Licensed Practical Nurse
% of Days 98%
9 Physical Therapy Aide
% of Days 93%
7 Speech Language Pathologist
% of Days 95%
4 Other Dietary Services Staff
% of Days 86%
8 Physical Therapy Assistant
% of Days 91%
8 Respiratory Therapy Technician
% of Days 97%
2 Qualified Social Worker
% of Days 84%
2 Occupational Therapy Aide
% of Days 84%
2 RN Director of Nursing
% of Days 62%
1 Nurse Practitioner
% of Days 70%
2 Administrator
% of Days 70%
3 Clinical Nurse Specialist
% of Days 60%
1 Dietitian
% of Days 64%
1 Mental Health Service Worker
% of Days 52%
2 Dental Services Staff
% of Days 41%
1 Medical Director
% of Days 40%

Penalties and fines

Federal penalties imposed by CMS for regulatory violations, including civil money penalties (fines) and denials of payment for new Medicare/Medicaid admissions.

Source: CMS Penalties Database

No penalties in the past 3 years

No civil money penalties or payment denials were reported in the last 3 years.

Quality of care over time

These measures show how residents usually do over time at this home, based on health outcomes and preventive care.

Short-stay resident measures
Significantly above average Nevada avg: 3.1 Info CMS star rating based on short-stay quality measure performance. 5 stars = much above average, 1 star = much below average.
Pneumococcal Vaccine Info Percent of short-stay residents assessed and appropriately given the pneumococcal vaccine 95.9%
14% better than Nevada average

Nevada average: 83.9%

Antipsychotic medication increase Info Percent of short-stay residents who newly received an antipsychotic medication 0.6%
73% better than Nevada average

Nevada average: 2.0%

Influenza Vaccine Info Percent of short-stay residents assessed and appropriately given the seasonal influenza vaccine 95.5%
18% better than Nevada average

Nevada average: 80.7%

Re-hospitalized after SNF stay Info Percentage of short-stay residents who were re-hospitalized after their nursing home admission. 23.1%
In line with Nevada average

Nevada average: 23.4%

Emergency department visits Info Percentage of short-stay residents who had an outpatient emergency department visit. 8.2%
16% better than Nevada average

Nevada average: 9.8%

Falls with major injury Info Percentage of SNF residents who experience falls with major injury during their stay. 0.7%
In line with Nevada average

Nevada average: 0.8%

Ability to care for self at discharge Info Percentage of residents at or above expected ability to care for themselves at discharge. 74.2%
38% better than Nevada average

Nevada average: 53.7%

Successful return to home or community Info Rate of successful return to home or community from a skilled nursing facility. 50.8%
In line with Nevada average

Nevada average: 50.6%

Breakdown by payment type

Medicare

19% of new residents, usually for short-term rehab.

Typical stay 26 days

Private pay

81% of new residents, often for short stays.

Typical stay 16 days

Facility Characteristics

Source: CMS Long-Term Care Facility Characteristics (Data as of Jan 2026)

Total residents 41
Medicare
21
51.2% of residents
Private pay or other
20
48.8% of residents

Finances and operations

Based on CMS SNF Cost Report for fiscal year ending in 12/2022.

For-profit
Corporation
Net patient revenue Info Net patient revenue — what the home actually collects for resident care, after contractual allowances, bad debt and discounts are subtracted from its gross charges (CMS cost report, Worksheet G-3). It covers resident care only; money the home earns from other sources is shown separately as "Other income."
$1.1M
Net patient income Info Net patient income: net patient revenue minus the home's total operating expenses. A positive figure means it earns more from resident care than it spends to deliver it; a negative figure means the opposite. It excludes non-operating "other income."
-$255.1K
For-profit Corporation
Net patient revenue Info Net patient revenue — what the home actually collects for resident care, after contractual allowances, bad debt and discounts are subtracted from its gross charges (CMS cost report, Worksheet G-3). It covers resident care only; money the home earns from other sources is shown separately as "Other income."
$1.1M Rank #30 / 47Revenue — State benchmarkedThis home is ranked 30th out of 47 homes in Nevada. Shows this facility's annual revenue compared to the Nevada average. Higher revenue generally means more resources for staffing and capital — read alongside Payroll %.Rankings are based only on facilities in Nevada that report data for that category. Facilities without available data are excluded from the ranking.Click the rank badge to see the full State ranking.Click here to see the full State ranking.
Net patient income Info Net patient income: net patient revenue minus the home's total operating expenses. A positive figure means it earns more from resident care than it spends to deliver it; a negative figure means the opposite. It excludes non-operating "other income."
-$255.1K
Other income Info Money the home earns outside of resident care — such as investments, grants, rentals and other non-operating sources (CMS cost report, Worksheet G-3). It is tracked separately from net patient revenue: it is not part of that figure, and it is not included in net patient income.
$71.8K
Payroll costs Info Staff salaries plus wage-related costs — benefits such as payroll taxes, health insurance and retirement — from the home's own accounting records (CMS cost report, Worksheet A). Contract or agency labor is counted separately, under other operating costs. Rank #38 / 47Payroll — State benchmarkedThis home is ranked 38th out of 47 homes in Nevada. Shows total annual staff payroll benchmarked to the Nevada average. Higher payroll investment relative to peers often signals better staffing and less reliance on cheaper contract labor.Rankings are based only on facilities in Nevada that report data for that category. Facilities without available data are excluded from the ranking.Click the rank badge to see the full State ranking.Click here to see the full State ranking.
$636.5K 60.2% of net patient revenue Info Payroll as a share of revenue: staff salaries and wage-related benefits divided by net patient revenue. A higher figure means more of each revenue dollar goes to staff pay. Rank #44 / 47Payroll % — State benchmarkedThis home is ranked 44th out of 47 homes in Nevada. Shows payroll as a percentage of revenue versus the Nevada average. Well-run Nevada facilities typically land around 47–60% — the top third Statewide. Below 25% may signal understaffing or heavy agency use — read with Staffing ratings.Rankings are based only on facilities in Nevada that report data for that category. Facilities without available data are excluded from the ranking.Click the rank badge to see the full State ranking.Click here to see the full State ranking.
Other operating costs Info Everything it costs to run the home apart from payroll — food, utilities, supplies, maintenance, contract labor and administration. Calculated as total operating expense minus payroll (staff salaries and wage-related benefits).
$675.8K
Total costs Info The home's total operating expense for the year — all the costs of running it, salaries included (CMS cost report, Worksheet G-3).
$1.3M

Who this home usually serves

TYPE OF STAY

Primarily short stays

Residents typically stay for brief periods, with frequent admissions and discharges throughout the year.

Most new residents arrive under private pay (81% of admissions), and a typical private pay stay runs around 16 days.

Admissions
99 total

Coverage residents most often arrive under.

Medicare 19%
Private pay 81%
Discharges
104 total

Coverage residents most often leave under.

Medicare 18%
Private pay 82%

Places of interest near Welbrook Centennial Hills, Llc

Address 6650 Grand Montecito Pkwy, Las Vegas, NV 89149 — 4.81 miles to nearest hospital (H2U Health Center at MountainView Hospital)

Calculate Travel Distance to Welbrook Centennial Hills, Llc

Add your location

Address

Compare Nursing Homes around Las Vegas

The information below is reported by the Nevada Department of Health and Human Services, Bureau of Health Care Quality and Compliance.

5 facilities compared · CMS & NV Dept. of Health data

Advanced Health Care of Las Vegas
NH
Las Vegas
38
Facility 38
NV AVG 42
Rank #98 / 321
89.5%
Facility 89.5%
NV AVG 81.5%
Rank #98 / 267
+10%
3.63
Facility 3.63
NV AVG 4.03
Rank #17 / 46
+13%-10%
$0
Facility $0
NV AVG $34.1k
Rank #1 / 48
11
Facility 11
NV AVG 36.2
Rank #2 / 48
3.7
Facility 3.7
NV AVG 7.1
Rank #4 / 48
-38A+
23
Facility 23
NV AVG 45
Rank #329 / 414
Joseph Walker
$10.3M
Facility $10.3M
NV AVG $18.7M
Rank #38 / 47
$4.8M
Facility $4.8M
NV AVG $6.3M
Rank #40 / 47
46.6%
Facility 46.6%
NV AVG 34.9%
Rank #31 / 47
295090
Marquis Centennial Hills
NH
HC
RC
Las Vegas (La Madre Foothills)
115
Facility 115
NV AVG 42
Rank #51 / 321
100.0%
Facility 100.0%
NV AVG 81.5%
Rank #147 / 267
+23%
3.52
Facility 3.52
NV AVG 4.03
Rank #22 / 46
-11%-13%
$0
Facility $0
NV AVG $34.1k
Rank #1 / 48
29
Facility 29
NV AVG 36.2
Rank #17 / 48
4.8
Facility 4.8
NV AVG 7.1
Rank #10 / 48
-182-
31
Facility 31
NV AVG 45
Rank #298 / 414
Jacob Atwood
$14.9M
Facility $14.9M
NV AVG $18.7M
Rank #25 / 47
$8.8M
Facility $8.8M
NV AVG $6.3M
Rank #22 / 47
59.3%
Facility 59.3%
NV AVG 34.9%
Rank #21 / 47
295089
Welbrook Centennial Hills, Llc
NH
NC
PC
RC
Las Vegas (Centennial Hills)
45
Facility 45
NV AVG 42
Rank #93 / 321
100.0%
Facility 100.0%
NV AVG 81.5%
Rank #203 / 267
+23%
3.30
Facility 3.30
NV AVG 4.03
Rank #30 / 46
+49%-18%
$0
Facility $0
NV AVG $34.1k
Rank #1 / 48
30
Facility 30
NV AVG 36.2
Rank #21 / 48
7.5
Facility 7.5
NV AVG 7.1
Rank #33 / 48
-60B-
48
Facility 48
NV AVG 45
Rank #199 / 414
Mphs Operating Holding LLC
$1.1M
Facility $1.1M
NV AVG $18.7M
Rank #30 / 47
$636.5k
Facility $636.5k
NV AVG $6.3M
Rank #38 / 47
60.2%
Facility 60.2%
NV AVG 34.9%
Rank #44 / 47
295097
Canyon Vista Post-Acute
NH
HC
MC
NC
RC
Las Vegas (Rhodes Ranch)
120
Facility 120
NV AVG 42
Rank #42 / 321
100.0%
Facility 100.0%
NV AVG 81.5%
Rank #1 / 267
+23%
3.03
Facility 3.03
NV AVG 4.03
Rank #42 / 46
+59%-25%
$35.0k
Facility $35.0k
NV AVG $34.1k
Rank #39 / 48
36
Facility 36
NV AVG 36.2
Rank #30 / 48
7.2
Facility 7.2
NV AVG 7.1
Rank #31 / 48
1115-
36
Facility 36
NV AVG 45
Rank #277 / 414
Nevada Opco LLC
$23.3M
Facility $23.3M
NV AVG $18.7M
Rank #5 / 47
$12.4M
Facility $12.4M
NV AVG $6.3M
Rank #8 / 47
53.1%
Facility 53.1%
NV AVG 34.9%
Rank #37 / 47
295093
El Jen Healthcare and Rehabilitation Services
NH
MC
NC
RC
Las Vegas (Rancho)
144
Facility 144
NV AVG 42
Rank #27 / 321
95.1%
Facility 95.1%
NV AVG 81.5%
Rank #63 / 267
+17%
4.36
Facility 4.36
NV AVG 4.03
Rank #5 / 46
-45%+8%
$34.7k
Facility $34.7k
NV AVG $34.1k
Rank #38 / 48
58
Facility 58
NV AVG 36.2
Rank #41 / 48
5.8
Facility 5.8
NV AVG 7.1
Rank #16 / 48
2137A+
41
Facility 41
NV AVG 45
Rank #250 / 414
El Jen Snf Operations Holdings LLC
$18.0M
Facility $18.0M
NV AVG $18.7M
Rank #27 / 47
$10.8M
Facility $10.8M
NV AVG $6.3M
Rank #12 / 47
60%
Facility 60%
NV AVG 34.9%
Rank #6 / 47
295008

Financial Assistance for
Nursing Home in Nevada

Welbrook Centennial Hills, Llc is located in Las Vegas, Nevada.
Here are the financial assistance programs available to residents in Nevada.

Get Financial aid guidance

Home and Community Based Waiver

Nevada Medicaid HCBW

Age 65+ or disabled
General Nevada resident, Medicaid-eligible, nursing home-level care need.
Income Limits (2025) ~$2,829/month 300% FBR, individual
Asset Limits $2,000 (individual), $3,000 (couple).
NV

High urban demand (e.g., Las Vegas); rural challenges.

Benefits
Personal care (5-7 hours/day) Respite (240 hours/year) Home modifications ($1,500 avg.) Meals ($6/meal)

Nevada Senior Services Program

NV SSP

Age 60+
General Nevada resident, at risk of decline.
Income Limits ~$1,800/month individual, varies
Asset Limits $5,000 individual
NV

Limited funding; rural focus.

Benefits
In-home care (3-5 hours/week) Respite (up to 10 days/year) Transportation (~5 trips/month)

Personal Care Services (PCS)

Nevada Personal Care Services

Age 19+ (65+ for seniors focus)
General Nevada resident, Medicaid-eligible, needs help with 1+ ADL.
Income Limits (2025) ~$967/month (individual); spenddown allowed.
Asset Limits $2,000 (individual), $3,000 (couple).
NV

Self-directed (family can be paid); statewide via DHHS.

Benefits
Personal care (4-6 hours/day) Limited homemaker services Respite (~200 hours/year)

Senior Rx Program

Nevada Senior Rx Program

Age 65+
General Nevada resident, enrolled in Medicare Part D, income below limit.
Income Limits (2025) ~$2,510/month (individual), ~$3,380/month (couple).
Asset Limits Not assessed.
NV

Covers up to $38.75/month premium; funded by tobacco settlement.

Benefits
Prescription drug premium assistance (~$465/year) Reducing out-of-pocket costs

Medicare Savings Program (MSP)

Nevada Medicare Savings Program

Age 65+ or disabled
General Nevada resident, Medicare Part A/B.
Income Limits (2025) ~$2,510/month (QMB), ~$3,380/month (SLMB), ~$3,598/month (QI)—individual.
Asset Limits $9,430 (individual), $14,130 (couple).
NV

Three tiers; no waitlist; includes Extra Help for Part D.

Benefits
Covers Part B premiums ($174.70/month) Deductibles ($240/year) Copays (~20%)

Nevada Caregiver Support Program (via NFCSP)

Nevada Caregiver Support Program

Age
General Caregivers of 60+ needing care or 55+ caregivers of others; Nevada resident; functional needs (2+ ADLs).
Income Limits (2025) Prioritizes ~$24,980/year (individual); no strict cap.
Asset Limits Not assessed; need-based.
NV

5 AAAs; prioritizes rural, low-income caregivers.

Benefits
Respite (4-6 hours/week or 5 days/year) Adult day care ($60/day) Training Supplies (~$500/year)

VA Aid and Attendance (A&A) and Housebound Benefits

Nevada VA Aid and Attendance/Housebound

Age 65+ or disabled veteran/spouse
General Nevada resident, wartime service, need for ADL help (A&A) or homebound.
Income Limits (2025) Net income < ~$1,984/month (veteran with dependent, A&A); pension offsets income.
Asset Limits ~$155,356 net worth limit
NV

High veteran demand in urban/rural areas.

Benefits
Cash (~$1,433-$2,642/month veteran, ~$951-$1,318 spouse) for care costs (e.g., in-home, assisted living)

Frequently Asked Questions about Welbrook Centennial Hills, Llc

What neighborhood is Welbrook Centennial Hills, Llc in?

Welbrook Centennial Hills, Llc is in the Centennial Hills neighborhood of Las Vegas.

Is Welbrook Centennial Hills, Llc in a walkable area?

Welbrook Centennial Hills, Llc has a walk score of 48. Somewhat walkable. A few nearby services may be reachable on foot, but most trips require transportation.

What is the occupancy rate at Welbrook Centennial Hills, Llc?

Welbrook Centennial Hills, Llc's occupancy is 58.7%.

Does Welbrook Centennial Hills, Llc operate as a for-profit or non-profit?

Welbrook Centennial Hills, Llc is registered as a for-profit in NV.

Are there photos of Welbrook Centennial Hills, Llc?

Yes — there are 7 photos of Welbrook Centennial Hills, Llc in the photo gallery on this page.

What is the address of Welbrook Centennial Hills, Llc?

Welbrook Centennial Hills, Llc is located at 6650 Grand Montecito Pkwy, Las Vegas, NV 89149.

What is the phone number of Welbrook Centennial Hills, Llc?

(702) 333-1290 will put you in contact with the team at Welbrook Centennial Hills, Llc.

Guides for Better Senior Living

Care Cost Calculator: See Prices in Your Area

Nursing Home Data Explorer

Don’t Wait Too Long: 7 Red Flag Signs Your Parent Needs Assisted Living Now

The True Cost of Assisted Living in 2025 – And How Families Are Paying For It

Understanding Senior Living Costs: Pricing Models, Discounts & Financial Assistance