WellBridge of Fenton

Nursing Home · Fenton, MI
CMS overall rating Info The Overall CMS Rating is scored from 1 to 5 stars and combines results from health inspections, staffing levels, and quality measures. Health inspections carry the most weight. Staffing and quality scores can increase or decrease the final rating based on performance compared to state and national standards.
WellBridge of Fenton

Nursing Home in Fenton

CMS overall rating Info The Overall CMS Rating is scored from 1 to 5 stars and combines results from health inspections, staffing levels, and quality measures. Health inspections carry the most weight. Staffing and quality scores can increase or decrease the final rating based on performance compared to state and national standards.
Calculator: See prices in your area
WellBridge of Fenton accepts Medicare, Medicaid, and private pay.

Overview of Wellbridge of Fenton

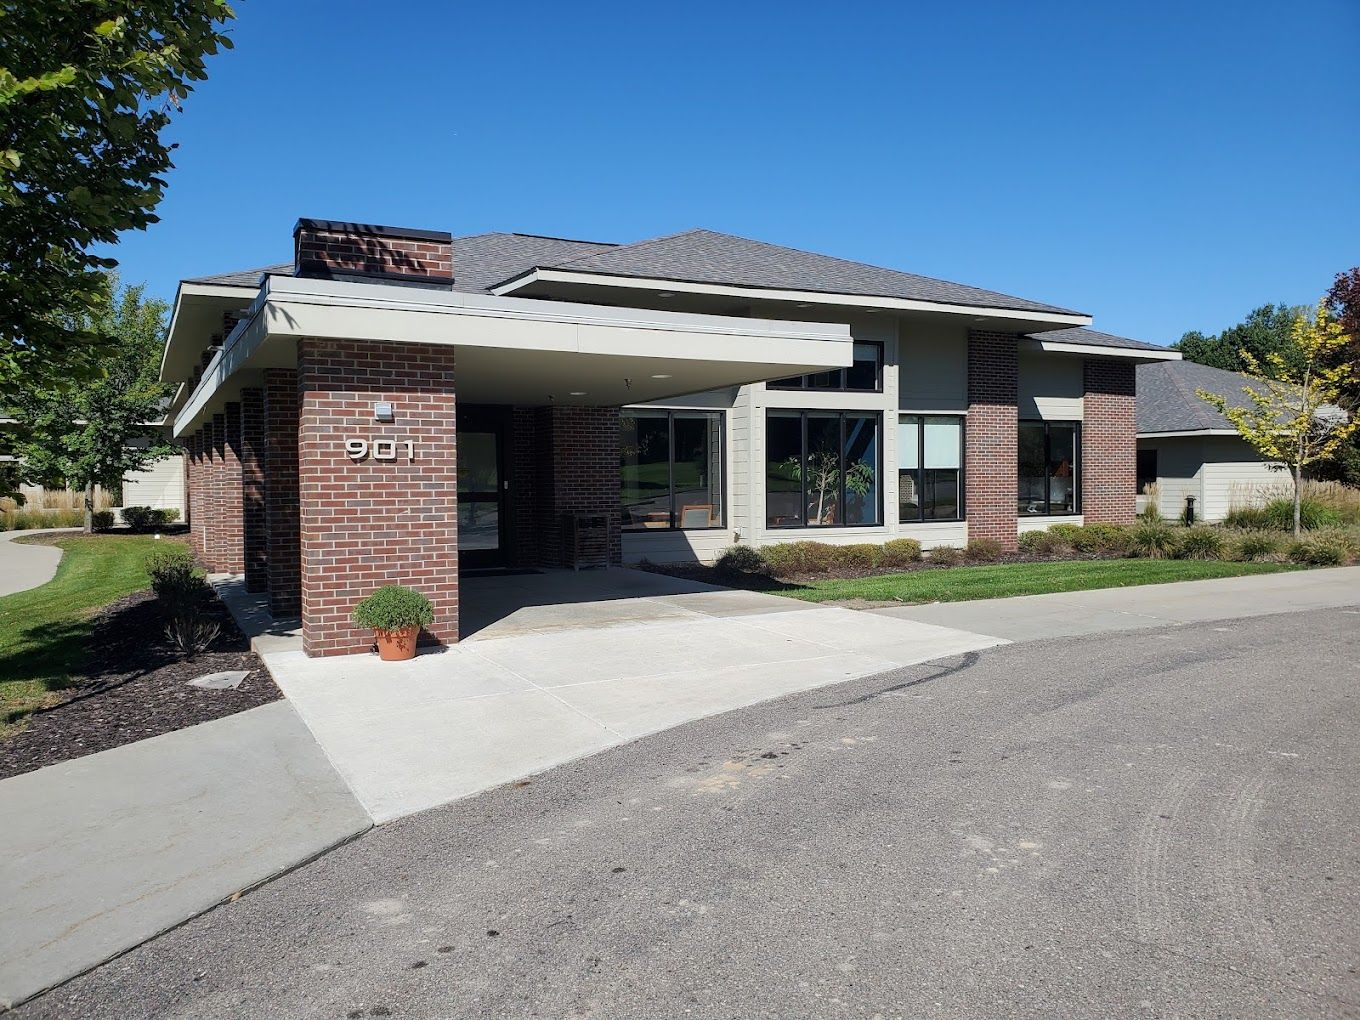
Experience authentic hospitality and excellent care services with Wellbridge of Fenton, a vibrant senior living community in Fenton, MI, offering compassionate skilled nursing and rehabilitation services. With 24-hour Registered Nursing coverage, residents are guaranteed to enjoy their peace of mind and be provided with excellent support that allows them to preserve their strength and overall functionality. Accommodations are designed to accommodate residents’ unique safety and lifestyle needs, allowing them to receive care conveniently.

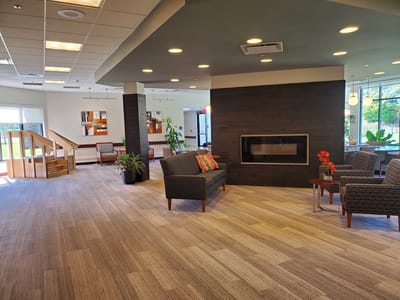
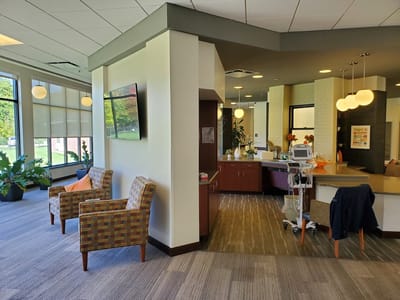
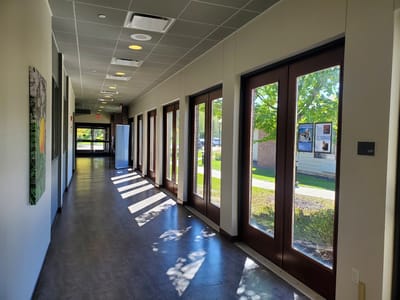
Apart from its multitude of excellent services, the community also offers a range of hotel-style amenities, such as a bistro, full-services salon, massage therapy, and a hydrotherapy whirlpool tub. Culinary delights are carefully prepared by a talented team of chefs using fresh, local ingredients, guaranteeing an exceptional dining experience. Vibrant and engaging social activities are also offered to keep residents motivated, engaged, and happy.

(810) 616-4100

Quality ratings

Measured by Centers for Medicare & Medicaid Services (CMS)

Overall rating Info The Overall CMS Rating combines results from health inspections, staffing levels and quality measures. Health inspections carry the most weight. Staffing and quality scores can increase or decrease the final rating based on performance compared to state and national standards.
▼ 36.3% Below MI avg.
Health Inspection Info Based on the results of the facility's three most recent standard inspections and any complaint investigations. CMS reviews the number, scope, and severity of deficiencies, with more recent findings weighted more heavily.
▼ 29.3% Below MI avg.
Staffing Info Measures average nursing staff hours per resident per day, including Registered Nurses (RNs) and total nursing staff. Ratings are adjusted based on the level of care residents require and are compared to state and national benchmarks.
▼ 14.2% Below MI avg.
Quality Measures Info Based on clinical and physical health indicators reported to CMS, such as hospital readmissions, falls, pressure ulcers, and improvements in mobility. These measures reflect how well residents' health needs are being managed.
▲ 6.4% Above MI avg.

Staffing hours breakdown

Info Daily nursing hours per resident by staff type, reported to CMS. Higher is generally better — compare this facility to state and national averages to see where staffing stands.

Hours per resident per day — compared to Michigan state averages

Total nursing care / resident Info This home is ranked 44th out of 94 homes in Michigan.

Total adjusted nursing hours per resident per day, combining RN, LPN, and aide time. CMS adjusts this for case-mix so facilities can be fairly compared.
3h 57m per day
Rank #44 / 94Nurse hours — state benchmarkedThis home is ranked 44th out of 94 homes in Michigan.Shows adjusted nurse hours per resident per day benchmarked to the Michigan average, with a ranking across 94 Michigan SNFs. More hours mean more direct care. The national average is about 3.5 hrs; below 3.0 is a red flag.
This facility Michigan avg (4h 18m per day)
vs Michigan avg
-8%

3 of 6 metrics below state avg

Standout metric LPN / LVN is +23% above state avg
Staff typeHours / dayvs state avg
Registered Nurse (RN) Info RNs hold the highest nursing license and can assess residents, interpret test results, and direct care plans. More RN hours per day often signals stronger clinical oversight and faster response to health changes. 35m per day ▼ 24% State avg: 46m per day · National avg: 41m per day
LPN / LVN Info Licensed Practical Nurses (LPNs) or Licensed Vocational Nurses (LVNs) deliver routine hands-on care — medication administration, wound dressing, and monitoring vital signs. They work under RN supervision and make up a large share of daily bedside care. 1h 5m per day ▲ 23% State avg: 53m per day · National avg: 52m per day
Nurse Aide Info Certified Nurse Aides (CNAs) provide the most direct day-to-day assistance: bathing, dressing, feeding, and mobility. Nurse aide hours are typically the largest staffing category and directly affect residents' quality of life. 2h 20m per day ■ Avg State avg: 2h 23m per day · National avg: 2h 21m per day
Total Nursing (Weekend) Info Combined nursing hours (RN + LPN + Nurse Aide) per resident per day on weekends. Staffing often drops on weekends — this figure reveals whether the facility maintains adequate coverage outside of weekday hours. 3h 28m per day ■ Avg State avg: 3h 31m per day · National avg: 3h 26m per day
Physical Therapist Info Hours per resident per day provided by licensed Physical Therapists (PTs) or PT Assistants. PT services help residents recover mobility after injury or illness and are especially important for post-acute (short-stay) rehabilitation. 3m per day ▼ 25% State avg: 4m per day · National avg: 4m per day
RN (Weekend) Info Registered nurse hours specifically on weekends. Facilities sometimes reduce RN presence on Saturdays and Sundays — a low weekend RN figure compared to weekday hours can indicate reduced clinical oversight when most administrative staff are absent. 20m per day ▼ 31% State avg: 29m per day · National avg: 29m per day

Capacity and availability

This home usually has availability

Occupancy lower than 85% suggests more openings may be available.

Lower occupancy than the Michigan average: 75.8%
Occupancy rate 68.2% Rank #55 / 96Occupancy rate — state benchmarkedThis home is ranked 55th out of 96 homes in Michigan.Shows this facility's occupancy rate versus the Michigan average, with its statewide rank out of 96. Higher occupancy signals strong local demand and financial stability.
Avg. Length of Stay 54 days
Occupancy rate
68.2% Rank #55 / 96Occupancy rate — state benchmarkedThis home is ranked 55th out of 96 homes in Michigan.Shows this facility's occupancy rate versus the Michigan average, with its statewide rank out of 96. Higher occupancy signals strong local demand and financial stability.
Avg. Length of Stay
54 days

Who this home usually serves

TYPE OF STAY

Mix of rehab and long-term care

This home supports both short-term rehab and long-term care, with residents staying for a wide range of durations.

Breakdown by payment type

Medicare

36% of new residents, usually for short-term rehab.

Typical stay 17 days

Private pay

55% of new residents, often for short stays.

Typical stay 1 - 2 months

Medicaid

9% of new residents, often for long-term daily care.

Typical stay 1 years

Finances and operations

Privately-owned community
Operated by a business corporation.
Home revenue
$17.7M
Operating loss
-$287.3K
Privately-owned community Operated by a business corporation.
Home revenue
$17.7M Rank #34 / 95Revenue — state benchmarkedThis home is ranked 34th out of 95 homes in Michigan.Shows this facility's annual revenue compared to the Michigan SNF average. Higher revenue generally means more resources for staffing and capital — read alongside Payroll %.
Operating loss
-$287.3K
Payroll costs Info The portion of the home's budget spent on staff, including nurses, caregivers, and other employees who support care and operations. Rank #67 / 95Payroll — state benchmarkedThis home is ranked 67th out of 95 homes in Michigan.Shows total annual staff payroll benchmarked to the Michigan average. Higher payroll investment relative to peers often signals better staffing and less reliance on cheaper contract labor.
$5.9M
33% of revenue Rank #86 / 95Payroll % — state benchmarkedThis home is ranked 86th out of 95 homes in Michigan.Shows payroll as a percentage of revenue versus the Michigan average. Well-run SNFs often land around 55–65%. Below 25% may signal understaffing or heavy agency use — read with Staffing ratings.
Other operating costs Info All remaining costs needed to run the home, such as food, utilities, building maintenance, supplies and administrative expenses.
$12.2M
Total costs $18.0M
Walk Score
Walk Score: 6 / 100 Rank #67 / 70Walk Score — state benchmarkedThis home is ranked 67th out of 70 homes in Michigan.Shows how walkable this facility's neighborhood is compared to the average Walk Score across Michigan SNFs. Higher scores benefit residents, families, and staff.
Car-dependent. Most errands require a car, with limited nearby walkable options.

What does this home offer?

Total residents icon

Total Residents: 100 Residents

Housing options icon

Housing Options: Private Suites

Building type icon
Building type icon

Building Type: Single-story

Types of Care at WellBridge of Fenton

Nursing Home

Contact WellBridge of Fenton

Health Inspection History

Inspections
Total health inspections 7

Michigan average 6.5


Last Health inspection on Dec 2024

Total health citations
49 Rank #80 / 96Health citations — state benchmarkedThis home is ranked 80th out of 96 homes in Michigan.Shows this facility's total health deficiency citations benchmarked to the Michigan state average, with a ranking across all 96 MI SNFs. Lower citation counts earn a better rank.

Michigan average 33.5

Citations per inspection
7 Rank #76 / 96Citations per inspection — state benchmarkedThis home is ranked 76th out of 96 homes in Michigan.Shows average deficiency citations per CMS inspection for this facility versus the Michigan mean across 96 SNFs with citation data. Lower is better.

Michigan average 5.18


Health citations are formal notices following inspections when they fail to comply with safety and care standards.

33 of 49 citations resulted from standard inspections; 13 of 49 resulted from complaint investigations; and 3 of 49 came from combined inspections (standard and complaint).

Breakdown of citation severity (last 4 years)
Critical Health citations More info
0
100% better than Michigan average

Michigan average: 0.3


Serious Health citations More info 2
5% worse than Michigan average

Michigan average: 1.9

0 critical citations More info Michigan average: 0.3

2 serious citations More info Michigan average: 1.9

47 moderate citations More info Michigan average: 30.8

0 minor citations More info Michigan average: 0.5
Citations history (last 4 years)
Infection Control moderate citation Info Issues related to preventing and controlling infections, including hygiene practices and safety protocols. Dec 11, 2024
Corrected

Nutrition moderate citation Info Issues related to food quality, meal service, and resident's nutritional needs. Dec 11, 2024
Corrected

Pharmacy moderate citation Info Issues related to medication management, including how drugs are stored, administered, and monitored. Dec 11, 2024
Corrected

Pharmacy moderate citation Info Issues related to medication management, including how drugs are stored, administered, and monitored. Dec 11, 2024
Corrected

Financial Assistance for
Nursing Home in Michigan

WellBridge of Fenton is located in Fenton, Michigan.
Here are the financial assistance programs available to residents in Michigan.

Get Financial aid guidance

MI Choice Waiver

Michigan Medicaid MI Choice Waiver

Age 65+ or disabled
General Michigan resident, Medicaid- eligible, nursing home-level care need.
Income Limits (2025) ~$2,829/month 300% FBR, individual
Asset Limits $2,000 (individual), $3,000 (couple).
MI

Delivered through regional waiver agents; waitlists possible.

Benefits
Personal care (5-7 hours/day) Respite care (240 hours/year) Home modifications ($1,500 avg.) Adult day care ($65/day)

Home Help Program

Michigan Home Help

Age 65+ or disabled
General Michigan resident, Medicaid- eligible or low-income.
Income Limits ~$1,732/month individual, Medicaid threshold
Asset Limits $2,000 individual
MI

Can hire family caregivers; less intensive than waiver.

Benefits
Personal care (up to 60 hours/month) Homemaker services Respite (varies)

Program of All-Inclusive Care for the Elderly (PACE)

Michigan PACE

Age 55+
General Michigan resident, nursing home-level care need, safe with PACE support.
Income Limits (2025) ~$2,829/month (Medicaid-eligible); private pay option available.
Asset Limits $2,000 (individual), $3,000 (couple).
MI

16 PACE centers (e.g., Ingham, Wayne counties); expanding slowly.

Benefits
Personal care (5-7 hours/day) Medical care Meals Transportation Therapy Respite

Medicare Savings Program (MSP)

Michigan Medicare Savings Program

Age 65+ or disabled
General Michigan resident, Medicare Part A/B.
Income Limits (2025) ~$2,510/month (QMB), ~$3,380/month (SLMB), ~$3,598/month (QI)—individual.
Asset Limits $9,430 (individual), $14,130 (couple).
MI

Three tiers; no waitlist; includes Extra Help for Part D.

Benefits
Covers Part B premiums ($174.70/month) Deductibles ($240/year) Copays (~20%)

National Family Caregiver Support Program (NFCSP) Respite

Michigan NFCSP Respite Care

Age
General Caregivers of 60+ needing care or 55+ caregivers of others; Michigan resident; functional needs (2+ ADLs).
Income Limits (2025) Prioritizes ~$24,980/year (individual); no strict cap.
Asset Limits Not assessed; need-based.
MI

16 AAAs; prioritizes low-income, rural caregivers.

Benefits
Respite (4-6 hours/week or 5 days/year) Adult day care ($60/day) Caregiver training

Senior Community Service Employment Program (SCSEP)

Michigan SCSEP

Age 55+
General unemployed, low-income, Michigan resident.
Income Limits (2025) ~$1,983/month 125% FPL
Asset Limits Not specified; income-focused.
MI

Priority for veterans, rural residents; Operation ABLE partnership.

Benefits
Paid training (~20 hours/week at ~$7.25/hour) Job placement

VA Aid and Attendance (A&A) and Housebound Benefits

Michigan VA Aid and Attendance/Housebound

Age 65+ or disabled veteran/spouse
General Michigan resident, wartime service, need for ADL help (A&A) or homebound.
Income Limits (2025) Net income < ~$1,984/month (veteran with dependent, A&A); pension offsets income.
Asset Limits ~$155,356 net worth limit
MI

High veteran demand in urban/rural areas.

Benefits
Cash (~$1,433-$2,642/month veteran, ~$951-$1,318 spouse) for care costs

Places of interest near WellBridge of Fenton

Address 1.2 miles from city center Info Estimated distance in miles from Fenton's city center to WellBridge of Fenton's address, calculated via Google Maps.

Calculate Travel Distance to WellBridge of Fenton

Add your location

Address

Staffing Data (Q2 2025)

This data corresponds to Q2 2025 and is based on CMS Payroll-Based Journal.

Total staff 164
Employees 141
Contractors 23
Staff to resident ratio 2.05:1
17% better than Michigan average

Michigan average ratio: 1.75:1

Avg staff/day 60
Average shift 7.6 hours
0% compared with Michigan average

Michigan average: 7.9 hours

Total staff hours (quarter) 41,741
Nursing staff breakdown
Registered Nurse

Manages medical care and health needs.

Total count 18
Average shift length Info Average shift length. Calculated as total hours divided by days worked and average staff per day. 9.2 hours

No contractors work on this role.

Licensed Practical Nurse

Assists with medical care and medications.

Total count 26
Average shift length Info Average shift length. Calculated as total hours divided by days worked and average staff per day. 8.7 hours

No contractors work on this role.

Certified Nursing Assistant

Helps with daily care and mobility.

Total count 83
Average shift length Info Average shift length. Calculated as total hours divided by days worked and average staff per day. 7.1 hours

No contractors work on this role.

Contractor staffing

Total hours from contractors

8.9%

3,704 contractor hours this quarter

Speech Language Pathologist: 7 Physical Therapy Aide: 7 Qualified Social Worker: 3 Respiratory Therapy Technician: 3 Physical Therapy Assistant: 2 Medical Director: 1
Staff by category
Certified Nursing Assistant8308320,16491100%7.1
Licensed Practical Nurse260267,67191100%8.7
Registered Nurse180184,98591100%9.2
Other Dietary Services Staff6061,56091100%7.7
Physical Therapy Aide0771,2416976%7.2
Speech Language Pathologist0771,0477279%6.5
Occupational Therapy Aide2029926470%8
Dietitian1015126470%8
Physical Therapy Assistant0225067077%7.2
Nurse Practitioner1014886167%8
Mental Health Service Worker1014725965%8
Clinical Nurse Specialist1014645864%8
Administrator1014435864%7.6
Qualified Social Worker0333995257%7.2
Respiratory Therapy Technician0333946167%6.3
Dental Services Staff1012863842%7.5
Medical Director0111173943%3
83 Certified Nursing Assistant
% of Days 100%
26 Licensed Practical Nurse
% of Days 100%
18 Registered Nurse
% of Days 100%
6 Other Dietary Services Staff
% of Days 100%
7 Physical Therapy Aide
% of Days 76%
7 Speech Language Pathologist
% of Days 79%
2 Occupational Therapy Aide
% of Days 70%
1 Dietitian
% of Days 70%
2 Physical Therapy Assistant
% of Days 77%
1 Nurse Practitioner
% of Days 67%
1 Mental Health Service Worker
% of Days 65%
1 Clinical Nurse Specialist
% of Days 64%
1 Administrator
% of Days 64%
3 Qualified Social Worker
% of Days 57%
3 Respiratory Therapy Technician
% of Days 67%
1 Dental Services Staff
% of Days 42%
1 Medical Director
% of Days 43%

Facility Characteristics

Source: CMS Long-Term Care Facility Characteristics (Data as of Jan 2026)

Total residents 80
Medicare
6
7.5% of residents
Medicaid
49
61.3% of residents
Private pay or other
25
31.3% of residents

Quality of care over time

These measures show how residents usually do over time at this home, based on health outcomes and preventive care.

High-risk clinical events score Info A composite score based on pressure ulcers, falls with injury, weight loss, walking ability decline, and activities of daily living decline. 6.1
27% better than Michigan average

Michigan average: 8.4

Functional decline score Info A composite score based on activities of daily living decline, walking ability decline, and incontinence. 8.7
47% better than Michigan average

Michigan average: 16.3

Long-stay resident measures
Above average Michigan avg: 4.1 Info CMS star rating based on long-stay quality measure performance. 5 stars = significantly above average, 1 star = significantly below average.
Need for Help with Daily Activities Increased Info Percent of long-stay residents whose need for help with daily activities has increased 10.8%
13% better than Michigan average

Michigan average: 12.5%

Walking Ability Worsened Info Percent of long-stay residents whose ability to move independently worsened 7.6%
51% better than Michigan average

Michigan average: 15.3%

Low Risk Residents with Bowel/Bladder Incontinence Info Percent of low risk long-stay residents who lose control of their bowels or bladder 7.6%
64% better than Michigan average

Michigan average: 21.0%

Falls with Major Injury Info Percent of long-stay residents experiencing one or more falls with major injury 5.7%
80% worse than Michigan average

Michigan average: 3.2%

High Risk Residents with Pressure Ulcers Info Percent of long-stay high risk residents with pressure ulcers 2.2%
61% better than Michigan average

Michigan average: 5.7%

Urinary Tract Infection Info Percent of long-stay residents with a urinary tract infection 3.4%
102% worse than Michigan average

Michigan average: 1.7%

Lost Too Much Weight Info Percent of long-stay residents who lose too much weight 4.4%
22% better than Michigan average

Michigan average: 5.7%

Depressive Symptoms Info Percent of long-stay residents who have depressive symptoms 4.6%
20% worse than Michigan average

Michigan average: 3.9%

Antipsychotic Use Info Percent of long-stay residents who received an antipsychotic medication 14.4%
In line with Michigan average

Michigan average: 15.0%

Pneumococcal Vaccine Info Percent of long-stay residents assessed and appropriately given the pneumococcal vaccine 98.9%
In line with Michigan average

Michigan average: 94.9%

Influenza Vaccine Info Percent of long-stay residents assessed and appropriately given the seasonal influenza vaccine 98.6%
In line with Michigan average

Michigan average: 95.0%

Hospitalizations per 1,000 days Info Number of hospitalizations per 1,000 long-stay resident days. 2.13
22% worse than Michigan average

Michigan average: 1.74

ED visits per 1,000 days Info Number of outpatient emergency department visits per 1,000 long-stay resident days. 1.53
In line with Michigan average

Michigan average: 1.54

Short-stay resident measures
Above average Michigan avg: 3.3 Info CMS star rating based on short-stay quality measure performance. 5 stars = much above average, 1 star = much below average.
Pneumococcal Vaccine Info Percent of short-stay residents assessed and appropriately given the pneumococcal vaccine 98.7%
20% better than Michigan average

Michigan average: 82.5%

Antipsychotic medication increase Info Percent of short-stay residents who newly received an antipsychotic medication 0.5%
66% better than Michigan average

Michigan average: 1.4%

Influenza Vaccine Info Percent of short-stay residents assessed and appropriately given the seasonal influenza vaccine 98.3%
24% better than Michigan average

Michigan average: 79.5%

Re-hospitalized after SNF stay Info Percentage of short-stay residents who were re-hospitalized after their nursing home admission. 30.4%
26% worse than Michigan average

Michigan average: 24.2%

Emergency department visits Info Percentage of short-stay residents who had an outpatient emergency department visit. 10.1%
12% better than Michigan average

Michigan average: 11.5%

Falls with major injury Info Percentage of SNF residents who experience falls with major injury during their stay. 0.7%
12% better than Michigan average

Michigan average: 0.8%

Ability to care for self at discharge Info Percentage of residents at or above expected ability to care for themselves at discharge. 57.1%
6% better than Michigan average

Michigan average: 53.7%

Successful return to home or community Info Rate of successful return to home or community from a skilled nursing facility. 60.1%
19% better than Michigan average

Michigan average: 50.6%

Penalties and fines

Federal penalties imposed by CMS for regulatory violations, including civil money penalties (fines) and denials of payment for new Medicare/Medicaid admissions.

Source: CMS Penalties Database (Data as of Jan 2026)

Total fines amount $49K
36% lower than Michigan average

Michigan average: $76K

Number of fines 1
51% fewer fines than Michigan average

Michigan average: 2.0

Payment Denials Info Serious action where Medicare and/or Medicaid temporarily stops payments for new residents until issues are fixed. 0
100% fewer payment denials than Michigan average

Michigan average: 0.8

Fines amount comparison
This facility $49K
Michigan average $76K
Penalty History

Penalties are imposed by CMS for violations of federal nursing home regulations.

1 penalty in the past 3 years

Jun 9, 2023 · $49K

Civil Money Penalty Info Fines imposed for noncompliance, which can be assessed per day or per instance of violation. Jun 9, 2023
$49K

Last updated: Jan 2026

Guides for Better Senior Living

Care Cost Calculator: See Prices in Your Area

Nursing Home Data Explorer

Don’t Wait Too Long: 7 Red Flag Signs Your Parent Needs Assisted Living Now

The True Cost of Assisted Living in 2025 – And How Families Are Paying For It

Understanding Senior Living Costs: Pricing Models, Discounts & Financial Assistance

Frequently Asked Questions about WellBridge of Fenton

Is WellBridge of Fenton in a walkable area?

WellBridge of Fenton has a walk score of 6. Car-dependent. Most errands require a car, with limited nearby walkable options.

What is the address of WellBridge of Fenton?

WellBridge of Fenton is located at 901 Pinecreek Dr, Fenton, MI 48430, United States.

What is the phone number of WellBridge of Fenton?

(810) 616-4100 will put you in contact with the team at WellBridge of Fenton.

Is WellBridge of Fenton Medicare or Medicaid certified?

Yes — WellBridge of Fenton is a CMS-certified provider of Medicare and Medicaid.

Explore Open Rooms
1 Contact details
2 What type of senior care service are you looking for?
3 What budget do you have in mind for senior care?
4 How soon do you need to find care?
5 Additional details

Thank you for your interest!

Our team will be in touch shortly to help with next steps.