Total health inspections
8
Illinois average 10.4
Last Health inspection on Sep 2025

We arrange tours, appointments, and even moving support so you don’t have to
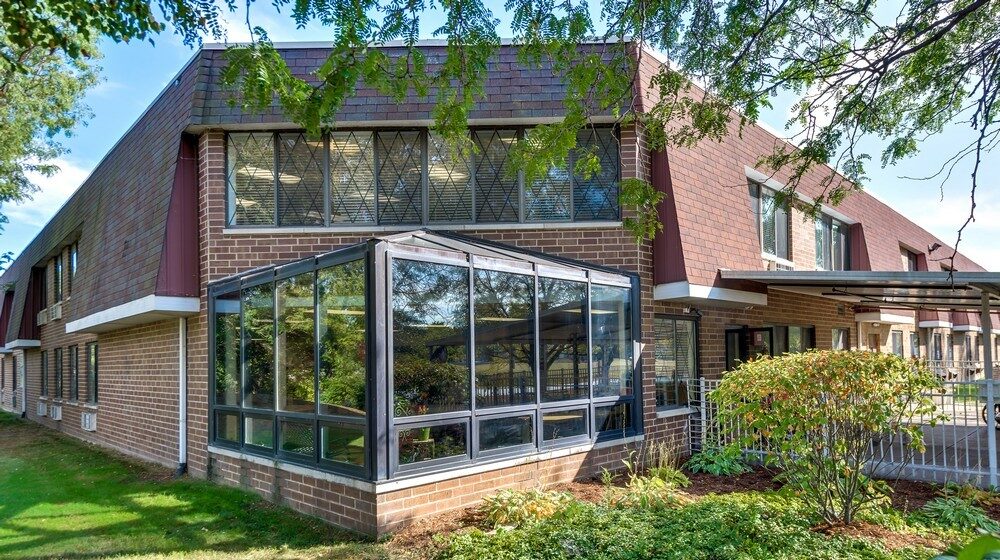
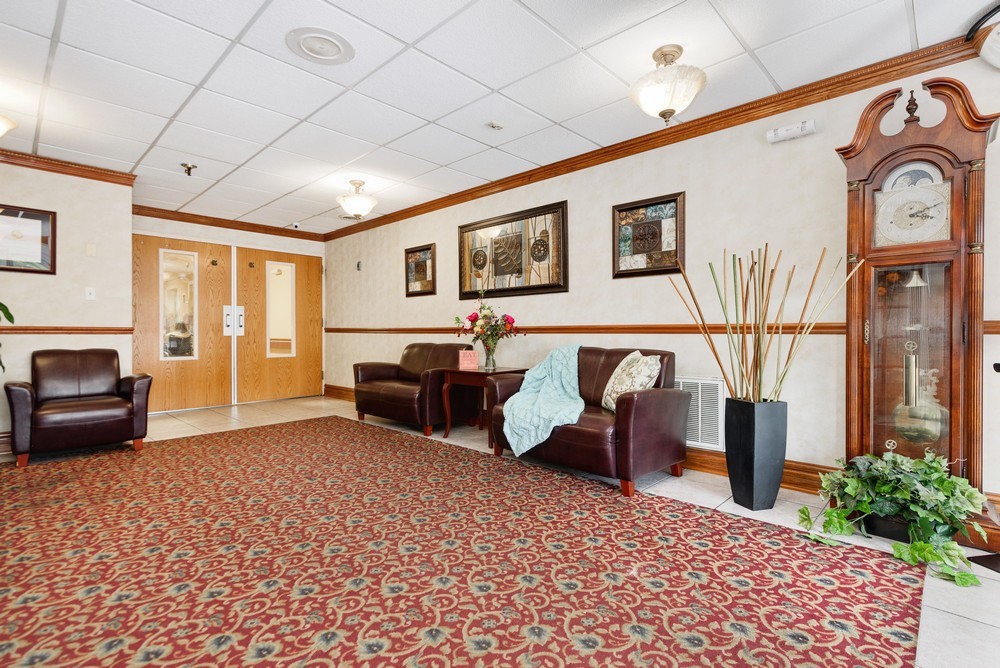
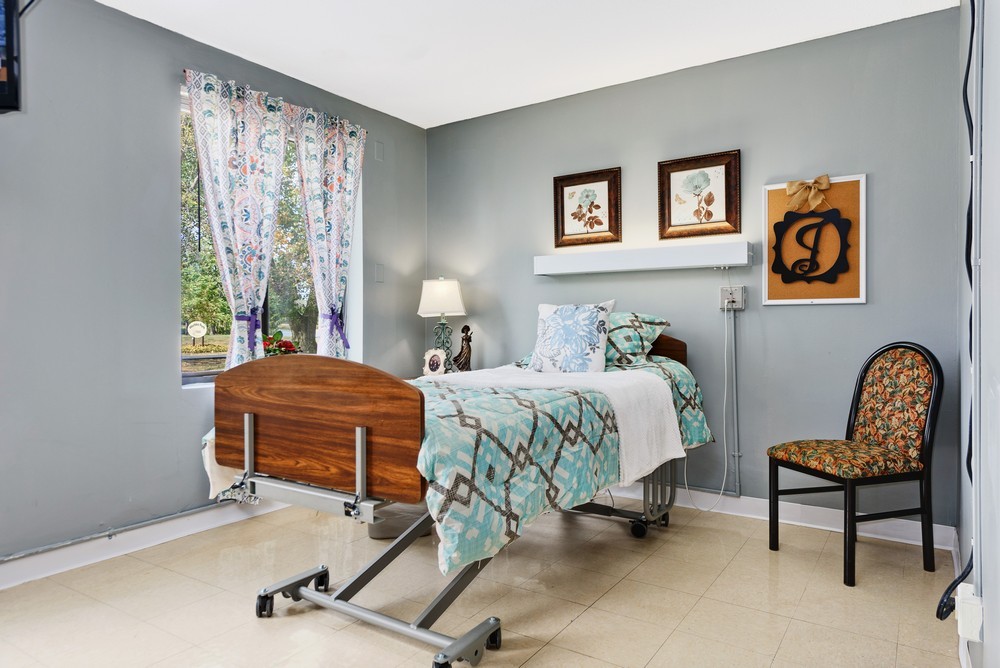
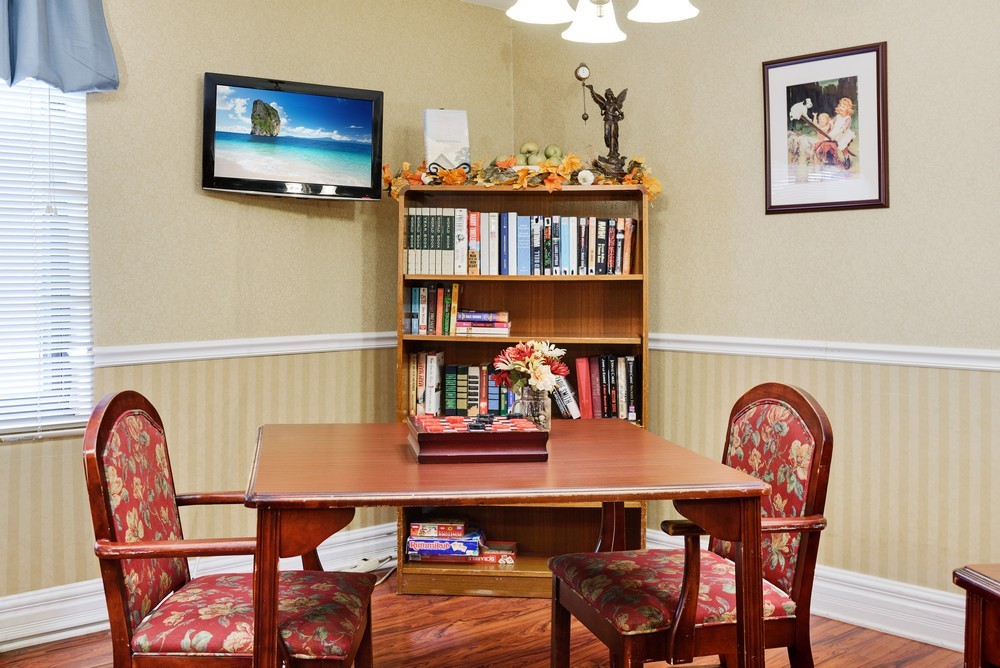
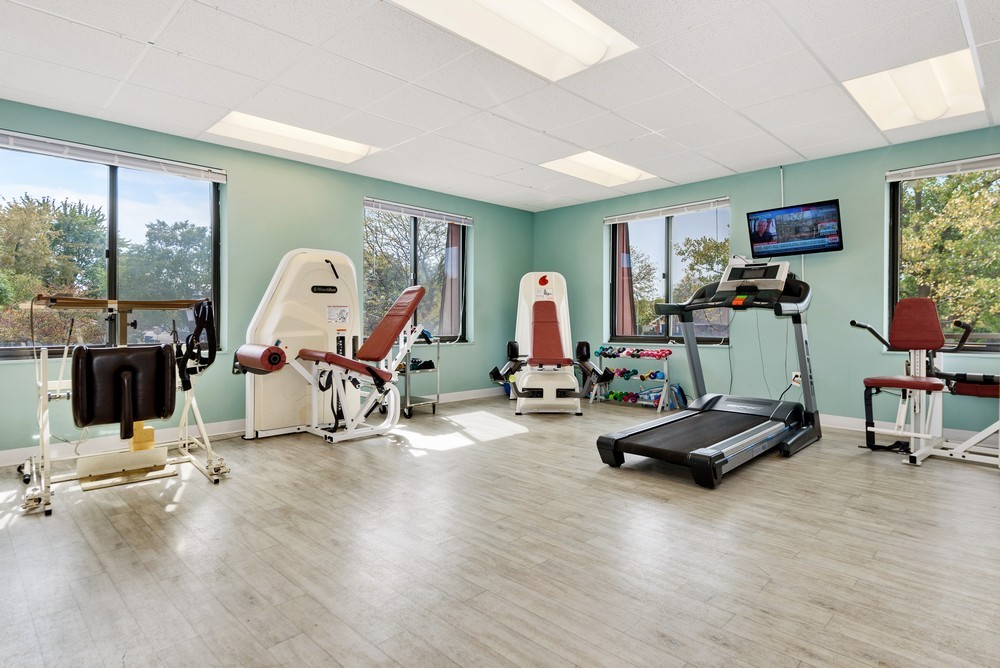
Maintain a high quality of life with West Suburban Nursing and Rehabilitation Center, a thriving community in Bloomingdale, IL, offering excellent skilled nursing care and rehabilitation services. Their professional nurses and team members are available 24 hours a day, 7 days a week to support residents with their daily living needs and emergencies. Those recovering from an injury or hospitalization are given access to physical, speech, and occupational services to ensure they can get back on their feet quickly.
They also feature their safe and secure Memory Springs unit to make sure residents living with the challenges of memory loss can enjoy a comfortable and fulfilling lifestyle despite their conditions. To accommodate residents’ unique nutritional needs, the community also offers various nutritional services to ensure they maintain a healthy lifestyle. At West Suburban Nursing and Rehabilitation Center, they provide everything residents need to maintain their well-being and live their best lives.
 Official CMS rating based on health inspections, staffing and quality measures.
Official CMS rating based on deficiencies found during state health inspections.
Official CMS rating based on nurse staffing hours per resident per day.
Official CMS rating based on clinical outcomes for residents.
Average daily nursing hours per resident (adjusted for acuity). Higher values indicate more nursing time per resident.
Hours of care per resident per day, broken down by staff type. Data from CMS Medicare.
Registered nurse hours per resident per day.
Nurse aide hours per resident per day.
Total number of nurse staff hours per resident per day on weekends.
Physical therapist staff hours per resident per day.
Registered nurse hours per resident per day on weekends.
Official CMS rating based on health inspections, staffing and quality measures.
Official CMS rating based on deficiencies found during state health inspections.
Official CMS rating based on nurse staffing hours per resident per day.
Official CMS rating based on clinical outcomes for residents.
Average daily nursing hours per resident (adjusted for acuity). Higher values indicate more nursing time per resident.
Hours of care per resident per day, broken down by staff type. Data from CMS Medicare.
Registered nurse hours per resident per day.
Nurse aide hours per resident per day.
Total number of nurse staff hours per resident per day on weekends.
Physical therapist staff hours per resident per day.
Registered nurse hours per resident per day on weekends.
May provide extensive amenities, services and programs.
Lower occupancy suggests more openings may be available.
Most residents stay for extended periods and receive ongoing daily care.
23% of new residents, usually for short-term rehab.
19% of new residents, often for short stays.
58% of new residents, often for long-term daily care.
The portion of the home's budget spent on staff, including nurses, caregivers, and other employees who support care and operations.
All remaining costs needed to run the home, such as food, utilities, building maintenance, supplies and administrative expenses.
Accept Medicaid: Yes
Housing Options: Private Rooms
Building Type: Single-story

Health Programs
Illinois average 10.4
Last Health inspection on Sep 2025
Health citations are formal notices following inspections when they fail to comply with safety and care standards.
22 of 35 citations resulted from standard inspections; and 13 of 35 resulted from complaint investigations.
Illinois average: 0.7
Illinois average: 3.6
Data sourced from CMS Health Deficiencies reports. Citation severity codes range from A (least serious) to L (most serious). Immediate Jeopardy (J-L) citations indicate situations where the facility's noncompliance has placed residents at risk of death or serious harm.
Nursing Homes 24/7 care needed
Nursing Homes 24/7 care needed
Nursing Homes 24/7 care needed
Nursing Homes 24/7 care needed
Memory Care Specialized care for those with Memory Loss, Alzheimer's, or dementia, ensuring safety and support.
Nursing Homes 24/7 care needed
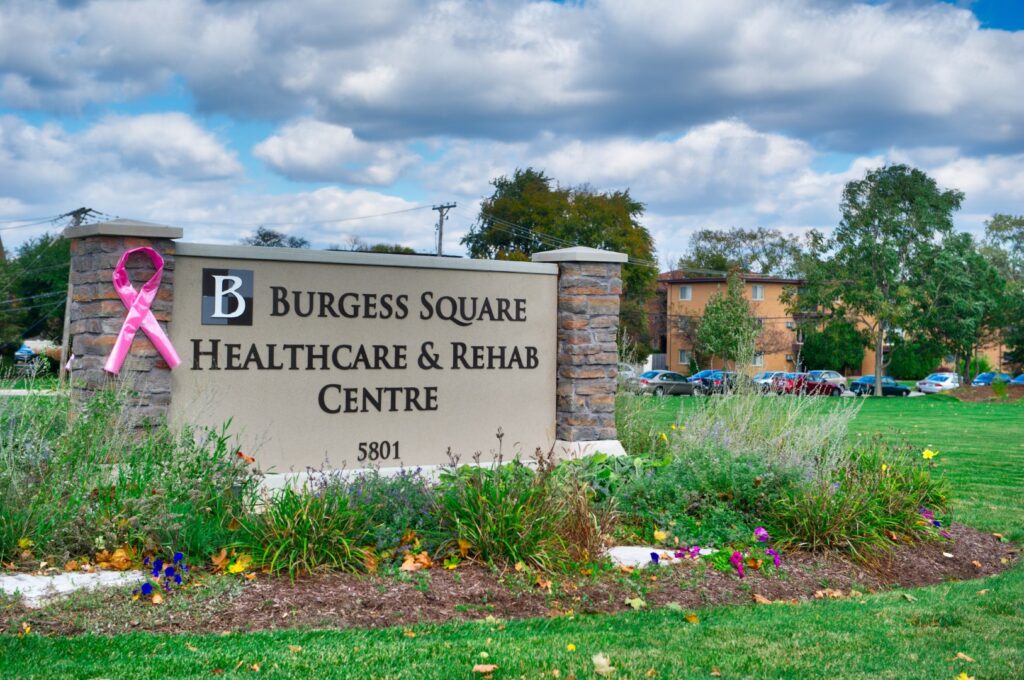 Burgess Square Healthcare & Rehab Centre
  Abbington Rehab & Nursing Center
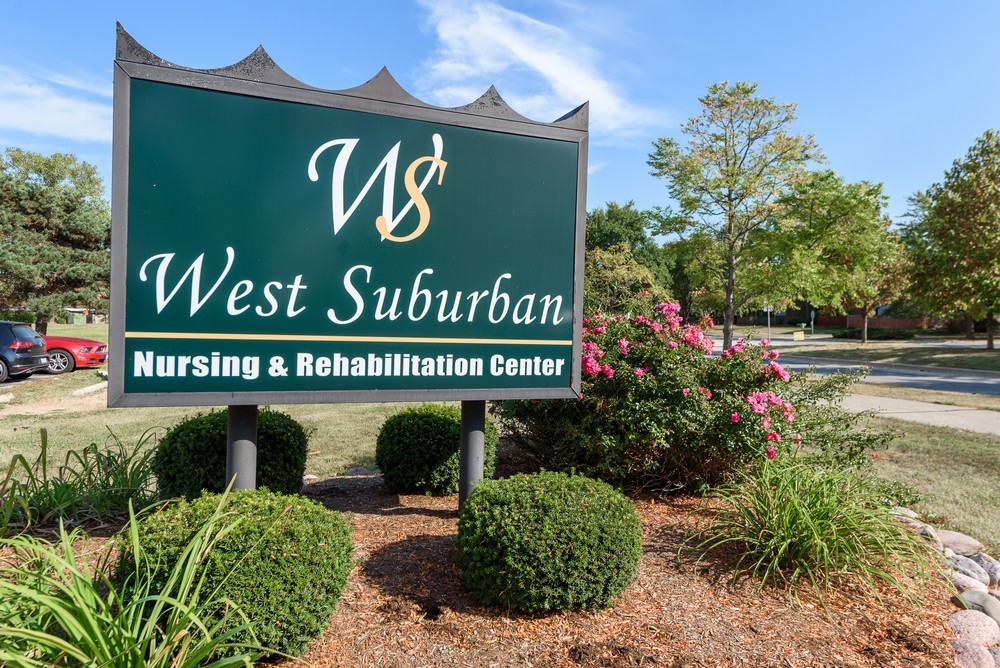
West Suburban Nursing and Rehabilitation Center
Abbington Rehab & Nursing Center
West Suburban Nursing and Rehabilitation Center 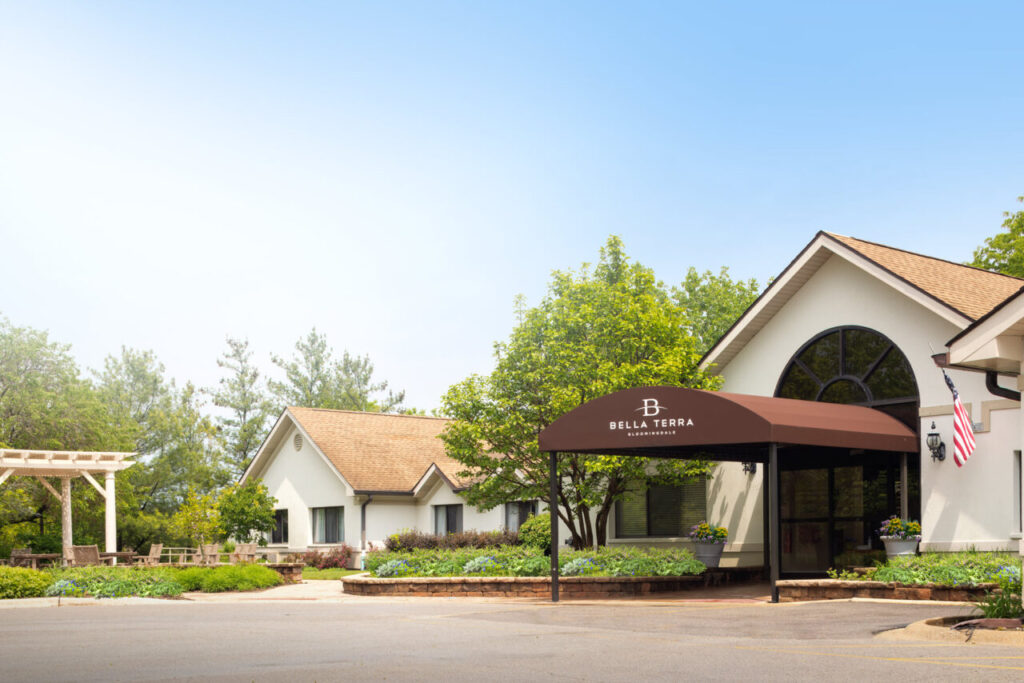 Bella Terra Bloomingdale
![]() 3.5 miles from city center
3.5 miles from city center
![]() 311 Edgewater Dr, Bloomingdale, IL 60108
311 Edgewater Dr, Bloomingdale, IL 60108
Add your location
Source: CMS Payroll-Based Journal (Q2 2025)
| Role ⓘ | Count ⓘ | Avg Shift (hrs) ⓘ | Uses Contractors? ⓘ |
|---|---|---|---|
| Registered Nurse | 35 | 8.4 | Yes |
| Licensed Practical Nurse | 28 | 8.1 | No |
| Certified Nursing Assistant | 64 | 8.2 | No |
| Role ⓘ | Employees ⓘ | Contractors ⓘ | Total Staff ⓘ | Total Hours ⓘ | Days Worked ⓘ | % of Days ⓘ | Avg Shift (hrs) ⓘ |
|---|---|---|---|---|---|---|---|
| Certified Nursing Assistant | 64 | 0 | 64 | 26,387 | 91 | 100% | 8.2 |
| Licensed Practical Nurse | 28 | 0 | 28 | 12,647 | 91 | 100% | 8.1 |
| Registered Nurse | 23 | 12 | 35 | 8,118 | 91 | 100% | 8.4 |
| Other Dietary Services Staff | 8 | 0 | 8 | 2,669 | 91 | 100% | 7.2 |
| Medication Aide/Technician | 0 | 6 | 6 | 1,130 | 40 | 44% | 14.3 |
| Clinical Nurse Specialist | 3 | 0 | 3 | 1,091 | 77 | 85% | 7.4 |
| Speech Language Pathologist | 0 | 2 | 2 | 947 | 65 | 71% | 7.3 |
| Mental Health Service Worker | 2 | 0 | 2 | 945 | 71 | 78% | 7.7 |
| RN Director of Nursing | 2 | 0 | 2 | 745 | 72 | 79% | 8.8 |
| Dietitian | 1 | 0 | 1 | 570 | 63 | 69% | 9 |
| Physical Therapy Aide | 0 | 4 | 4 | 506 | 66 | 73% | 6.4 |
| Administrator | 1 | 0 | 1 | 489 | 62 | 68% | 7.9 |
| Respiratory Therapy Technician | 0 | 2 | 2 | 476 | 66 | 73% | 7.2 |
| Nurse Practitioner | 1 | 0 | 1 | 457 | 57 | 63% | 8 |
| Physical Therapy Assistant | 0 | 4 | 4 | 431 | 63 | 69% | 6.6 |
| Occupational Therapy Aide | 2 | 0 | 2 | 240 | 41 | 45% | 5.2 |
| Qualified Social Worker | 0 | 5 | 5 | 212 | 43 | 47% | 4.8 |
| Occupational Therapy Assistant | 0 | 1 | 1 | 85 | 13 | 14% | 6.5 |
| Medical Director | 0 | 1 | 1 | 39 | 13 | 14% | 3 |
Source: CMS Long-Term Care Facility Characteristics (Data as of Jan 2026)
Residents meet regularly to discuss policies, care quality, and activities
Organized group of residents that meets regularly to discuss facility policies, quality of life, and activities.
Data sourced from CMS Long-Term Care Facility Characteristics quarterly report. Payer mix reflects the current resident census by primary payment source.
These measures show how residents usually do over time at this home, based on health outcomes and preventive care.
Illinois average: 9.7
Illinois average: 18.6
Illinois average: 15.5%
Illinois average: 18.4%
Illinois average: 21.6%
Illinois average: 3.4%
Illinois average: 5.3%
Illinois average: 1.8%
Illinois average: 6.5%
Illinois average: 48.1%
Illinois average: 20.2%
Illinois average: 89.2%
Illinois average: 91.6%
Illinois average: 2.05
Illinois average: 2.25
Illinois average: 68.3%
Illinois average: 2.3%
Illinois average: 63.0%
Illinois average: 26.2%
Illinois average: 14.0%
Illinois average: 0.8%
Illinois average: 53.7%
Illinois average: 50.6%
Quality measures are calculated from Minimum Data Set (MDS) assessments. For most measures, lower percentages indicate better care quality.
Historical financial and operational data for West Suburban Nursing and Rehabilitation Center based on CMS SNF Cost Reports.
Loading trend charts...
Care Cost Calculator: See Prices in Your Area
Nursing Home Data Explorer
Don’t Wait Too Long: 7 Red Flag Signs Your Parent Needs Assisted Living Now
The True Cost of Assisted Living in 2025 – And How Families Are Paying For It
Understanding Senior Living Costs: Pricing Models, Discounts & Financial Assistance

Touring a community? Use this expert-backed checklist to stay organized, ask the right questions, and find the perfect fit.
We'll send you a PDF version of the touring checklist.