Westgate Gardens Care Center
Nursing Home, Hospice Care & Nursing Care · Visalia, CA
CMS overall rating Info CMS (the Centers for Medicare & Medicaid Services) is the federal agency that rates nursing home quality. Its Overall Rating runs from 1 to 5 stars, combining health inspections, staffing, and quality measures, with inspections weighted most heavily.

Westgate Gardens Care Center

Nursing Home, Hospice Care & Nursing Care · Visalia, CA
CMS overall rating Info CMS (the Centers for Medicare & Medicaid Services) is the federal agency that rates nursing home quality. Its Overall Rating runs from 1 to 5 stars, combining health inspections, staffing, and quality measures, with inspections weighted most heavily.
Calculator: See prices in your area
Westgate Gardens Care Center accepts Medicare, Medicaid, and private pay.

Overview of Westgate Gardens Care Center

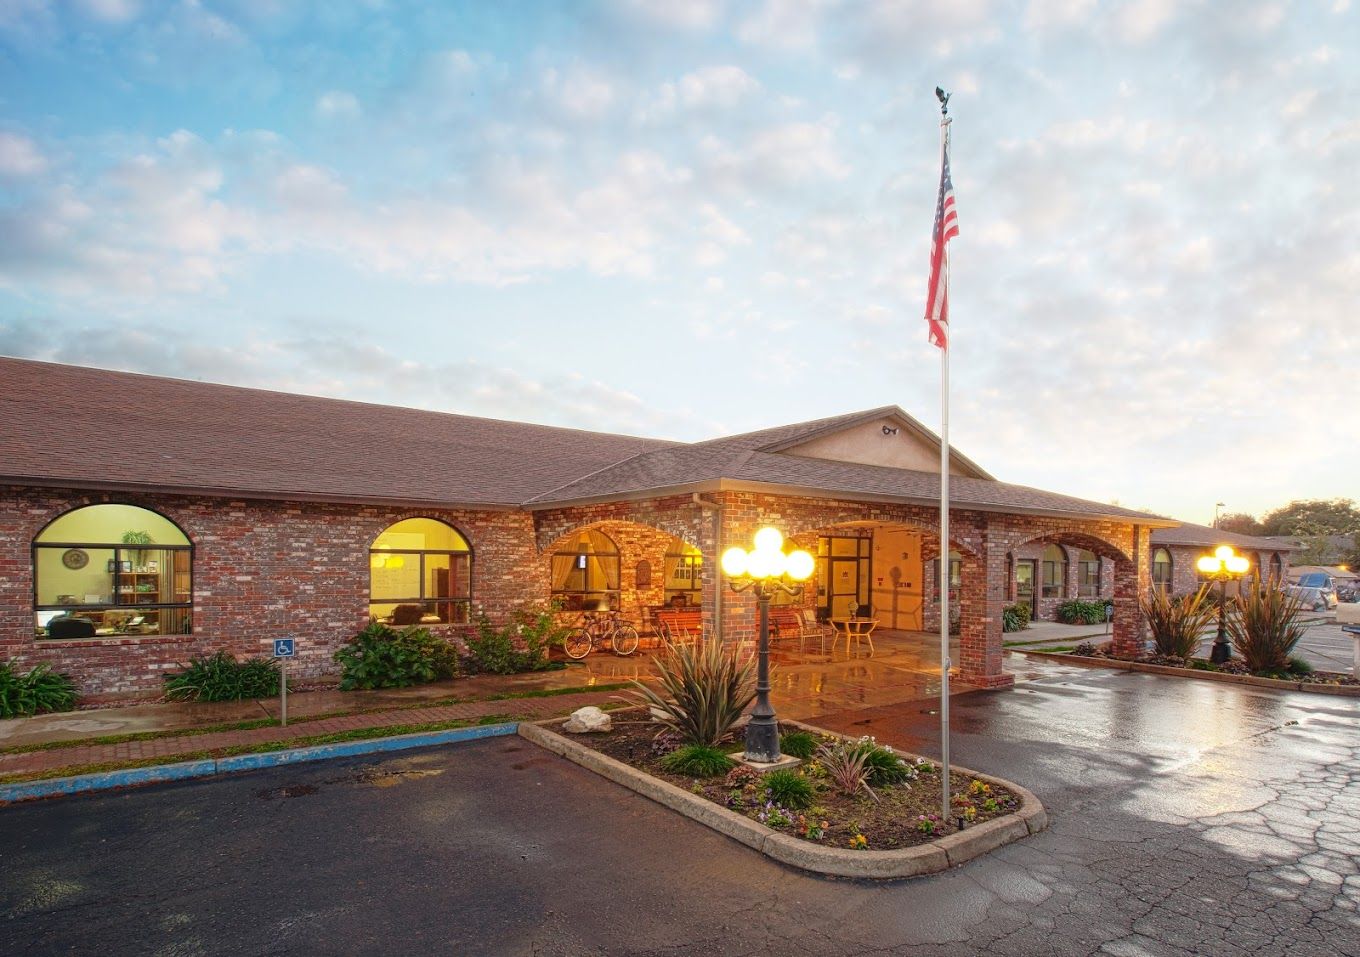
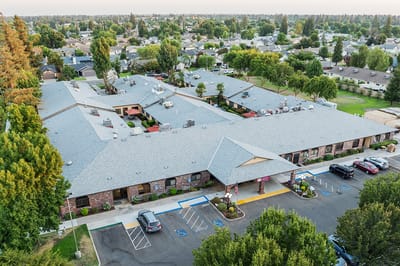
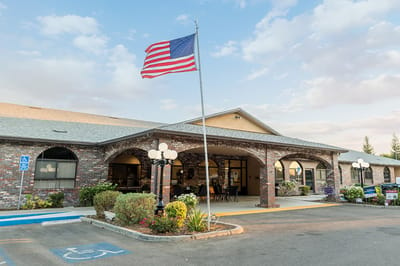
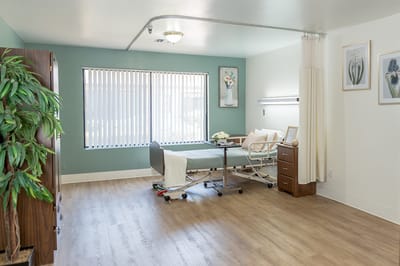
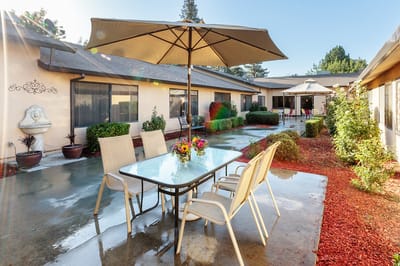
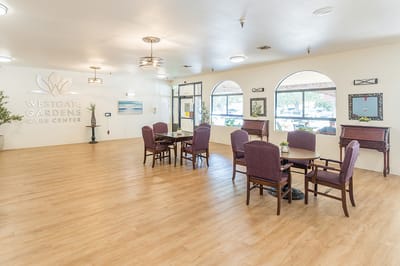
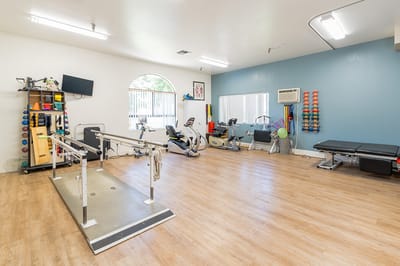
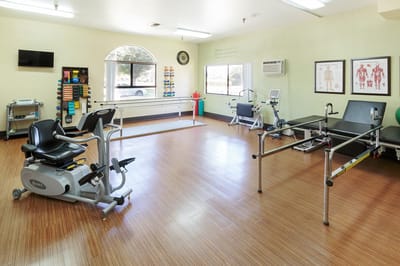
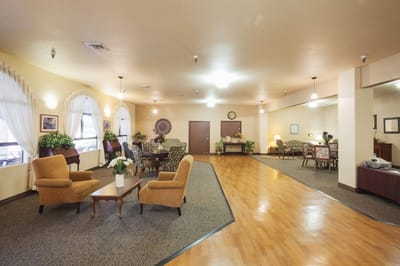
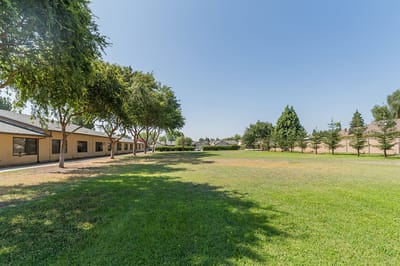
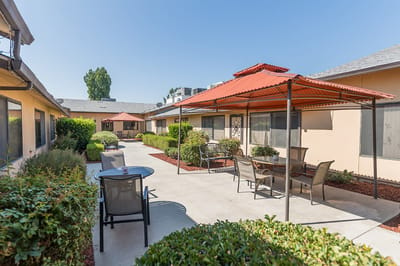
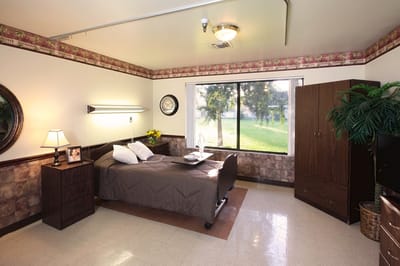
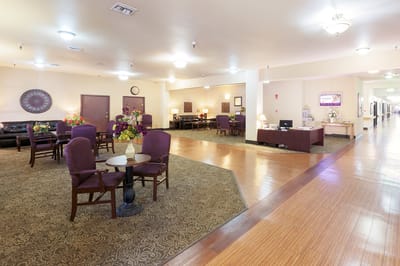
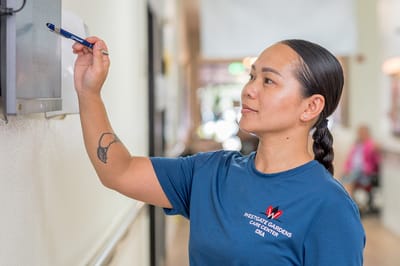
A distinguished senior living community situated in the serene residential area of West Tulare Avenue, Visalia, CA, Westgate Gardens Care Center offers short-term rehabilitation, skilled nursing, long-term care, complex wound care, and hospice services. As a four-star rated Medicare community, Westgate Gardens Care Center continuously provides top-tier care and assistance for seniors to have a safe healing journey. The community doubles its efforts to create a care plan that best matches residents’ special needs and aspirations.

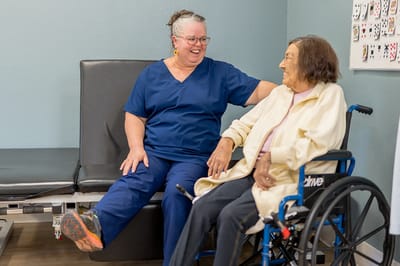
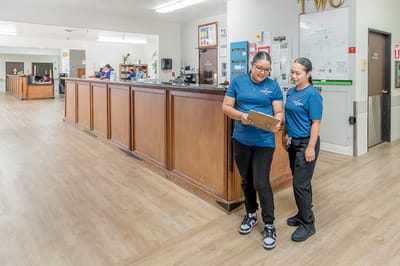
With round-the-clock care and assistance from a team of compassionate and highly skilled professionals consisting of licensed nurses, seniors can ease their minds and live comfortably. Ideally placed near convenient amenities such as Kaweah Health Medical Hospital and stunning attractions, the community ensures residents are well-cared for. Westgate Gardens Care Center strives to provide a safe place for seniors to heal and experience unrivaled care in its cozy spaces.

Quality ratings

Measured by Centers for Medicare & Medicaid Services (CMS)

Overall rating Info The Overall CMS Rating combines results from health inspections, staffing levels and quality measures. Health inspections carry the most weight. Staffing and quality scores can increase or decrease the final rating based on performance compared to state and national standards.
Health Inspection Info Based on the results of the facility's three most recent standard inspections and any complaint investigations. CMS reviews the number, scope, and severity of deficiencies, with more recent findings weighted more heavily.
Staffing Info Measures average nursing staff hours per resident per day, including Registered Nurses (RNs) and total nursing staff. Ratings are adjusted based on the level of care residents require and are compared to state and national benchmarks.
Quality Measures Info Based on clinical and physical health indicators reported to CMS, such as hospital readmissions, falls, pressure ulcers, and improvements in mobility. These measures reflect how well residents' health needs are being managed.

Staffing hours breakdown

Info Daily nursing hours per resident by staff type, reported to CMS. Higher is generally better — compare this facility to state and national averages to see where staffing stands.

Hours per resident per day — compared to state averages

Total nursing care / resident Info Total adjusted nursing hours per resident per day, combining RN, LPN, and aide time. CMS adjusts this for case-mix so facilities can be fairly compared.
3h 9m per day
Rank #336 / 354Nurse hours — State benchmarkedThis home is ranked 336th out of 354 homes in California. Shows adjusted nurse hours per resident per day benchmarked to the California average, with a ranking across 354 California facilities. More hours mean more direct care. The national average is about 3.5 hrs; below 3.0 is a red flag.Rankings are based only on facilities in California that report data for that category. Facilities without available data are excluded from the ranking.Click the rank badge to see the full State ranking.Click here to see the full State ranking.
vs avg

4 of 6 metrics below state avg

Standout metric Physical Therapist is +24% above state avg
Staff typeHours / Day / Residentvs state avg
Registered Nurse (RN) Info RNs hold the highest nursing license and can assess residents, interpret test results, and direct care plans. More RN hours per day often signals stronger clinical oversight and faster response to health changes. 18m per day ▼ 55% State avg: 39m per day · National avg: 41m per day
LPN / LVN Info Licensed Practical Nurses (LPNs) or Licensed Vocational Nurses (LVNs) deliver routine hands-on care — medication administration, wound dressing, and monitoring vital signs. They work under RN supervision and make up a large share of daily bedside care. 1h 9m per day ▼ 6% State avg: 1h 13m per day · National avg: 52m per day
Nurse Aide Info Certified Nurse Aides (CNAs) provide the most direct day-to-day assistance: bathing, dressing, feeding, and mobility. Nurse aide hours are typically the largest staffing category and directly affect residents' quality of life. 2h 42m per day ▲ 3% State avg: 2h 38m per day · National avg: 2h 20m per day
Weekend Total Nursing Info Combined nursing hours (RN + LPN + Nurse Aide) per resident per day on weekends. Staffing often drops on weekends — this figure reveals whether the facility maintains adequate coverage outside of weekday hours. 3h 48m per day ▼ 7% State avg: 4h 5m per day · National avg: 3h 26m per day
Physical Therapist Info Hours per resident per day provided by licensed Physical Therapists (PTs) or PT Assistants. PT services help residents recover mobility after injury or illness and are especially important for post-acute (short-stay) rehabilitation. 6m per day ▲ 24% State avg: 5m per day · National avg: 4m per day
Weekend RN Info Registered nurse hours specifically on weekends. Facilities sometimes reduce RN presence on Saturdays and Sundays — a low weekend RN figure compared to weekday hours can indicate reduced clinical oversight when most administrative staff are absent. 11m per day ▼ 65% State avg: 30m per day · National avg: 28m per day

Capacity and availability

This home usually has availability

Lower occupancy than the state average
Occupancy rate
31.4% Rank #1484 / 1537Occupancy rate — State benchmarkedThis home is ranked 1484th out of 1537 homes in California. Shows this facility's occupancy rate versus the California average, with its Statewide rank out of 1537. Higher occupancy signals strong local demand and financial stability.Rankings are based only on facilities in California that report data for that category. Facilities without available data are excluded from the ranking.Click the rank badge to see the full State ranking.Click here to see the full State ranking.
Avg. Length of Stay
141 days
Bed community size
140-bed community Rank #419 / 1657Bed count — State benchmarkedThis home is ranked 419th out of 1657 homes in California. Shows this facility's certified or reported bed count compared to other California facilities. Larger communities may offer more amenities, programs, and on-site services for residents and families.Rankings are based only on facilities in California that report data for that category. Facilities without available data are excluded from the ranking.Click the rank badge to see the full State ranking.Click here to see the full State ranking.
A larger shared setting that may offer more common spaces and organized community services.
Years in operation
42 years in operation Rank #34 / 1487Years in operation — State benchmarkedThis home is ranked 34th out of 1487 homes in California. Shows how long this facility has been in operation compared to other California facilities. Longer operating histories may benefit residents, families, and staff.Rankings are based only on facilities in California that report data for that category. Facilities without available data are excluded from the ranking.Click the rank badge to see the full State ranking.Click here to see the full State ranking.
A longer operating history, which may indicate experience navigating regulations and delivering ongoing care.
Walk Score
Walk Score: 36 / 100 Rank #1628 / 2092Walk Score — State benchmarkedThis home is ranked 1628th out of 2092 homes in California. Shows how walkable this facility's neighborhood is compared to the average Walk Score across California facilities. Higher scores benefit residents, families, and staff.Rankings are based only on facilities in California that report data for that category. Facilities without available data are excluded from the ranking.Click the rank badge to see the full State ranking.Click here to see the full State ranking.
Somewhat walkable. A few nearby services may be reachable on foot, but most trips require transportation.

About this community

Awards

Best Nursing Homes – Short-Term Rehabilitation award from U.S. News
5-Star Quality Measures Medicare Rating

License Details

CMS Certification Number555208

Staffing

Key information about the people who lead and staff this community.

Leadership

ContactEric Tolman, Administator

Therapy & Rehabilitation

1 service
Rehabilitation Services

Staffing & Medical

1 service
24-Hour Staffing

Memory & Specialized Care

1 service
No Alzheimer's certification

Amenities & Lifestyle

Expansive Rehab Gym
Spacious Courtyards
Common Areas
Restaurant-Style Dining
Activities
Specific ProgramsShort-Term Rehabilitation, 24-Hour Skilled Nursing, Complex Wound Care
Touring HoursMonday – Friday: 9 am to 5 pm

Contact Westgate Gardens Care Center

Inspection History

In California, the Department of Social Services (for assisted living facilities) and the Department of Public Health (for nursing homes) conduct inspections to ensure resident safety and regulatory compliance.

Since 2019 · 7 years of data 54 citations 25 total visits 9 complaint visits
Inspection Score Info A composite 0–100 score combining this facility's inspections, citations, complaints, and enforcement actions relative to the California state average. The score below shows how many points this facility sits above or below the typical California assisted living residence score (the benchmark); higher is better.

7 points below the California average for assisted living residences (81/100)

Rank #998 / 1401 in California Inspection Score — State benchmarked This home is ranked 998th out of 1401 homes in California. Shows this facility's inspection score compared to the California average among 1401 comparable communities in the ranking pool. Rankings are based only on facilities in California that report data for that category. Facilities without available data are excluded from the ranking. Inspection score: 74 out of 100. Letter grade C. 7 points below the California average for assisted living residences (81/100)

Inspection Scorecard Info This scorecard compares key inspection, citation, and complaint metrics at this facility against the California state average. Metrics rated ≥15% worse than average are highlighted in red; those ≥15% better are highlighted in green.

Since 2019 vs. California state average
Overall vs. CA average 2 Worse Metrics worse than California average:
• Total citations (440% above)
• Citations per year (450% above)
4 Better Metrics better than California average:
• Citations per inspection (33% below)
• Total visits (44% below)
• Complaint visits (31% below)
• Other visits (100% below)
Latest Inspection December 22, 2025 Plan Of Correction

Citations Info Citations are formal regulatory issues recorded during state inspections.

This FacilityCA Averagevs. CA Avg
Total citations Info Formal regulatory issues recorded by inspectors across all inspection types. 5410 This facility has 440% more total citations than a typical California assisted living residence (54 vs. CA avg 10).↑ 440% worse
Citations per year Info Average citations per year since 2019. 7.71.4 This facility has 450% more citations per year than a typical California assisted living residence (7.7 vs. CA avg 1.4).↑ 450% worse
Citations per inspection Info Average citations per inspection. 2.23.3 This facility has 33% fewer citations per inspection than a typical California assisted living residence (2.2 vs. CA avg 3.3).↓ 33% better

Inspections & Visits Info State inspections evaluate whether the facility meets health and safety standards.

This FacilityCA Averagevs. CA Avg
Total visits Info Combined count of complaint visits, other regulatory visits, and official scheduled inspections. 916 This facility has 44% fewer total visits than a typical California assisted living residence (9 vs. CA avg 16).↓ 44% better
Complaint visits Info On-site visits triggered by formal complaints filed by residents, families, or staff. 913 This facility has 31% fewer complaint visits than a typical California assisted living residence (9 vs. CA avg 13).↓ 31% better
Other visits Info Regulatory visits that are neither routine inspections nor complaint investigations — administrative check-ins, follow-up reviews, licensing-related visits. 07 This facility has 100% fewer other visits than a typical California assisted living residence (0 vs. CA avg 7).↓ 100% better

Health Inspection History

Inspections since 2019
Total health inspections 25

State average N/A


Last Health inspection on Aug 2025

Total health citations
55 Rank #250 / 361Health citations — State benchmarkedThis home is ranked 250th out of 361 homes in California. Shows this facility's total health deficiency citations benchmarked to the California State average, with a ranking across all 361 CA facilities. Lower citation counts earn a better rank.Rankings are based only on facilities in California that report data for that category. Facilities without available data are excluded from the ranking.Click the rank badge to see the full State ranking.Click here to see the full State ranking.

State average N/A

Citations per inspection
2.2 Rank #14 / 361Citations per inspection — State benchmarkedThis home is ranked 14th out of 361 homes in California. Shows average deficiency citations per CMS inspection for this facility versus the California mean across 361 facilities with citation data. Lower is better.Rankings are based only on facilities in California that report data for that category. Facilities without available data are excluded from the ranking.Click the rank badge to see the full State ranking.Click here to see the full State ranking.

State average N/A


Health citations are formal notices following inspections when they fail to comply with safety and care standards.

30 of 55 citations resulted from standard inspections; and 25 of 55 resulted from complaint investigations.

Breakdown of citation severity (last 7 years)
Critical health citations
0
In line with State average

State average: N/A


Serious health citations
1
In line with State average

State average: N/A

0 critical citations State average: N/A

1 serious citation State average: N/A

54 moderate citations State average: N/A

0 minor citations State average: N/A
Citations history (last 7 years)
Quality of Care moderate citation Aug 05, 2025
Corrected

Resident Rights moderate citation Aug 05, 2025
Corrected

Administration moderate citation Jul 01, 2025
Corrected

Abuse/Neglect moderate citation Jun 11, 2025
Corrected

Staffing Data

Reporting period: October 1 – December 31, 2025 (Q4 2025). Source: CMS Payroll-Based Journal report.

Total staff 226
Employees 223
Contractors 3
Staff to resident ratio 1.70 : 1
0% compared with State average

State average ratio: 0 : 0

Avg staff/day 90
Average shift 7.6 hours
0% compared with State average

State average: 0 hours

Total staff hours (quarter) 63,113

Nursing staff breakdown

Q4 2025 · Oct 1 – Dec 31 More info This data comes from the CMS Payroll-Based Journal report covering October 1 – December 31, 2025.
Registered Nurse

Manages medical care and health needs.

RN Staff Info All 9 RN Staff are full-time employees. No contractors work on this role. 9
Average shift length Info Average shift length. Calculated as total hours divided by days worked and average staff per day. 8.9 hours
Licensed Practical Nurse

Assists with medical care and medications.

LPN Staff Info All 38 LPN Staff are full-time employees. No contractors work on this role. 38
Average shift length Info Average shift length. Calculated as total hours divided by days worked and average staff per day. 9.5 hours
Certified Nursing Assistant

Helps with daily care and mobility.

CNA Staff Info All 136 CNA Staff are full-time employees. No contractors work on this role. 136
Average shift length Info Average shift length. Calculated as total hours divided by days worked and average staff per day. 7 hours

Contractor staffing

Q4 2025 · Oct 1 – Dec 31 More info This data comes from the CMS Payroll-Based Journal report covering October 1 – December 31, 2025.

Total hours from contractors

0.5%

285 contractor hours this quarter

Physical Therapy Assistant: 2 Medical Director: 1

Staff by category

Q4 2025 · Oct 1 – Dec 31 More info This data comes from the CMS Payroll-Based Journal report covering October 1 – December 31, 2025.
Certified Nursing Assistant136013633,08292100%7
Licensed Practical Nurse3803813,03492100%9.5
Registered Nurse9093,11092100%8.9
Speech Language Pathologist7071,7846773%7.6
Physical Therapy Aide5051,7287076%7.7
Qualified Activities Professional5051,6119199%9.5
Physical Therapy Assistant3251,3178087%7.7
Respiratory Therapy Technician5051,2647582%7.1
Other Dietary Services Staff3039829098%7.4
RN Director of Nursing2029596470%7.8
Dental Services Staff2027716166%7.3
Qualified Social Worker2027606874%6.9
Occupational Therapy Aide1015126470%8
Mental Health Service Worker1015126470%8
Nurse Practitioner1014645863%8
Therapeutic Recreation Specialist1014516065%7.5
Administrator1014286368%6.8
Dietitian1013154448%7.2
Medical Director011303033%1
136 Certified Nursing Assistant
% of Days 100%
38 Licensed Practical Nurse
% of Days 100%
9 Registered Nurse
% of Days 100%
7 Speech Language Pathologist
% of Days 73%
5 Physical Therapy Aide
% of Days 76%
5 Qualified Activities Professional
% of Days 99%
5 Physical Therapy Assistant
% of Days 87%
5 Respiratory Therapy Technician
% of Days 82%
3 Other Dietary Services Staff
% of Days 98%
2 RN Director of Nursing
% of Days 70%
2 Dental Services Staff
% of Days 66%
2 Qualified Social Worker
% of Days 74%
1 Occupational Therapy Aide
% of Days 70%
1 Mental Health Service Worker
% of Days 70%
1 Nurse Practitioner
% of Days 63%
1 Therapeutic Recreation Specialist
% of Days 65%
1 Administrator
% of Days 68%
1 Dietitian
% of Days 48%
1 Medical Director
% of Days 33%

Penalties and fines

Includes penalties issued in 2025

Federal penalties imposed by CMS for regulatory violations, including civil money penalties (fines) and denials of payment for new Medicare/Medicaid admissions.

Source: CMS Penalties Database (Data as of Jan 2026)

Total fines amount $8K Rank #244 / 362Federal fines — State benchmarkedThis home is ranked 244th out of 362 homes in California. Shows this facility's cumulative CMS federal fine dollars versus the California average among facilities with fines, and where it ranks among 362 facilities in the pool. Lower total dollars mean a better rank.Rankings are based only on facilities in California that report data for that category. Facilities without available data are excluded from the ranking.Click the rank badge to see the full State ranking.Click here to see the full State ranking.
85% lower than State average

State average: $55K

Number of fines 1
58% fewer fines than State average

State average: 2.4

Payment Denials Info Serious action where Medicare and/or Medicaid temporarily stops payments for new residents until issues are fixed. 1
102% more payment denials than State average

State average: 0.5

Fines amount comparison
This facility $8K
State average $55K
Penalty History

Penalties are imposed by CMS for violations of federal nursing home regulations.

2 penalties in the past 3 years

Multiple penalties were reported in the last 3 years.

Civil Money Penalty Info Fines imposed for noncompliance, which can be assessed per day or per instance of violation. May 15, 2025
$8K
Payment Denial Info Serious action where Medicare and/or Medicaid temporarily stops payments for new residents until issues are fixed. May 15, 2025
32 days

Last updated: Jan 2026

Quality of care over time

These measures show how residents usually do over time at this home, based on health outcomes and preventive care.

High-risk clinical events score Info A composite score based on pressure ulcers, falls with injury, weight loss, walking ability decline, and activities of daily living decline. 5.2
22% better than State average

State average: 6.6

Functional decline score Info A composite score based on activities of daily living decline, walking ability decline, and incontinence. 9.4
17% better than State average

State average: 11.3

Long-stay resident measures
Significantly above average State avg: 4.2 Info CMS star rating based on long-stay quality measure performance. 5 stars = significantly above average, 1 star = significantly below average.
Need for Help with Daily Activities Increased Info Percent of long-stay residents whose need for help with daily activities has increased 7.9%
29% better than State average

State average: 11.1%

Walking Ability Worsened Info Percent of long-stay residents whose ability to move independently worsened 13.7%
15% worse than State average

State average: 12.0%

Low Risk Residents with Bowel/Bladder Incontinence Info Percent of low risk long-stay residents who lose control of their bowels or bladder 6.7%
41% better than State average

State average: 11.3%

Falls with Major Injury Info Percent of long-stay residents experiencing one or more falls with major injury 2.6%
56% worse than State average

State average: 1.7%

High Risk Residents with Pressure Ulcers Info Percent of long-stay high risk residents with pressure ulcers 1.1%
79% better than State average

State average: 5.0%

Urinary Tract Infection Info Percent of long-stay residents with a urinary tract infection 0.0%
100% better than State average

State average: 1.2%

Lost Too Much Weight Info Percent of long-stay residents who lose too much weight 0.6%
86% better than State average

State average: 4.2%

Depressive Symptoms Info Percent of long-stay residents who have depressive symptoms 12.8%
92% worse than State average

State average: 6.7%

Antipsychotic Use Info Percent of long-stay residents who received an antipsychotic medication 7.0%
31% better than State average

State average: 10.1%

Pneumococcal Vaccine Info Percent of long-stay residents assessed and appropriately given the pneumococcal vaccine 100.0%
In line with State average

State average: 98.5%

Influenza Vaccine Info Percent of long-stay residents assessed and appropriately given the seasonal influenza vaccine 100.0%
In line with State average

State average: 98.2%

Hospitalizations per 1,000 days Info Number of hospitalizations per 1,000 long-stay resident days. 1.61
28% better than State average

State average: 2.25

ED visits per 1,000 days Info Number of outpatient emergency department visits per 1,000 long-stay resident days. 1.35
15% better than State average

State average: 1.59

Short-stay resident measures
Above average State avg: 3.5 Info CMS star rating based on short-stay quality measure performance. 5 stars = much above average, 1 star = much below average.
Pneumococcal Vaccine Info Percent of short-stay residents assessed and appropriately given the pneumococcal vaccine 99.8%
6% better than State average

State average: 94.0%

Antipsychotic medication increase Info Percent of short-stay residents who newly received an antipsychotic medication 0.0%
100% better than State average

State average: 1.5%

Influenza Vaccine Info Percent of short-stay residents assessed and appropriately given the seasonal influenza vaccine 93.8%
In line with State average

State average: 93.2%

Re-hospitalized after SNF stay Info Percentage of short-stay residents who were re-hospitalized after their nursing home admission. 19.7%
15% better than State average

State average: 23.2%

Emergency department visits Info Percentage of short-stay residents who had an outpatient emergency department visit. 13.1%
17% worse than State average

State average: 11.2%

Falls with major injury Info Percentage of SNF residents who experience falls with major injury during their stay. 0.4%
49% better than State average

State average: 0.8%

Ability to care for self at discharge Info Percentage of residents at or above expected ability to care for themselves at discharge. 32.8%
39% worse than State average

State average: 53.7%

Successful return to home or community Info Rate of successful return to home or community from a skilled nursing facility. 59.7%
18% better than State average

State average: 50.6%

Breakdown by payment type

Medicare

81% of new residents, usually for short-term rehab.

Typical stay 1 - 2 months

Private pay

13% of new residents, often for short stays.

Typical stay 2 years

Medicaid

6% of new residents, often for long-term daily care.

Typical stay 8 - 9 months

Facility Characteristics

Source: CMS Long-Term Care Facility Characteristics (Data as of Jan 2026)

Total residents 133
Medicare
27
20.3% of residents
Medicaid
83
62.4% of residents
Private pay or other
23
17.3% of residents
Programs & Services
Residents Group

Residents meet regularly to discuss policies, care quality, and activities

Clinical Research

Conducts clinical research trials to develop and test new treatments

Active Resident Council

Organized group of residents that meets regularly to discuss facility policies, quality of life, and activities.

Finances and operations

Based on CMS SNF Cost Report for fiscal year ending in 12/2023.

For-profit
Corporation
Net patient revenue Info Net patient revenue — what the home actually collects for resident care, after contractual allowances, bad debt and discounts are subtracted from its gross charges (CMS cost report, Worksheet G-3). It covers resident care only; money the home earns from other sources is shown separately as "Other income."
$18.7M
Net patient income Info Net patient income: net patient revenue minus the home's total operating expenses. A positive figure means it earns more from resident care than it spends to deliver it; a negative figure means the opposite. It excludes non-operating "other income."
$1.2M
For-profit Corporation
Net patient revenue Info Net patient revenue — what the home actually collects for resident care, after contractual allowances, bad debt and discounts are subtracted from its gross charges (CMS cost report, Worksheet G-3). It covers resident care only; money the home earns from other sources is shown separately as "Other income."
$18.7M Rank #49 / 355Revenue — State benchmarkedThis home is ranked 49th out of 355 homes in California. Shows this facility's annual revenue compared to the California average. Higher revenue generally means more resources for staffing and capital — read alongside Payroll %.Rankings are based only on facilities in California that report data for that category. Facilities without available data are excluded from the ranking.Click the rank badge to see the full State ranking.Click here to see the full State ranking.
Net patient income Info Net patient income: net patient revenue minus the home's total operating expenses. A positive figure means it earns more from resident care than it spends to deliver it; a negative figure means the opposite. It excludes non-operating "other income."
$1.2M
Other income Info Money the home earns outside of resident care — such as investments, grants, rentals and other non-operating sources (CMS cost report, Worksheet G-3). It is tracked separately from net patient revenue: it is not part of that figure, and it is not included in net patient income.
$9.6K
Payroll costs Info Staff salaries plus wage-related costs — benefits such as payroll taxes, health insurance and retirement — from the home's own accounting records (CMS cost report, Worksheet A). Contract or agency labor is counted separately, under other operating costs. Rank #115 / 355Payroll — State benchmarkedThis home is ranked 115th out of 355 homes in California. Shows total annual staff payroll benchmarked to the California average. Higher payroll investment relative to peers often signals better staffing and less reliance on cheaper contract labor.Rankings are based only on facilities in California that report data for that category. Facilities without available data are excluded from the ranking.Click the rank badge to see the full State ranking.Click here to see the full State ranking.
$10.0M 53.2% of net patient revenue Info Payroll as a share of revenue: staff salaries and wage-related benefits divided by net patient revenue. A higher figure means more of each revenue dollar goes to staff pay. Rank #332 / 355Payroll % — State benchmarkedThis home is ranked 332nd out of 355 homes in California. Shows payroll as a percentage of revenue versus the California average. Well-run California facilities typically land around 55–67% — the top third Statewide. Below 25% may signal understaffing or heavy agency use — read with Staffing ratings.Rankings are based only on facilities in California that report data for that category. Facilities without available data are excluded from the ranking.Click the rank badge to see the full State ranking.Click here to see the full State ranking.
Other operating costs Info Everything it costs to run the home apart from payroll — food, utilities, supplies, maintenance, contract labor and administration. Calculated as total operating expense minus payroll (staff salaries and wage-related benefits).
$7.6M
Total costs Info The home's total operating expense for the year — all the costs of running it, salaries included (CMS cost report, Worksheet G-3).
$17.5M

What does this home offer?

Building type icon
Building type icon

Building Type: Single-story

Who this home usually serves

TYPE OF STAY

Mostly short-term rehab stays

Most residents typically stay for a few weeks or months before returning home or moving on.

Most new residents arrive under Medicare (81% of admissions), and a typical Medicare stay runs around 1 - 2 months.

Admissions
320 total

Coverage residents most often arrive under.

Medicare 81%
Private pay 13%
Medicaid 6%
Discharges
339 total

Coverage residents most often leave under.

Medicare 95%
Private pay 3%
Medicaid 2%

Places of interest near Westgate Gardens Care Center

Address 3.3 miles from city center Info Estimated distance in miles from Visalia's city center to Westgate Gardens Care Center's address, calculated via Google Maps.

Calculate Travel Distance to Westgate Gardens Care Center

Add your location

Address

Compare Nursing Homes around the area

The information below is reported by the California Department of Social Services and Department of Public Health.

Westgate Gardens Care Center
NH
HC
NC
Visalia -140 - 36 -
OakView Health Center
NH
AL
MC
Thousand Oaks (Mountclef Village) -63 A+ 20 Private / Semi-Private Rooms
Bayshire Carlsbad
NH
AL
IL
MC
Carlsbad (Palamai) -125 A+ 59 Studio / 1 Bed / 2 Bed
The Reutlinger Community
NH
AL
IL
MC
Danville -120 A+ 30 Studio / 1 Bed
Heritage Gardens
NH
AL
HC
IL
NC
RC
Loma Linda -64 A+ 47 Private / Semi-Private Rooms

Frequently Asked Questions about Westgate Gardens Care Center

Is Westgate Gardens Care Center in a walkable area?

Westgate Gardens Care Center has a walk score of 36. Somewhat walkable. A few nearby services may be reachable on foot, but most trips require transportation.

What is the occupancy rate at Westgate Gardens Care Center?

Westgate Gardens Care Center's occupancy is 93.7%.

Does Westgate Gardens Care Center operate as a for-profit or non-profit?

Westgate Gardens Care Center is registered as a for-profit in CA.

Are there photos of Westgate Gardens Care Center?

Yes — there are 24 photos of Westgate Gardens Care Center in the photo gallery on this page.

What is the address of Westgate Gardens Care Center?

Westgate Gardens Care Center is located at 4525 W Tulare Ave, Visalia, CA 93277.

What is the phone number of Westgate Gardens Care Center?

(559) 733-0901 will put you in contact with the team at Westgate Gardens Care Center.

Is Westgate Gardens Care Center Medicare or Medicaid certified?

Yes — Westgate Gardens Care Center is a CMS-certified provider of Medicare and Medicaid.

Guides for Better Senior Living

Care Cost Calculator: See Prices in Your Area

Nursing Home Data Explorer

Don’t Wait Too Long: 7 Red Flag Signs Your Parent Needs Assisted Living Now

The True Cost of Assisted Living in 2025 – And How Families Are Paying For It

Understanding Senior Living Costs: Pricing Models, Discounts & Financial Assistance