Total health inspections
13
Virginia average 4.2
Last Health inspection on Oct 2025

We arrange tours, appointments, and even moving support so you don’t have to
Thank you for your interest!
Our team will be in touch shortly to help with next steps.
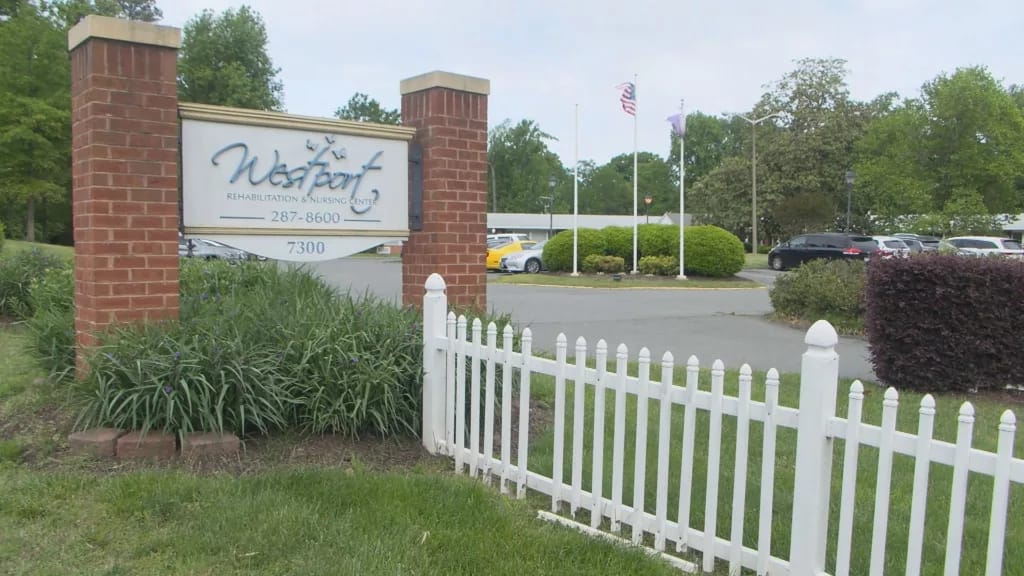

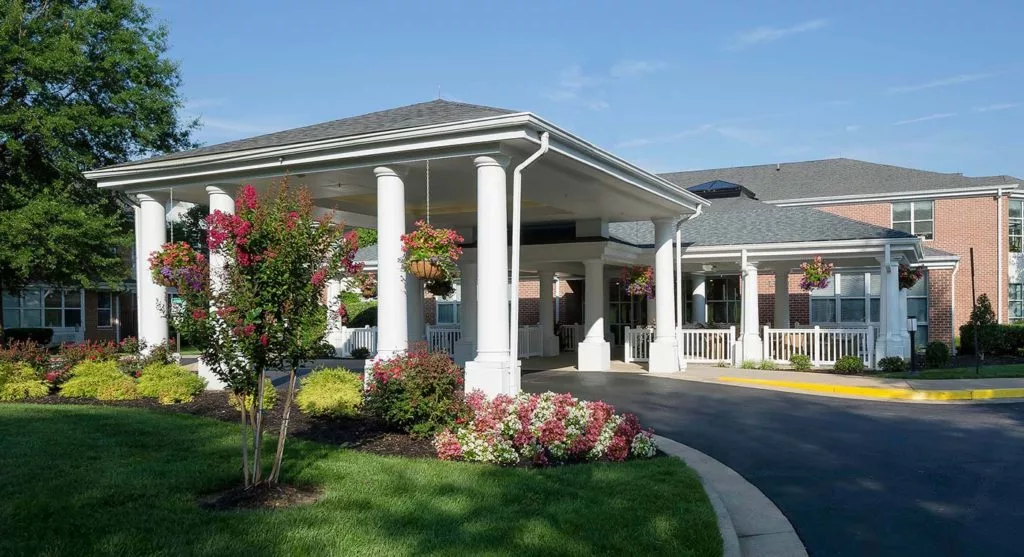
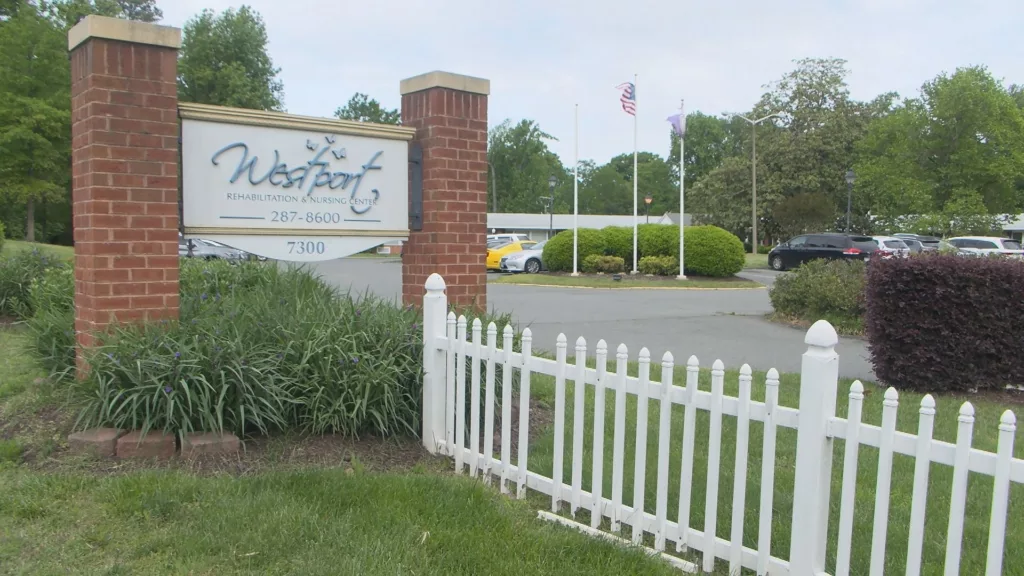
Westport Rehabilitation and Nursing Center in Richmond, Virginia is dedicated to providing patient-focused care that is proactive and tailored to the unique needs of each individual in their retirement years. They have established strong partnerships with local hospitals and physicians to ensure comprehensive and coordinated care for seniors. They mainly offer a wide range of services, including short-term rehabilitation, long-term care, respite care, and room care service. With an array of therapies available, including wound care, IV therapy, occupational therapy, physical therapy, and speech therapy, Westport Rehabilitation and Nursing Center is definitely at the top of their game.
In addition to their medical services, the center also places importance on social, recreational, and religious activities, recognizing the importance of holistic care. They offer round-the-clock admissions, and accept various insurance plans such as Virginia Premier, Tricare, Humana, and more, making their services accessible to a wide range of patients. Westport Rehabilitation and Nursing Center is unquestionably committed to a warm and supportive environment for their residents, with a focus on enhancing their overall well-being.
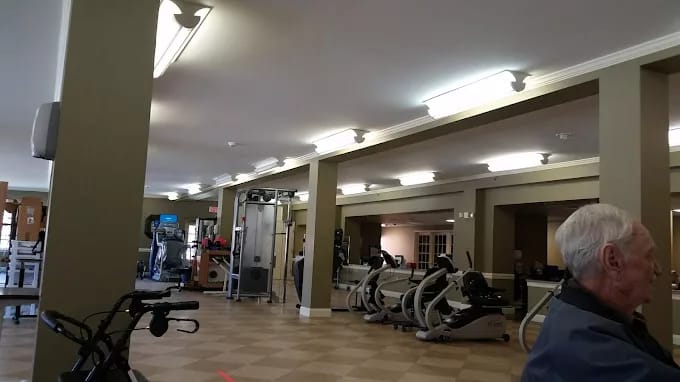
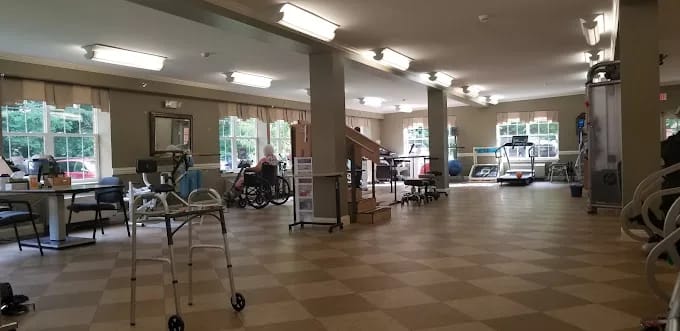
To ensure effective communication, the home provides sign language and oral interpreters for seniors at no additional cost. They also offer specialized programs for cardiac patients, orthopedic patients, and those requiring long-term care. With a dedicated therapy team and advanced amenities like the AntiGravity treadmill, dynamic stair trainer, CyberCycles, and swallowing stimulation therapy, Parham Healthcare and Rehabilitation Center is committed to delivering top-quality care. In addition to their medical services, the center also places emphasis on providing a delightful dining experience, with nutritious and delicious meals that contribute to the overall well-being of residents.
May provide extensive amenities, services and programs.
Occupancy is moderate, suggesting balanced demand.
Residents typically stay for brief periods, with frequent admissions and discharges throughout the year.
29% of new residents, usually for short-term rehab.
68% of new residents, often for short stays.
3% of new residents, often for long-term daily care.
Virginia average 4.2
Last Health inspection on Oct 2025
Virginia average 38.4
Virginia average 8.93
Health citations are formal notices following inspections when they fail to comply with safety and care standards.
65 of 139 citations resulted from standard inspections; 50 of 139 resulted from complaint investigations; and 24 of 139 came from combined inspections (standard and complaint).
Virginia average: 0.4
Virginia average: 1
Data sourced from CMS Health Deficiencies reports. Citation severity codes range from A (least serious) to L (most serious). Immediate Jeopardy (J-L) citations indicate situations where the facility's noncompliance has placed residents at risk of death or serious harm.
Nursing Home Licensed facility providing 24/7 skilled nursing care for residents with complex, ongoing medical needs. Staffed by RNs, LPNs, and CNAs. Inspected and star-rated annually by CMS. Accepts Medicare (short-term rehab) and Medicaid (long-term care).
Assisted Living A licensed, long-term care setting for seniors or individuals with disabilities who need help with daily activities — like bathing, dressing, and medication management — but not 24-hour skilled nursing. Offers housing, meals, and around-the-clock support while aiming to maximize resident independence.
![]() 7.0 miles from city center — 0.41 miles to nearest hospital (Henrico Doctors' Hospital)
7.0 miles from city center — 0.41 miles to nearest hospital (Henrico Doctors' Hospital)
Add your location
This data corresponds to Q2 2025 and is based on CMS Payroll-Based Journal.
Virginia average ratio: 1.67:1
Virginia average: 8 hours
Manages medical care and health needs.
This role is partially covered by contractors.
Assists with medical care and medications.
This role is partially covered by contractors.
Helps with daily care and mobility.
This role is partially covered by contractors.
Total hours from contractors
3,366 contractor hours this quarter
| Certified Nursing Assistant | 96 | 10 | 106 | 33,257 | 91 | 100% | 9.2 |
| Licensed Practical Nurse | 38 | 15 | 53 | 17,650 | 91 | 100% | 9.9 |
| Registered Nurse | 16 | 4 | 20 | 4,382 | 91 | 100% | 9.1 |
| Clinical Nurse Specialist | 11 | 0 | 11 | 2,956 | 81 | 89% | 7.3 |
| Respiratory Therapy Technician | 15 | 0 | 15 | 2,652 | 85 | 93% | 7.2 |
| Nurse Aide in Training | 15 | 0 | 15 | 2,591 | 91 | 100% | 9.6 |
| RN Director of Nursing | 5 | 0 | 5 | 2,427 | 70 | 77% | 8 |
| Physical Therapy Assistant | 13 | 0 | 13 | 1,996 | 80 | 88% | 6.7 |
| Physical Therapy Aide | 9 | 0 | 9 | 1,848 | 79 | 87% | 6.8 |
| Speech Language Pathologist | 8 | 0 | 8 | 1,747 | 75 | 82% | 7.4 |
| Other Dietary Services Staff | 4 | 0 | 4 | 1,667 | 85 | 93% | 7.3 |
| Qualified Social Worker | 8 | 0 | 8 | 1,182 | 76 | 84% | 6.7 |
| Dental Services Staff | 2 | 0 | 2 | 662 | 63 | 69% | 7.8 |
| Nurse Practitioner | 2 | 0 | 2 | 547 | 65 | 71% | 6.5 |
| Mental Health Service Worker | 1 | 0 | 1 | 492 | 64 | 70% | 7.7 |
| Dietitian | 1 | 0 | 1 | 444 | 57 | 63% | 7.8 |
| Administrator | 1 | 0 | 1 | 408 | 51 | 56% | 8 |
| Other Social Services Staff | 1 | 0 | 1 | 407 | 52 | 57% | 7.8 |
| Occupational Therapy Aide | 0 | 1 | 1 | 164 | 31 | 34% | 5.3 |
Source: CMS Long-Term Care Facility Characteristics (Data as of Jan 2026)
Residents meet regularly to discuss policies, care quality, and activities
Organized group of residents that meets regularly to discuss facility policies, quality of life, and activities.
Data sourced from CMS Long-Term Care Facility Characteristics quarterly report. Payer mix reflects the current resident census by primary payment source.
These measures show how residents usually do over time at this home, based on health outcomes and preventive care.
Virginia average: 10.1
Virginia average: 19.7
Virginia average: 16.8%
Virginia average: 19.7%
Virginia average: 22.6%
Virginia average: 3.6%
Virginia average: 5.4%
Virginia average: 1.5%
Virginia average: 5.9%
Virginia average: 14.9%
Virginia average: 12.9%
Virginia average: 91.3%
Virginia average: 94.0%
Virginia average: 1.46
Virginia average: 1.41
Virginia average: 74.9%
Virginia average: 1.2%
Virginia average: 73.6%
Virginia average: 22.0%
Virginia average: 11.7%
Virginia average: 0.8%
Virginia average: 53.7%
Virginia average: 50.6%
Quality measures are calculated from Minimum Data Set (MDS) assessments. For most measures, lower percentages indicate better care quality.
Federal penalties imposed by CMS for regulatory violations, including civil money penalties (fines) and denials of payment for new Medicare/Medicaid admissions.
Source: CMS Penalties Database (Data as of Jan 2026)
Virginia average: $52K
Virginia average: 1.8
Virginia average: 0.1
Penalties are imposed by CMS for violations of federal nursing home regulations.
Last updated: Jan 2026
Historical financial and operational data for Westport Rehabilitation and Nursing Center based on CMS SNF Cost Reports.
Loading trend charts...
Care Cost Calculator: See Prices in Your Area
Nursing Home Data Explorer
Don’t Wait Too Long: 7 Red Flag Signs Your Parent Needs Assisted Living Now
The True Cost of Assisted Living in 2025 – And How Families Are Paying For It
Understanding Senior Living Costs: Pricing Models, Discounts & Financial Assistance

Touring a community? Use this expert-backed checklist to stay organized, ask the right questions, and find the perfect fit.
We'll send you a PDF version of the touring checklist.