


Total staff
250
Employees
249
Contractors
1


Westport Rehabilitation and Nursing Center in Richmond, Virginia is dedicated to providing patient-focused care that is proactive and tailored to the unique needs of each individual in their retirement years. They have established strong partnerships with local hospitals and physicians to ensure comprehensive and coordinated care for seniors. They mainly offer a wide range of services, including short-term rehabilitation, long-term care, respite care, and room care service. With an array of therapies available, including wound care, IV therapy, occupational therapy, physical therapy, and speech therapy, Westport Rehabilitation and Nursing Center is definitely at the top of their game.
In addition to their medical services, the center also places importance on social, recreational, and religious activities, recognizing the importance of holistic care. They offer round-the-clock admissions, and accept various insurance plans such as Virginia Premier, Tricare, Humana, and more, making their services accessible to a wide range of patients. Westport Rehabilitation and Nursing Center is unquestionably committed to a warm and supportive environment for their residents, with a focus on enhancing their overall well-being.
To ensure effective communication, the home provides sign language and oral interpreters for seniors at no additional cost. They also offer specialized programs for cardiac patients, orthopedic patients, and those requiring long-term care. With a dedicated therapy team and advanced amenities like the AntiGravity treadmill, dynamic stair trainer, CyberCycles, and swallowing stimulation therapy, Parham Healthcare and Rehabilitation Center is committed to delivering top-quality care. In addition to their medical services, the center also places emphasis on providing a delightful dining experience, with nutritious and delicious meals that contribute to the overall well-being of residents.
| Staff type | Hours / Day / Resident | vs state avg |
|---|---|---|
|
Registered Nurse (RN)
| 24m per day | ▼ 42% State avg: 41m per day · National avg: 41m per day |
|
LPN / LVN
| 1h 3m per day | ▲ 6% State avg: 1h 0m per day · National avg: 52m per day |
|
Nurse Aide
| 1h 57m per day | ▼ 9% State avg: 2h 8m per day · National avg: 2h 21m per day |
|
Weekend Total Nursing
| 3h 1m per day | ▼ 9% State avg: 3h 19m per day · National avg: 3h 26m per day |
|
Physical Therapist
| 7m per day | ▲ 44% State avg: 5m per day · National avg: 4m per day |
|
Weekend RN
| 16m per day | ▼ 42% State avg: 28m per day · National avg: 29m per day |
Reporting period: October 1 – December 31, 2025 (Q4 2025). Source: CMS Payroll-Based Journal report.
Manages medical care and health needs.
Assists with medical care and medications.
Helps with daily care and mobility.
Total hours from contractors
193 contractor hours this quarter
| Certified Nursing Assistant | 98 | 0 | 98 | 29,971 | 92 | 100% | 9.3 |
| Licensed Practical Nurse | 43 | 0 | 43 | 16,255 | 92 | 100% | 10.2 |
| Registered Nurse | 19 | 0 | 19 | 4,669 | 92 | 100% | 8.6 |
| Nurse Aide in Training | 21 | 0 | 21 | 3,902 | 92 | 100% | 9.4 |
| RN Director of Nursing | 6 | 0 | 6 | 2,129 | 67 | 73% | 7.4 |
| Respiratory Therapy Technician | 12 | 0 | 12 | 2,082 | 86 | 93% | 6.7 |
| Physical Therapy Assistant | 9 | 0 | 9 | 2,017 | 84 | 91% | 7.3 |
| Other Dietary Services Staff | 4 | 0 | 4 | 1,815 | 90 | 98% | 7.4 |
| Clinical Nurse Specialist | 9 | 0 | 9 | 1,721 | 79 | 86% | 6.5 |
| Physical Therapy Aide | 10 | 0 | 10 | 1,670 | 79 | 86% | 6.9 |
| Qualified Social Worker | 6 | 0 | 6 | 1,325 | 82 | 89% | 7 |
| Speech Language Pathologist | 4 | 0 | 4 | 1,191 | 78 | 85% | 7 |
| Dental Services Staff | 2 | 0 | 2 | 1,039 | 70 | 76% | 8.5 |
| Nurse Practitioner | 1 | 0 | 1 | 486 | 65 | 71% | 7.5 |
| Administrator | 1 | 0 | 1 | 434 | 57 | 62% | 7.6 |
| Dietitian | 2 | 0 | 2 | 362 | 52 | 57% | 7 |
| Other Social Services Staff | 1 | 0 | 1 | 227 | 29 | 32% | 7.8 |
| Occupational Therapy Aide | 0 | 1 | 1 | 193 | 40 | 43% | 4.8 |
| Mental Health Service Worker | 1 | 0 | 1 | 141 | 21 | 23% | 6.7 |
Includes penalties issued in 2024
Federal penalties imposed by CMS for regulatory violations, including civil money penalties (fines) and denials of payment for new Medicare/Medicaid admissions.
Source: CMS Penalties Database (Data as of Jan 2026)
Virginia average: $52K
Virginia average: 1.8
Virginia average: 0.1
Penalties are imposed by CMS for violations of federal nursing home regulations.
1 penalty in the past 3 years
Nov 21, 2024 · $9K
Last updated: Jan 2026
These measures show how residents usually do over time at this home, based on health outcomes and preventive care.
Virginia average: 10.1
Virginia average: 19.7
Virginia average: 16.8%
Virginia average: 19.7%
Virginia average: 22.6%
Virginia average: 3.6%
Virginia average: 5.4%
Virginia average: 1.5%
Virginia average: 5.9%
Virginia average: 14.9%
Virginia average: 12.9%
Virginia average: 91.3%
Virginia average: 94.0%
Virginia average: 1.46
Virginia average: 1.41
Virginia average: 74.9%
Virginia average: 1.2%
Virginia average: 73.6%
Virginia average: 22.0%
Virginia average: 11.7%
Virginia average: 0.8%
Virginia average: 53.7%
Virginia average: 50.6%
Quality measures are calculated from Minimum Data Set (MDS) assessments. For most measures, lower percentages indicate better care quality.
29% of new residents, usually for short-term rehab.
68% of new residents, often for short stays.
3% of new residents, often for long-term daily care.
Source: CMS Long-Term Care Facility Characteristics (Data as of Jan 2026)
Residents meet regularly to discuss policies, care quality, and activities
Organized group of residents that meets regularly to discuss facility policies, quality of life, and activities.
Data sourced from CMS Long-Term Care Facility Characteristics quarterly report. Payer mix reflects the current resident census by primary payment source.
Historical financial and operational data for Westport Rehabilitation and Nursing Center from 2011–2024, based on CMS SNF Cost Reports.
Key figures below are for fiscal year ending in 03/2024.
Based on CMS SNF Cost Report for fiscal year ending in 03/2024.
Residents typically stay for brief periods, with frequent admissions and discharges throughout the year.
Most new residents arrive under private pay (68% of admissions), and a typical private pay stay runs around 3 - 4 months.
Coverage residents most often arrive under.
Coverage residents most often leave under.
![]() 7.0 miles from city center
7.0 miles from city center
![]() Estimated distance in miles from Richmond's city center to Westport Rehabilitation and Nursing Center's address, calculated via Google Maps.
— 0.41 miles to nearest hospital (Henrico Doctors' Hospital)
Estimated distance in miles from Richmond's city center to Westport Rehabilitation and Nursing Center's address, calculated via Google Maps.
— 0.41 miles to nearest hospital (Henrico Doctors' Hospital)
Add your location
Info below is compiled from CMS reports & the VA Depts. of Social Services & Health, senior community websites & trusted data sources such as Walk Score & BBB.
Communities are listed from highest to lowest based on our ranking methodology.
| Our Lady of Hope Health Center | NH AL MC SNF | Richmond | 97
Facility
97
VA AVG
96
Rank
#160 / 365 |
69.1%
Facility
69.1%
VA AVG
70.5
Rank
#174 / 297 | -2% | 3.99
Facility
3.99
VA AVG
3.74
Rank
#36 / 71 | -59% | +7% | $0
Facility
$0
VA AVG
$54.3k
Rank
#1 / 75 | 31
Facility
31
VA AVG
38.4
Rank
#41 / 70 | 6.2
Facility
6.2
VA AVG
8.9
Rank
#28 / 70 | - | 67 | - |
27
Facility
27
VA AVG
44
Rank
#325 / 446 | Francis Dilorenzo | $18.7MFiscal year ending 06/2024
Facility
$18.7MFiscal year ending 06/2024
VA AVG
$18.3M
Rank
#45 / 71 | $8.4MFiscal year ending 06/2024
Facility
$8.4MFiscal year ending 06/2024
VA AVG
$6.9M
Rank
#36 / 71 | 45%Fiscal year ending 06/2024
Facility
45%Fiscal year ending 06/2024
VA AVG
39.7%
Rank
#31 / 71 | 495311 | ||||
| Lakewood Retirement | NH AL IL MC SNF | Richmond (Henrico) | 74
Facility
74
VA AVG
96
Rank
#231 / 365 |
71.6%
Facility
71.6%
VA AVG
70.5
Rank
#153 / 297 | +2% | 4.81
Facility
4.81
VA AVG
3.74
Rank
#23 / 71 | -48% | +29% | $0
Facility
$0
VA AVG
$54.3k
Rank
#1 / 75 | 22
Facility
22
VA AVG
38.4
Rank
#31 / 70 | 7.3
Facility
7.3
VA AVG
8.9
Rank
#34 / 70 | 1 | 53 | - |
8
Facility
8
VA AVG
44
Rank
#411 / 446 | Heather Rusnak | $39.0MFiscal year ending 12/2023
Facility
$39.0MFiscal year ending 12/2023
VA AVG
$18.3M
Rank
#11 / 71 | $15.3MFiscal year ending 12/2023
Facility
$15.3MFiscal year ending 12/2023
VA AVG
$6.9M
Rank
#13 / 71 | 39.3%Fiscal year ending 12/2023
Facility
39.3%Fiscal year ending 12/2023
VA AVG
39.7%
Rank
#46 / 71 | 495403 | ||||
| Southampton Rehabilitation and Healthcare Center | NH HOS PC RC SNF | Richmond (Oxford) | 195
Facility
195
VA AVG
96
Rank
#21 / 365 |
91.4%
Facility
91.4%
VA AVG
70.5
Rank
#39 / 297 | +30% | 2.94
Facility
2.94
VA AVG
3.74
Rank
#67 / 71 | -5% | -22% | $39.0k
Facility
$39.0k
VA AVG
$54.3k
Rank
#72 / 75 | 51
Facility
51
VA AVG
38.4
Rank
#58 / 70 | 8.5
Facility
8.5
VA AVG
8.9
Rank
#41 / 70 | 2 | 178 | - |
55
Facility
55
VA AVG
44
Rank
#149 / 446 | Raven Powell | $21.8MFiscal year ending 06/2024
Facility
$21.8MFiscal year ending 06/2024
VA AVG
$18.3M
Rank
#41 / 71 | $8.1MFiscal year ending 06/2024
Facility
$8.1MFiscal year ending 06/2024
VA AVG
$6.9M
Rank
#42 / 71 | 37.3%Fiscal year ending 06/2024
Facility
37.3%Fiscal year ending 06/2024
VA AVG
39.7%
Rank
#55 / 71 | 495423 | ||||
| Westport Rehabilitation and Nursing Center | NH SNF | Richmond | 225
Facility
225
VA AVG
96
Rank
#9 / 365 |
84.0%
Facility
84.0%
VA AVG
70.5
Rank
#77 / 297 | +19% | 3.02
Facility
3.02
VA AVG
3.74
Rank
#62 / 71 | -21% | -19% | $63.7k
Facility
$63.7k
VA AVG
$54.3k
Rank
#73 / 75 | 139
Facility
139
VA AVG
38.4
Rank
#70 / 70 | 10.7
Facility
10.7
VA AVG
8.9
Rank
#47 / 70 | 3 | 189 | - |
28
Facility
28
VA AVG
44
Rank
#319 / 446 | - | $31.6MFiscal year ending 03/2024
Facility
$31.6MFiscal year ending 03/2024
VA AVG
$18.3M
Rank
#16 / 71 | $16.5MFiscal year ending 03/2024
Facility
$16.5MFiscal year ending 03/2024
VA AVG
$6.9M
Rank
#15 / 71 | 52.2%Fiscal year ending 03/2024
Facility
52.2%Fiscal year ending 03/2024
VA AVG
39.7%
Rank
#35 / 71 | 495227 |
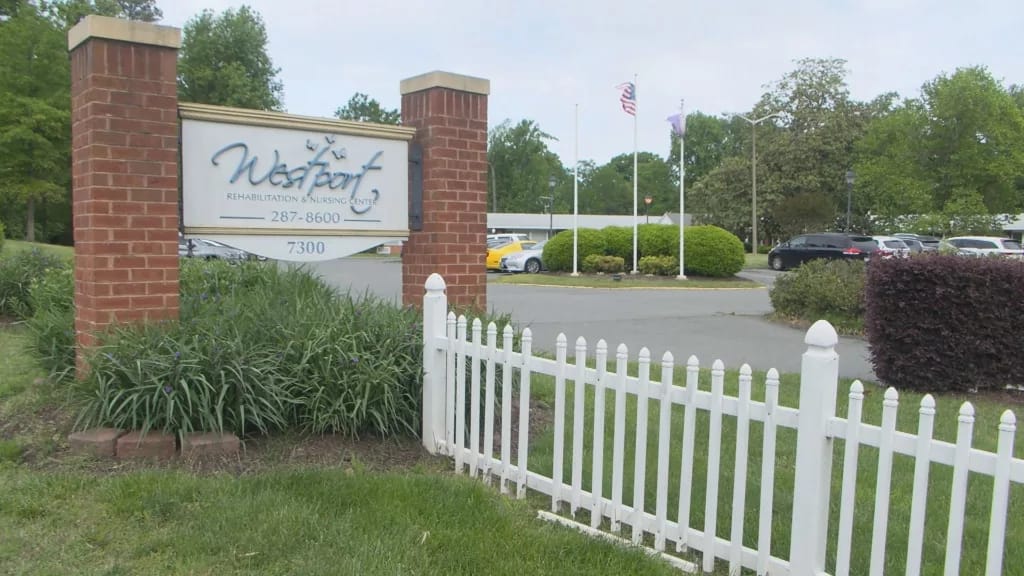
Westport Rehabilitation and Nursing Center is located in Richmond, Virginia.
Here are the financial assistance programs available to residents in Virginia.
Westport Rehabilitation and Nursing Center has a walk score of 28. Somewhat walkable. A few nearby services may be reachable on foot, but most trips require transportation.
Westport Rehabilitation and Nursing Center's occupancy is 91.1%.
No, Westport Rehabilitation and Nursing Center has a no-pet policy.
Westport Rehabilitation and Nursing Center is registered as a for-profit.
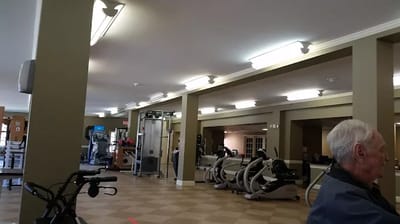
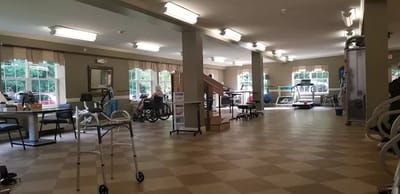
Yes — there are 5 photos of Westport Rehabilitation and Nursing Center in the photo gallery on this page.
Westport Rehabilitation and Nursing Center is located at 7300 Forest Ave, Richmond, VA 23226.
(804) 287-8600 will put you in contact with the team at Westport Rehabilitation and Nursing Center.
Care Cost Calculator: See Prices in Your Area
Nursing Home Data Explorer
Don’t Wait Too Long: 7 Red Flag Signs Your Parent Needs Assisted Living Now
The True Cost of Assisted Living in 2025 – And How Families Are Paying For It
Understanding Senior Living Costs: Pricing Models, Discounts & Financial Assistance


