Westwood Specialty Care
CMS overall rating Info CMS (the Centers for Medicare & Medicaid Services) is the federal agency that rates nursing home quality. Its Overall Rating runs from 1 to 5 stars, combining health inspections, staffing, and quality measures, with inspections weighted most heavily.

Westwood Specialty Care

CMS overall rating Info CMS (the Centers for Medicare & Medicaid Services) is the federal agency that rates nursing home quality. Its Overall Rating runs from 1 to 5 stars, combining health inspections, staffing, and quality measures, with inspections weighted most heavily.
Calculator: See prices in your area
Westwood Specialty Care accepts Medicare, Medicaid, and private pay.

Overview of Westwood Specialty Care

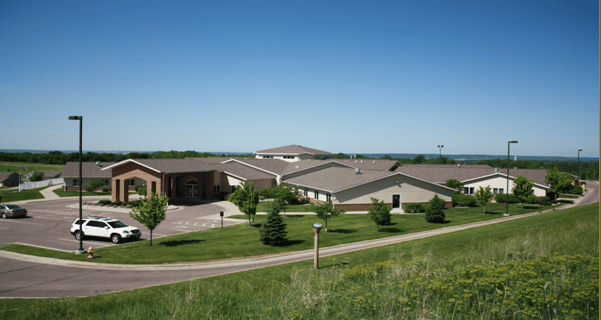
Welcome to Westwood Specialty Care, an 85-bed skilled nursing facility offering rehabilitation services, skilled nursing care, long-term care, and hospice care. As a part of Care Initiatives, Iowa’s largest not-for-profit skilled nursing and long-term care provider, Westwood Specialty Care is deeply committed to delivering exceptional care to its residents. Dedicated to providing dignified and customized care for diverse needs, Westwood Specialty Care extends its care to the well-being of families as well. 
At Westwood Specialty Care, they welcome Medicare and Medicaid beneficiaries and are proud to be a contracted provider for the Veterans Affairs Community Nursing Home Program, ensuring that a wide range of seniors can access their compassionate transitional health care services. Their dedication to compassion and excellence has been acknowledged by the American Health Care Association with the 2018 Bronze Award, showcasing their commitment to outstanding care. Experience the warmth and care at Westwood Specialty Care, where they strive to meet the unique needs of every individual they serve. 

(712) 258-0135

Quality ratings

Measured by Centers for Medicare & Medicaid Services (CMS)

Overall rating Info The Overall CMS Rating combines results from health inspections, staffing levels and quality measures. Health inspections carry the most weight. Staffing and quality scores can increase or decrease the final rating based on performance compared to state and national standards.
▼ 67.4% Below IA avg. ▼ 67.4% Below IA avg.IA average: 3.1Click the badge to see the full State ranking.Click here to see the full State ranking.
Health Inspection Info Based on the results of the facility's three most recent standard inspections and any complaint investigations. CMS reviews the number, scope, and severity of deficiencies, with more recent findings weighted more heavily.
▼ 64.9% Below IA avg. ▼ 64.9% Below IA avg.IA average: 2.9Click the badge to see the full State ranking.Click here to see the full State ranking.
Staffing Info Measures average nursing staff hours per resident per day, including Registered Nurses (RNs) and total nursing staff. Ratings are adjusted based on the level of care residents require and are compared to state and national benchmarks.
▼ 15.4% Below IA avg. ▼ 15.4% Below IA avg.IA average: 3.5Click the badge to see the full State ranking.Click here to see the full State ranking.
Quality Measures Info Based on clinical and physical health indicators reported to CMS, such as hospital readmissions, falls, pressure ulcers, and improvements in mobility. These measures reflect how well residents' health needs are being managed.
▼ 8.4% Below IA avg. ▼ 8.4% Below IA avg.IA average: 3.3Click the badge to see the full State ranking.Click here to see the full State ranking.

Staffing hours breakdown

Info Daily nursing hours per resident by staff type, reported to CMS. Higher is generally better — compare this facility to state and national averages to see where staffing stands.

Hours per resident per day — compared to Iowa state averages

Total nursing care / resident Info This home is ranked 207th out of 249 homes in Iowa for nurse hours. Total adjusted nursing hours per resident per day, combining RN, LPN, and aide time. CMS adjusts this for case-mix so facilities can be fairly compared.
3h 34m per day
Rank #207 / 249Nurse hours — State benchmarkedThis home is ranked 207th out of 249 homes in Iowa. Shows adjusted nurse hours per resident per day benchmarked to the Iowa average, with a ranking across 249 Iowa facilities. More hours mean more direct care. The national average is about 3.5 hrs; below 3.0 is a red flag.Rankings are based only on facilities in Iowa that report data for that category. Facilities without available data are excluded from the ranking.Click the rank badge to see the full State ranking.Click here to see the full State ranking.
This facility Iowa avg (4h 18m per day)
vs Iowa avg
-17%

5 of 6 metrics below state avg

Standout metric Physical Therapist is +58% above state avg
Staff typeHours / Day / Residentvs state avg
Registered Nurse (RN) Info RNs hold the highest nursing license and can assess residents, interpret test results, and direct care plans. More RN hours per day often signals stronger clinical oversight and faster response to health changes. 42m per day ▼ 5% State avg: 44m per day · National avg: 41m per day
LPN / LVN Info Licensed Practical Nurses (LPNs) or Licensed Vocational Nurses (LVNs) deliver routine hands-on care — medication administration, wound dressing, and monitoring vital signs. They work under RN supervision and make up a large share of daily bedside care. 28m per day ▼ 17% State avg: 34m per day · National avg: 52m per day
Nurse Aide Info Certified Nurse Aides (CNAs) provide the most direct day-to-day assistance: bathing, dressing, feeding, and mobility. Nurse aide hours are typically the largest staffing category and directly affect residents' quality of life. 2h 0m per day ▼ 20% State avg: 2h 30m per day · National avg: 2h 20m per day
Weekend Total Nursing Info Combined nursing hours (RN + LPN + Nurse Aide) per resident per day on weekends. Staffing often drops on weekends — this figure reveals whether the facility maintains adequate coverage outside of weekday hours. 2h 41m per day ▼ 20% State avg: 3h 23m per day · National avg: 3h 27m per day
Physical Therapist Info Hours per resident per day provided by licensed Physical Therapists (PTs) or PT Assistants. PT services help residents recover mobility after injury or illness and are especially important for post-acute (short-stay) rehabilitation. 3m per day ▲ 58% State avg: 2m per day · National avg: 4m per day
Weekend RN Info Registered nurse hours specifically on weekends. Facilities sometimes reduce RN presence on Saturdays and Sundays — a low weekend RN figure compared to weekday hours can indicate reduced clinical oversight when most administrative staff are absent. 24m per day ▼ 20% State avg: 30m per day · National avg: 29m per day

Capacity and availability

This home usually has limited availability

Higher occupancy than the Iowa average: 75.4%
Occupancy rate
92% Rank #49 / 407Occupancy rate — State benchmarkedThis home is ranked 49th out of 407 homes in Iowa. Shows this facility's occupancy rate versus the Iowa average, with its Statewide rank out of 407. Higher occupancy signals strong local demand and financial stability.Rankings are based only on facilities in Iowa that report data for that category. Facilities without available data are excluded from the ranking.Click the rank badge to see the full State ranking.Click here to see the full State ranking.
Avg. Length of Stay
141 days
Bed community size
85-bed community Rank #97 / 407Bed count — State benchmarkedThis home is ranked 97th out of 407 homes in Iowa. Shows this facility's certified or reported bed count compared to other Iowa facilities. Larger communities may offer more amenities, programs, and on-site services for residents and families.Rankings are based only on facilities in Iowa that report data for that category. Facilities without available data are excluded from the ranking.Click the rank badge to see the full State ranking.Click here to see the full State ranking.
A larger shared setting that may offer more common spaces and organized community services.
Walk Score
Walk Score: 9 / 100 Rank #470 / 528Walk Score — State benchmarkedThis home is ranked 470th out of 528 homes in Iowa. Shows how walkable this facility's neighborhood is compared to the average Walk Score across Iowa facilities. Higher scores benefit residents, families, and staff.Rankings are based only on facilities in Iowa that report data for that category. Facilities without available data are excluded from the ranking.Click the rank badge to see the full State ranking.Click here to see the full State ranking.
Car-dependent. Most errands require a car, with limited nearby walkable options.

Therapy & Rehabilitation

2 services
Rehabilitation Services
Short-Term Rehab

Staffing & Medical

1 service
24-Hour Staffing

Amenities & Lifestyle

Operating Hours24 hours a day, seven days a week

Contact Westwood Specialty Care

Staffing Data

Reporting period: October 1 – December 31, 2025 (Q4 2025). Source: CMS Payroll-Based Journal report.

Total staff 127
Employees 100
Contractors 27
Staff to resident ratio 1.55 : 1
24% fewer staff per resident than Iowa average
Iowa average ratio: 2.05 : 1 Iowa average ratio: 2.05 : 1See full Iowa ranking
Avg staff/day 38
Average shift 7.7 hours
0% compared with Iowa average
Iowa average: 7.4 hours Iowa average shift: 7.4 hoursSee full Iowa ranking
Total staff hours (quarter) 27,023

Nursing staff breakdown

Q4 2025 · Oct 1 – Dec 31 More info This data comes from the CMS Payroll-Based Journal report covering October 1 – December 31, 2025.
Registered Nurse

Manages medical care and health needs.

RN Staff Info All 12 RN Staff are full-time employees. No contractors work on this role. 12
Average shift length Info Average shift length. Calculated as total hours divided by days worked and average staff per day. 9.3 hours
Licensed Practical Nurse

Assists with medical care and medications.

LPN Staff Info All 11 LPN Staff are full-time employees. No contractors work on this role. 11
Average shift length Info Average shift length. Calculated as total hours divided by days worked and average staff per day. 9.5 hours
Certified Nursing Assistant

Helps with daily care and mobility.

CNA Staff Info All 49 CNA Staff are full-time employees. No contractors work on this role. 49
Average shift length Info Average shift length. Calculated as total hours divided by days worked and average staff per day. 7.8 hours

Contractor staffing

Q4 2025 · Oct 1 – Dec 31 More info This data comes from the CMS Payroll-Based Journal report covering October 1 – December 31, 2025.

Total hours from contractors

8.9%

2,399 contractor hours this quarter

Speech Language Pathologist: 8 Physical Therapy Assistant: 8 Physical Therapy Aide: 5 Respiratory Therapy Technician: 3 Qualified Social Worker: 2 Medical Director: 1

Staff by category

Q4 2025 · Oct 1 – Dec 31 More info This data comes from the CMS Payroll-Based Journal report covering October 1 – December 31, 2025.
Certified Nursing Assistant4904912,89392100%7.8
Registered Nurse120122,98292100%9.3
Licensed Practical Nurse110112,96292100%9.5
Clinical Nurse Specialist7071,6228491%7.4
Medication Aide/Technician7071,4838390%8.2
Speech Language Pathologist0889857076%5.9
Administrator2025126368%8
Mental Health Service Worker1014786267%7.7
Physical Therapy Aide0554666470%5.6
Dietitian1014626672%7
Nurse Practitioner5054565358%8
Physical Therapy Assistant0884496368%4.9
Respiratory Therapy Technician0334195762%6.9
RN Director of Nursing2023986773%5.3
Other Dietary Services Staff2023675863%6.2
Medical Director0114533%15
Qualified Social Worker022364347%0.8
Occupational Therapy Aide101933%3.1
49 Certified Nursing Assistant
% of Days 100%
12 Registered Nurse
% of Days 100%
11 Licensed Practical Nurse
% of Days 100%
7 Clinical Nurse Specialist
% of Days 91%
7 Medication Aide/Technician
% of Days 90%
8 Speech Language Pathologist
% of Days 76%
2 Administrator
% of Days 68%
1 Mental Health Service Worker
% of Days 67%
5 Physical Therapy Aide
% of Days 70%
1 Dietitian
% of Days 72%
5 Nurse Practitioner
% of Days 58%
8 Physical Therapy Assistant
% of Days 68%
3 Respiratory Therapy Technician
% of Days 62%
2 RN Director of Nursing
% of Days 73%
2 Other Dietary Services Staff
% of Days 63%
1 Medical Director
% of Days 3%
2 Qualified Social Worker
% of Days 47%
1 Occupational Therapy Aide
% of Days 3%

Penalties and fines

Includes penalties issued in 2024

Federal penalties imposed by CMS for regulatory violations, including civil money penalties (fines) and denials of payment for new Medicare/Medicaid admissions.

Source: CMS Penalties Database (Data as of Jan 2026)

Total fines amount $263K Rank #249 / 255Federal fines — State benchmarkedThis home is ranked 249th out of 255 homes in Iowa. Shows this facility's cumulative CMS federal fine dollars versus the Iowa average among facilities with fines, and where it ranks among 255 facilities in the pool. Lower total dollars mean a better rank.Rankings are based only on facilities in Iowa that report data for that category. Facilities without available data are excluded from the ranking.Click the rank badge to see the full State ranking.Click here to see the full State ranking.
448% higher than Iowa average

Iowa average: $48K

Number of fines 2
18% more fines than Iowa average

Iowa average: 1.7

Payment Denials Info Serious action where Medicare and/or Medicaid temporarily stops payments for new residents until issues are fixed. 1
88% more payment denials than Iowa average

Iowa average: 0.5

Fines amount comparison
This facility $263K
Iowa average $48K
Penalty History

Penalties are imposed by CMS for violations of federal nursing home regulations.

2 penalties in the past 3 years

Multiple penalties were reported in the last 3 years.

Civil Money Penalty Info Fines imposed for noncompliance, which can be assessed per day or per instance of violation. Feb 28, 2024
$167K
Payment Denial Info Serious action where Medicare and/or Medicaid temporarily stops payments for new residents until issues are fixed. Feb 28, 2024
48 days

Last updated: Jan 2026

Quality of care over time

These measures show how residents usually do over time at this home, based on health outcomes and preventive care.

High-risk clinical events score Info A composite score based on pressure ulcers, falls with injury, weight loss, walking ability decline, and activities of daily living decline. 11.6
13% worse than Iowa average

Iowa average: 10.2

Functional decline score Info A composite score based on activities of daily living decline, walking ability decline, and incontinence. 24.2
12% worse than Iowa average

Iowa average: 21.6

Long-stay resident measures
Need for Help with Daily Activities Increased Info Percent of long-stay residents whose need for help with daily activities has increased 17.7%
6% better than Iowa average

Iowa average: 18.8%

Walking Ability Worsened Info Percent of long-stay residents whose ability to move independently worsened 27.9%
42% worse than Iowa average

Iowa average: 19.7%

Low Risk Residents with Bowel/Bladder Incontinence Info Percent of low risk long-stay residents who lose control of their bowels or bladder 27.2%
In line with Iowa average

Iowa average: 26.2%

Falls with Major Injury Info Percent of long-stay residents experiencing one or more falls with major injury 2.7%
27% better than Iowa average

Iowa average: 3.6%

High Risk Residents with Pressure Ulcers Info Percent of long-stay high risk residents with pressure ulcers 4.1%
6% better than Iowa average

Iowa average: 4.4%

Urinary Tract Infection Info Percent of long-stay residents with a urinary tract infection 1.2%
54% better than Iowa average

Iowa average: 2.5%

Lost Too Much Weight Info Percent of long-stay residents who lose too much weight 5.7%
15% worse than Iowa average

Iowa average: 5.0%

Depressive Symptoms Info Percent of long-stay residents who have depressive symptoms 2.1%
46% better than Iowa average

Iowa average: 3.9%

Antipsychotic Use Info Percent of long-stay residents who received an antipsychotic medication 17.8%
7% better than Iowa average

Iowa average: 19.0%

Pneumococcal Vaccine Info Percent of long-stay residents assessed and appropriately given the pneumococcal vaccine 97.7%
In line with Iowa average

Iowa average: 94.4%

Influenza Vaccine Info Percent of long-stay residents assessed and appropriately given the seasonal influenza vaccine 94.9%
In line with Iowa average

Iowa average: 95.3%

Short-stay resident measures
Pneumococcal Vaccine Info Percent of short-stay residents assessed and appropriately given the pneumococcal vaccine 83.4%
In line with Iowa average

Iowa average: 85.1%

Antipsychotic medication increase Info Percent of short-stay residents who newly received an antipsychotic medication 1.7%
9% better than Iowa average

Iowa average: 1.8%

Influenza Vaccine Info Percent of short-stay residents assessed and appropriately given the seasonal influenza vaccine 62.4%
15% worse than Iowa average

Iowa average: 73.3%

Breakdown by payment type

Medicare

44% of new residents, usually for short-term rehab.

Typical stay 27 days

Private pay

51% of new residents, often for short stays.

Typical stay 3 - 4 months

Medicaid

5% of new residents, often for long-term daily care.

Typical stay 4 - 5 years

Facility Characteristics

Source: CMS Long-Term Care Facility Characteristics (Data as of Jan 2026)

Total residents 82
Medicare
17
20.7% of residents
Medicaid
50
61% of residents
Private pay or other
15
18.3% of residents
Programs & Services
Residents Group

Residents meet regularly to discuss policies, care quality, and activities

Active Resident Council

Organized group of residents that meets regularly to discuss facility policies, quality of life, and activities.

Finances and operations

Based on CMS SNF Cost Report for fiscal year ending in 12/2023.

Governmental community
Operated by a subsidized facility district.
Net patient revenue Info Net patient revenue — what the home actually collects for resident care, after contractual allowances, bad debt and discounts are subtracted from its gross charges (CMS cost report, Worksheet G-3). It covers resident care only; money the home earns from other sources is shown separately as "Other income."
$8.9M
Net patient income Info Net patient income: net patient revenue minus the home's total operating expenses. A positive figure means it earns more from resident care than it spends to deliver it; a negative figure means the opposite. It excludes non-operating "other income."
$800.3K
Governmental community Operated by a subsidized facility district.
Net patient revenue Info Net patient revenue — what the home actually collects for resident care, after contractual allowances, bad debt and discounts are subtracted from its gross charges (CMS cost report, Worksheet G-3). It covers resident care only; money the home earns from other sources is shown separately as "Other income."
$8.9M Rank #30 / 251Revenue — State benchmarkedThis home is ranked 30th out of 251 homes in Iowa. Shows this facility's annual revenue compared to the Iowa average. Higher revenue generally means more resources for staffing and capital — read alongside Payroll %.Rankings are based only on facilities in Iowa that report data for that category. Facilities without available data are excluded from the ranking.Click the rank badge to see the full State ranking.Click here to see the full State ranking.
Net patient income Info Net patient income: net patient revenue minus the home's total operating expenses. A positive figure means it earns more from resident care than it spends to deliver it; a negative figure means the opposite. It excludes non-operating "other income."
$800.3K
Other income Info Money the home earns outside of resident care — such as investments, grants, rentals and other non-operating sources (CMS cost report, Worksheet G-3). It is tracked separately from net patient revenue: it is not part of that figure, and it is not included in net patient income.
$44.3K
Payroll costs Info Staff salaries plus wage-related costs — benefits such as payroll taxes, health insurance and retirement — from the home's own accounting records (CMS cost report, Worksheet A). Contract or agency labor is counted separately, under other operating costs. Rank #81 / 251Payroll — State benchmarkedThis home is ranked 81st out of 251 homes in Iowa. Shows total annual staff payroll benchmarked to the Iowa average. Higher payroll investment relative to peers often signals better staffing and less reliance on cheaper contract labor.Rankings are based only on facilities in Iowa that report data for that category. Facilities without available data are excluded from the ranking.Click the rank badge to see the full State ranking.Click here to see the full State ranking.
$4.3M 48.4% of net patient revenue Info Payroll as a share of revenue: staff salaries and wage-related benefits divided by net patient revenue. A higher figure means more of each revenue dollar goes to staff pay. Rank #241 / 251Payroll % — State benchmarkedThis home is ranked 241st out of 251 homes in Iowa. Shows payroll as a percentage of revenue versus the Iowa average. Well-run Iowa facilities typically land around 61–69% — the top third Statewide. Below 25% may signal understaffing or heavy agency use — read with Staffing ratings.Rankings are based only on facilities in Iowa that report data for that category. Facilities without available data are excluded from the ranking.Click the rank badge to see the full State ranking.Click here to see the full State ranking.
Other operating costs Info Everything it costs to run the home apart from payroll — food, utilities, supplies, maintenance, contract labor and administration. Calculated as total operating expense minus payroll (staff salaries and wage-related benefits).
$3.8M
Total costs Info The home's total operating expense for the year — all the costs of running it, salaries included (CMS cost report, Worksheet G-3).
$8.1M

Who this home usually serves

TYPE OF STAY

Mix of rehab and long-term care

This home supports both short-term rehab and long-term care, with residents staying for a wide range of durations.

Most new residents arrive under private pay (51% of admissions), and a typical private pay stay runs around 3 - 4 months.

Admissions
199 total

Coverage residents most often arrive under.

Medicare 44%
Private pay 51%
Medicaid 5%
Discharges
203 total

Coverage residents most often leave under.

Medicare 43%
Private pay 51%
Medicaid 5%

Managed by Iden Ramey

Administrator

Compare Nursing Homes around Sioux City

The information below is reported by the Iowa Department of Inspections, Appeals, and Licensing.

4 facilities compared · CMS & IA Dept. of Health data

Sunrise Retirement Community
NH
AL
IL
MC
NC
RC
Sioux City
74
Facility 74
IA AVG 71
Rank #136 / 407
90.5%
Facility 90.5%
IA AVG 75.4%
Rank #60 / 407
+20%
6.19
Facility 6.19
IA AVG 4.30
Rank #3 / 249
-23%+44%
$0
Facility $0
IA AVG $53.4k
Rank #1 / 255
11
Facility 11
IA AVG 21.7
Rank #78 / 250
3.7
Facility 3.7
IA AVG 4.1
Rank #119 / 250
-68A+
22
Facility 22
IA AVG 45
Rank #411 / 528
Samantha Roth
$13.6M
Facility $13.6M
IA AVG $7.0M
Rank #25 / 251
$8.5M
Facility $8.5M
IA AVG $3.1M
Rank #19 / 251
62.2%
Facility 62.2%
IA AVG 46.3%
Rank #94 / 251
165473
Holy Spirit Retirement Home
NH
AL
IL
MC
NC
Sioux City
52
Facility 52
IA AVG 71
Rank #252 / 407
25.0%
Facility 25.0%
IA AVG 75.4%
Rank #386 / 407
-67%
3.96
Facility 3.96
IA AVG 4.30
Rank #148 / 249
-54%-8%
$0
Facility $0
IA AVG $53.4k
Rank #1 / 255
28
Facility 28
IA AVG 21.7
Rank #183 / 250
5.6
Facility 5.6
IA AVG 4.1
Rank #194 / 250
-13-
91
Facility 91
IA AVG 45
Rank #2 / 528
The Diocese Of Sioux City
$7.9M
Facility $7.9M
IA AVG $7.0M
Rank #68 / 251
$4.9M
Facility $4.9M
IA AVG $3.1M
Rank #79 / 251
62.4%
Facility 62.4%
IA AVG 46.3%
Rank #180 / 251
165266
Kingsley Specialty Care
NH
HC
Kingsley (West 3Rd Street)
43
Facility 43
IA AVG 71
Rank #315 / 407
72.1%
Facility 72.1%
IA AVG 75.4%
Rank #177 / 407
-4%
3.29
Facility 3.29
IA AVG 4.30
Rank #234 / 249
+67%-23%
$0
Facility $0
IA AVG $53.4k
Rank #1 / 255
31
Facility 31
IA AVG 21.7
Rank #190 / 250
7.8
Facility 7.8
IA AVG 4.1
Rank #234 / 250
-34-
21
Facility 21
IA AVG 45
Rank #415 / 528
Jackie Loghry Pirner
$3.5M
Facility $3.5M
IA AVG $7.0M
Rank #158 / 251
$1.9M
Facility $1.9M
IA AVG $3.1M
Rank #214 / 251
55.3%
Facility 55.3%
IA AVG 46.3%
Rank #228 / 251
165329
Westwood Specialty Care
NH
Sioux City
85
Facility 85
IA AVG 71
Rank #97 / 407
92.0%
Facility 92.0%
IA AVG 75.4%
Rank #49 / 407
+22%
3.57
Facility 3.57
IA AVG 4.30
Rank #207 / 249
-19%-17%
$166.7k
Facility $166.7k
IA AVG $53.4k
Rank #249 / 255
91
Facility 91
IA AVG 21.7
Rank #249 / 250
11.4
Facility 11.4
IA AVG 4.1
Rank #243 / 250
378-
9
Facility 9
IA AVG 45
Rank #470 / 528
Michael Jurgens
$8.9M
Facility $8.9M
IA AVG $7.0M
Rank #30 / 251
$4.3M
Facility $4.3M
IA AVG $3.1M
Rank #81 / 251
48.4%
Facility 48.4%
IA AVG 46.3%
Rank #241 / 251
165271

Financial Assistance for
Nursing Home in Iowa

Westwood Specialty Care is located in Sioux City, Iowa.
Here are the financial assistance programs available to residents in Iowa.

Get Financial aid guidance

Elderly Waiver

Iowa Medicaid Elderly Waiver

Age 65+
General Iowa resident, Medicaid-eligible, nursing home-level care need.
Income Limits (2025) ~$2,829/month 300% FBR, individual
Asset Limits $2,000 (individual), $3,000 (couple).
IA

Rural focus; waitlists possible.

Benefits
In-home care (5-7 hours/day) Meals ($6/meal) Respite (240 hours/year) Adult day care ($60/day)

Iowa Family Caregiver Support

IA NFCSP

Age Caregiver of someone 60+
General Iowa resident.
Income Limits No strict limit; prioritizes low-income.
Asset Limits Not applicable.
IA

Limited slots; rural emphasis.

Benefits
In-home respite (4-6 hours/day) Adult day care (~$60/day) Short-term facility care (up to 5 days)

Medicare Savings Program (MSP)

Iowa Medicare Savings Program

Age 65+ or disabled
General Iowa resident, Medicare Part A/B.
Income Limits (2025) ~$2,510/month (QMB), ~$3,380/month (SLMB), ~$3,598/month (QI)—individual.
Asset Limits $9,430 (individual), $14,130 (couple).
IA

Three tiers; no waitlist.

Benefits
Covers Part B premiums ($174.70/month) Deductibles ($240/year) Copays (~20%)

Program of All-Inclusive Care for the Elderly (PACE)

Iowa PACE

Age 55+
General Iowa resident, nursing home-level care need, safe with PACE support.
Income Limits (2025) ~$2,829/month 300% FBR, Medicaid-eligible
Asset Limits $2,000 (individual), $3,000 (couple).
IA

Limited to western Iowa (e.g., Council Bluffs); expanding slowly.

Benefits
Personal care (5-7 hours/day) Medical care Meals Transportation Therapy Respite

VA Aid and Attendance (A&A) and Housebound Benefits

Iowa VA Aid and Attendance/Housebound

Age 65+ or disabled veteran/spouse
General Iowa resident, wartime service, need for ADL help (A&A) or homebound.
Income Limits (2025) Net income < ~$1,984/month (veteran with dependent, A&A); pension offsets income.
Asset Limits ~$155,356 net worth limit
IA

High veteran demand in rural areas.

Benefits
Cash (~$1,433-$2,642/month veteran, ~$951-$1,318 spouse) for care costs (e.g., in-home, assisted living)

Able Up Iowa

Able Up Iowa

Age 65+ or disabled
General Iowa resident, ability to repay loan, need for assistive tech or mods.
Income Limits (2025) No strict limit; must demonstrate repayment capacity.
Asset Limits Not specified; credit-based.
IA

Loans up to $25,000; statewide via Easterseals partnership.

Benefits
Loans for wheelchairs Ramps Walk-in tubs (~$500-$10,000 avg.) Reducing reliance on paid care

Frequently Asked Questions about Westwood Specialty Care

Is Westwood Specialty Care in a walkable area?

Westwood Specialty Care has a walk score of 9. Car-dependent. Most errands require a car, with limited nearby walkable options.

What is the occupancy rate at Westwood Specialty Care?

Westwood Specialty Care's occupancy is 92.0%.

Are there photos of Westwood Specialty Care?

Yes — there are 3 photos of Westwood Specialty Care in the photo gallery on this page.

What is the phone number of Westwood Specialty Care?

(712) 258-0135 will put you in contact with the team at Westwood Specialty Care.

Is Westwood Specialty Care Medicare or Medicaid certified?

Yes — Westwood Specialty Care is a CMS-certified provider of Medicare and Medicaid.

Guides for Better Senior Living

Care Cost Calculator: See Prices in Your Area

Nursing Home Data Explorer

Don’t Wait Too Long: 7 Red Flag Signs Your Parent Needs Assisted Living Now

The True Cost of Assisted Living in 2025 – And How Families Are Paying For It

Understanding Senior Living Costs: Pricing Models, Discounts & Financial Assistance