Wheatridge Care Center

Nursing Home, Skilled Nursing, Respite Care & Hospice Care · Jefferson County, CO
CMS overall rating Info The Overall CMS Rating is scored from 1 to 5 stars and combines results from health inspections, staffing levels, and quality measures. Health inspections carry the most weight. Staffing and quality scores can increase or decrease the final rating based on performance compared to state and national standards.
Wheatridge Care Center
Nursing Home, Skilled Nursing, Respite Care & Hospice Care · Jefferson County, CO
CMS overall rating Info The Overall CMS Rating is scored from 1 to 5 stars and combines results from health inspections, staffing levels, and quality measures. Health inspections carry the most weight. Staffing and quality scores can increase or decrease the final rating based on performance compared to state and national standards.
Calculator: See prices in your area
Wheatridge Care Center accepts Medicare, Medicaid, and private pay.

Overview of Wheatridge Care Center

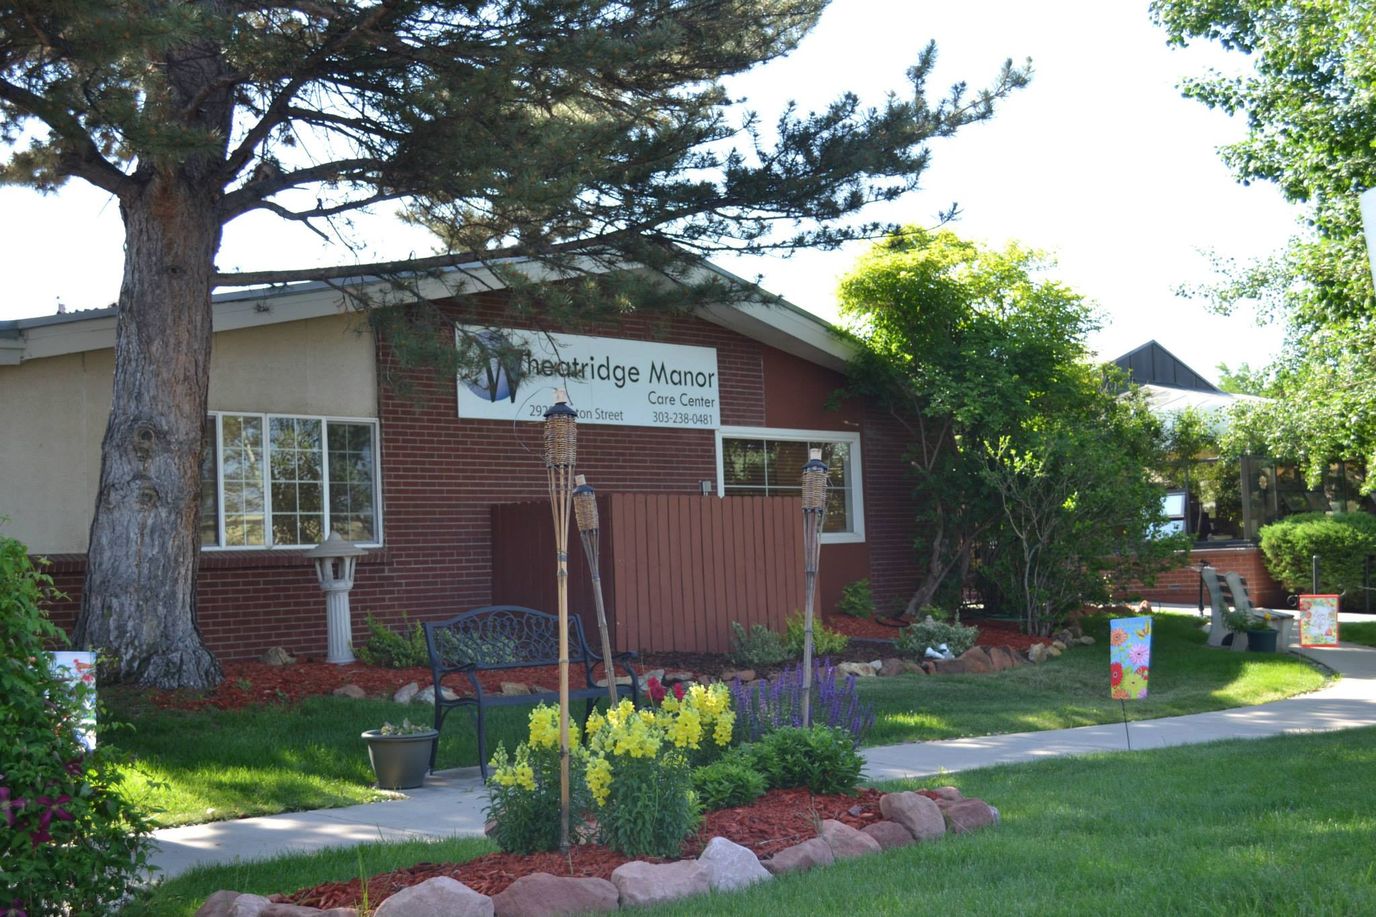
Wheatridge Care Center is a family-owned nursing home in Wheat Ridge, CO, that focuses on rehabilitation and skilled nursing. Promoting a compassionate and supportive environment, the community ensures older adults feel at ease during their stay. Therapy services, pain management, and an on-site physician are among the exceptional services provided to improve residents’ quality of life. The community also prioritizes residents’ holistic wellness, ensuring they receive the utmost attention and care.

Physical, occupational, and speech therapy help residents recover and return to their routines with ease. State-of-the-art rehabilitation equipment and accessible communal areas also ensure residents can rest without hassles. With its ideal location in the peaceful residential area of Wheat Ridge, residents have convenient access to their necessities and leisure. This nursing home is a great choice for senior living in Colorado, as it has high standards of care.

(303) 238-0481

Quality ratings

Measured by Centers for Medicare & Medicaid Services (CMS)

Overall rating Info The Overall CMS Rating combines results from health inspections, staffing levels and quality measures. Health inspections carry the most weight. Staffing and quality scores can increase or decrease the final rating based on performance compared to state and national standards.
▼ 4.6% Below CO avg.
Health Inspection Info Based on the results of the facility's three most recent standard inspections and any complaint investigations. CMS reviews the number, scope, and severity of deficiencies, with more recent findings weighted more heavily.
▼ 27.8% Below CO avg.
Staffing Info Measures average nursing staff hours per resident per day, including Registered Nurses (RNs) and total nursing staff. Ratings are adjusted based on the level of care residents require and are compared to state and national benchmarks.
▼ 34.2% Below CO avg.
Quality Measures Info Based on clinical and physical health indicators reported to CMS, such as hospital readmissions, falls, pressure ulcers, and improvements in mobility. These measures reflect how well residents' health needs are being managed.
▲ 20.5% Above CO avg.

Staffing hours breakdown

Info Daily nursing hours per resident by staff type, reported to CMS. Higher is generally better — compare this facility to state and national averages to see where staffing stands.

Hours per resident per day — compared to Colorado state averages

Total nursing care / resident Info Total adjusted nursing hours per resident per day, combining RN, LPN, and aide time. CMS adjusts this for case-mix so facilities can be fairly compared.
3h 27m per day
This facility Colorado avg (3h 52m per day)
vs Colorado avg
-11%

5 of 6 metrics below state avg

Staff typeHours / dayvs state avg
Registered Nurse (RN) Info RNs hold the highest nursing license and can assess residents, interpret test results, and direct care plans. More RN hours per day often signals stronger clinical oversight and faster response to health changes. 36m per day ▼ 28% State avg: 50m per day · National avg: 41m per day
LPN / LVN Info Licensed Practical Nurses (LPNs) or Licensed Vocational Nurses (LVNs) deliver routine hands-on care — medication administration, wound dressing, and monitoring vital signs. They work under RN supervision and make up a large share of daily bedside care. 42m per day ■ Avg State avg: 41m per day · National avg: 52m per day
Nurse Aide Info Certified Nurse Aides (CNAs) provide the most direct day-to-day assistance: bathing, dressing, feeding, and mobility. Nurse aide hours are typically the largest staffing category and directly affect residents' quality of life. 1h 57m per day ▼ 12% State avg: 2h 13m per day · National avg: 2h 21m per day
Total Nursing (Weekend) Info Combined nursing hours (RN + LPN + Nurse Aide) per resident per day on weekends. Staffing often drops on weekends — this figure reveals whether the facility maintains adequate coverage outside of weekday hours. 2h 51m per day ▼ 13% State avg: 3h 17m per day · National avg: 3h 26m per day
Physical Therapist Info Hours per resident per day provided by licensed Physical Therapists (PTs) or PT Assistants. PT services help residents recover mobility after injury or illness and are especially important for post-acute (short-stay) rehabilitation. 2m per day ▼ 60% State avg: 5m per day · National avg: 4m per day
RN (Weekend) Info Registered nurse hours specifically on weekends. Facilities sometimes reduce RN presence on Saturdays and Sundays — a low weekend RN figure compared to weekday hours can indicate reduced clinical oversight when most administrative staff are absent. 28m per day ▼ 22% State avg: 36m per day · National avg: 29m per day

Capacity and availability

This home usually has limited availability

Occupancy between 85% and 95% suggests balanced demand.

Higher occupancy than the Colorado average: 76.5%
Occupancy rate 91%
Avg. Length of Stay 108 days
Occupancy rate
91%
Avg. Length of Stay
108 days

Who this home usually serves

TYPE OF STAY

Primarily short stays

Residents typically stay for brief periods, with frequent admissions and discharges throughout the year.

Breakdown by payment type

Medicare

14% of new residents, usually for short-term rehab.

Typical stay 26 days

Private pay

72% of new residents, often for short stays.

Typical stay 1 months

Medicaid

14% of new residents, often for long-term daily care.

Typical stay 1 - 2 years

Finances and operations

Privately-owned community
Operated by a business corporation.
Home revenue
$8.4M
Operating loss
-$359.0K
Privately-owned community Operated by a business corporation.
Home revenue
$8.4M
Operating loss
-$359.0K
Payroll costs Info The portion of the home's budget spent on staff, including nurses, caregivers, and other employees who support care and operations.
$5.2M
61.3% of revenue
Other operating costs Info All remaining costs needed to run the home, such as food, utilities, building maintenance, supplies and administrative expenses.
$3.6M
Total costs $8.8M
Walk Score
Walk Score: 59 / 100
Moderately walkable. Some errands can be accomplished on foot, with a mix of nearby amenities.

What does this home offer?

Pets allowed icon
Pets allowed icon

Pets Allowed: Yes, Pets Allowed

Housing options icon

Housing Options: Private / Semi-Private Rooms

Building type icon
Building type icon

Building Type: Single-story

Dining services icon

Dining Services

Beauty services icon

Beauty Services

Transportation services icon

Transportation Services

Rehabilitative support icon

Rehabilitative Support

Social and recreational activities icon

Social and Recreational Activities

Types of Care at Wheatridge Care Center

Skilled Nursing Respite Care Hospice Care

Contact Wheatridge Care Center

Health Inspection History

Inspections
Total health inspections 5

Colorado average 4.8


Last Health inspection on Jun 2025

Total health citations
24

Colorado average 24.8

Citations per inspection
4.8

Colorado average 5.2


Health citations are formal notices following inspections when they fail to comply with safety and care standards.

21 of 24 citations resulted from standard inspections; and 3 of 24 resulted from complaint investigations.

Breakdown of citation severity (last 4 years)
Critical Health citations More info
1
150% worse than Colorado average

Colorado average: 0.4


Serious Health citations More info 1
52% better than Colorado average

Colorado average: 2.1

1 critical citation More info Colorado average: 0.4

1 serious citation More info Colorado average: 2.1

22 moderate citations More info Colorado average: 22.2

0 minor citations More info Colorado average: 0.2
Citations history (last 4 years)
Abuse/Neglect moderate citation Info Issues related to protecting resident's from harm, including abuse, neglect, or mistreatment. Jun 12, 2025
Corrected

Infection Control moderate citation Info Issues related to preventing and controlling infections, including hygiene practices and safety protocols. Jun 12, 2025
Corrected

Infection Control moderate citation Info Issues related to preventing and controlling infections, including hygiene practices and safety protocols. Jun 12, 2025
Corrected

Nursing Services moderate citation Info Issues related to the availability and quality of nursing staff and the care they provide. Jun 12, 2025
Corrected

Financial Assistance for
Nursing Home in Colorado

Wheatridge Care Center is located in Wheat Ridge, Colorado.
Here are the financial assistance programs available to residents in Colorado.

Get Financial aid guidance

Elderly, Blind, and Disabled Waiver

Colorado Medicaid EBD Waiver

Age 65+ or disabled
General Colorado resident, Medicaid- eligible, nursing home-level care need.
Income Limits (2025) ~$2,829/month 300% FBR, individual
Asset Limits $2,000 (individual), $3,000 (couple).
CO

Requires level-of-care assessment by case manager.

Benefits
Personal care (5-7 hours/day) Respite care (up to 240 hours/year) Adult day care ($65/day) Home modifications ($1,500 avg.)

Old Age Pension (OAP) Health Care Program

Colorado OAP

Age 60+
General Colorado resident.
Income Limits ~$1,215/month individual
Asset Limits $2,000 individual
CO

Supplements SSI; limited medical coverage.

Benefits
Cash (~$100-$800/month) Limited in-home care (2-3 hours/week) Medical assistance

Program of All-Inclusive Care for the Elderly (PACE)

Colorado Medicaid PACE

Age 55+
General Colorado resident, nursing home-level care need, safe with PACE support.
Income Limits (2025) ~$2,829/month 300% FBR
Asset Limits $2,000 (individual), $3,000 (couple).
CO

Limited to specific regions (e.g., Denver, Pueblo).

Benefits
All-inclusive care—personal care (5-7 hours/day) Meals Transportation Therapy Medical visits

Home Care Allowance (HCA)

Colorado Home Care Allowance (HCA)

Age
General Seniors typically 65+, Age 5+ with disability, Colorado resident, financial/functional need.
Income Limits (2025) ~$1,004/month individual, stricter than waivers
Asset Limits $2,000 (individual), $3,000 (couple).
CO

Must need help with ADLs; not Medicaid-waiver eligible.

Benefits
Personal care (~4-6 hours/day, paid to provider) E.g. Bathing Dressing

Senior Community Service Employment Program (SCSEP)

Colorado SCSEP (federally funded, state-administered)

Age 55+
General unemployed, low-income, Colorado resident.
Income Limits (2025) ~$1,983/month 125% FPL, individual
Asset Limits Not specified; income-focused.
CO

Priority for veterans, rural residents.

Benefits
Paid training (~20 hours/week at ~$7.25/hour) Job placement

Places of interest near Wheatridge Care Center

Address 1.4 miles from city center Info Estimated distance in miles from Wheat Ridge's city center to Wheatridge Care Center's address, calculated via Google Maps.

Calculate Travel Distance to Wheatridge Care Center

Add your location

Address

Staffing Data (Q2 2025)

This data corresponds to Q2 2025 and is based on CMS Payroll-Based Journal.

Total staff 138
Employees 82
Contractors 56
Staff to resident ratio 2.26:1
19% better than Colorado average

Colorado average ratio: 1.91:1

Avg staff/day 27
Average shift 8.4 hours
0% compared with Colorado average

Colorado average: 8.3 hours

Total staff hours (quarter) 20,611
Nursing staff breakdown
Registered Nurse

Manages medical care and health needs.

Total count 25
Average shift length Info Average shift length. Calculated as total hours divided by days worked and average staff per day. 7.6 hours

This role is partially covered by contractors.

Licensed Practical Nurse

Assists with medical care and medications.

Total count 17
Average shift length Info Average shift length. Calculated as total hours divided by days worked and average staff per day. 9.8 hours

This role is partially covered by contractors.

Certified Nursing Assistant

Helps with daily care and mobility.

Total count 59
Average shift length Info Average shift length. Calculated as total hours divided by days worked and average staff per day. 9.3 hours

This role is partially covered by contractors.

Contractor staffing

Total hours from contractors

7.5%

1,537 contractor hours this quarter

Certified Nursing Assistant: 32 Registered Nurse: 14 Licensed Practical Nurse: 6 Medical Director: 2 Respiratory Therapy Technician: 1 Occupational Therapy Aide: 1
Staff by category
Certified Nursing Assistant27325910,35991100%9.3
Licensed Practical Nurse116173,67091100%9.8
Registered Nurse1114253,00491100%7.6
Other Dietary Services Staff3035386470%6.7
Physical Therapy Assistant5055246774%7.7
Administrator1015126470%8
Mental Health Service Worker1014485662%8
Dental Services Staff1014395662%7.8
Speech Language Pathologist3033196470%4.8
Nurse Practitioner2021983437%5.8
Qualified Social Worker4041553842%4
Occupational Therapy Aide0111121618%7
Respiratory Therapist2021103640%3.1
Respiratory Therapy Technician8191034347%2.3
Clinical Nurse Specialist202881213%6.8
RN Director of Nursing101301011%3
Medical Director022244%0.5
59 Certified Nursing Assistant
% of Days 100%
17 Licensed Practical Nurse
% of Days 100%
25 Registered Nurse
% of Days 100%
3 Other Dietary Services Staff
% of Days 70%
5 Physical Therapy Assistant
% of Days 74%
1 Administrator
% of Days 70%
1 Mental Health Service Worker
% of Days 62%
1 Dental Services Staff
% of Days 62%
3 Speech Language Pathologist
% of Days 70%
2 Nurse Practitioner
% of Days 37%
4 Qualified Social Worker
% of Days 42%
1 Occupational Therapy Aide
% of Days 18%
2 Respiratory Therapist
% of Days 40%
9 Respiratory Therapy Technician
% of Days 47%
2 Clinical Nurse Specialist
% of Days 13%
1 RN Director of Nursing
% of Days 11%
2 Medical Director
% of Days 4%

Facility Characteristics

Source: CMS Long-Term Care Facility Characteristics (Data as of Jan 2026)

Total residents 61
Medicare
1
1.6% of residents
Medicaid
46
75.4% of residents
Private pay or other
14
23% of residents
Programs & Services
Residents Group

Residents meet regularly to discuss policies, care quality, and activities

Active Resident Council

Organized group of residents that meets regularly to discuss facility policies, quality of life, and activities.

Quality of care over time

These measures show how residents usually do over time at this home, based on health outcomes and preventive care.

High-risk clinical events score Info A composite score based on pressure ulcers, falls with injury, weight loss, walking ability decline, and activities of daily living decline. 6.2
32% better than Colorado average

Colorado average: 9.0

Functional decline score Info A composite score based on activities of daily living decline, walking ability decline, and incontinence. 14.1
25% better than Colorado average

Colorado average: 18.8

Long-stay resident measures
Significantly above average Info CMS star rating based on long-stay quality measure performance. 5 stars = significantly above average, 1 star = significantly below average.
Need for Help with Daily Activities Increased Info Percent of long-stay residents whose need for help with daily activities has increased 5.4%
66% better than Colorado average

Colorado average: 16.0%

Walking Ability Worsened Info Percent of long-stay residents whose ability to move independently worsened 10.8%
37% better than Colorado average

Colorado average: 17.0%

Low Risk Residents with Bowel/Bladder Incontinence Info Percent of low risk long-stay residents who lose control of their bowels or bladder 26.1%
12% worse than Colorado average

Colorado average: 23.2%

Falls with Major Injury Info Percent of long-stay residents experiencing one or more falls with major injury 3.9%
18% worse than Colorado average

Colorado average: 3.3%

High Risk Residents with Pressure Ulcers Info Percent of long-stay high risk residents with pressure ulcers 2.2%
44% better than Colorado average

Colorado average: 3.9%

Urinary Tract Infection Info Percent of long-stay residents with a urinary tract infection 1.5%
In line with Colorado average

Colorado average: 1.4%

Lost Too Much Weight Info Percent of long-stay residents who lose too much weight 8.5%
64% worse than Colorado average

Colorado average: 5.2%

Depressive Symptoms Info Percent of long-stay residents who have depressive symptoms 3.6%
50% better than Colorado average

Colorado average: 7.2%

Antipsychotic Use Info Percent of long-stay residents who received an antipsychotic medication 19.9%
6% worse than Colorado average

Colorado average: 18.8%

Pneumococcal Vaccine Info Percent of long-stay residents assessed and appropriately given the pneumococcal vaccine 96.1%
In line with Colorado average

Colorado average: 93.3%

Influenza Vaccine Info Percent of long-stay residents assessed and appropriately given the seasonal influenza vaccine 90.7%
In line with Colorado average

Colorado average: 94.7%

Short-stay resident measures
Pneumococcal Vaccine Info Percent of short-stay residents assessed and appropriately given the pneumococcal vaccine 82.7%
8% better than Colorado average

Colorado average: 76.6%

Antipsychotic medication increase Info Percent of short-stay residents who newly received an antipsychotic medication 0.0%
100% better than Colorado average

Colorado average: 1.4%

Influenza Vaccine Info Percent of short-stay residents assessed and appropriately given the seasonal influenza vaccine 59.0%
22% worse than Colorado average

Colorado average: 75.6%

Successful return to home or community Info Rate of successful return to home or community from a skilled nursing facility. 61.2%
21% better than Colorado average

Colorado average: 50.6%

Penalties and fines

Federal penalties imposed by CMS for regulatory violations, including civil money penalties (fines) and denials of payment for new Medicare/Medicaid admissions.

Source: CMS Penalties Database (Data as of Jan 2026)

Total fines amount $25K
38% lower than Colorado average

Colorado average: $40K

Number of fines 2
10% fewer fines than Colorado average

Colorado average: 2.2

Payment Denials Info Serious action where Medicare and/or Medicaid temporarily stops payments for new residents until issues are fixed. 0
100% fewer payment denials than Colorado average

Colorado average: 0.3

Fines amount comparison
This facility $25K
Colorado average $40K
Penalty History

Penalties are imposed by CMS for violations of federal nursing home regulations.

2 penalties in the past 3 years

Multiple penalties were reported in the last 3 years.

Civil Money Penalty Info Fines imposed for noncompliance, which can be assessed per day or per instance of violation. Dec 26, 2023
$12K
Civil Money Penalty Info Fines imposed for noncompliance, which can be assessed per day or per instance of violation. May 10, 2023
$13K

Last updated: Jan 2026

Compare Nursing Home around Jefferson County The information below is reported by the Colorado Department of Public Health and Environment, Health Facilities Division.

4 facilities compared · CMS & CO Dept. of Health data · Updated May 2026

Filter by care type
Life Care Center of Evergreen
NH

Nursing Home Licensed facility providing 24/7 skilled nursing care for residents with complex, ongoing medical needs. Staffed by RNs, LPNs, and CNAs. Inspected and star-rated annually by CMS. Accepts Medicare (short-term rehab) and Medicaid (long-term care).

MC

Memory Care Secured, specialized care for people living with Alzheimer's or dementia. Staff trained in cognitive impairment, with higher staff-to-resident ratios and an environment designed to reduce confusion and wandering risk.

Evergreen (Evergreen West Central)97 53.1% -31%3.50 +46%-9%0113.7-56 33 Carlson, Amber$8.7M$4.9M56.6%65276
Western Hills Health Care Center
NH

Nursing Home Licensed facility providing 24/7 skilled nursing care for residents with complex, ongoing medical needs. Staffed by RNs, LPNs, and CNAs. Inspected and star-rated annually by CMS. Accepts Medicare (short-term rehab) and Medicaid (long-term care).

MC

Memory Care Secured, specialized care for people living with Alzheimer's or dementia. Staff trained in cognitive impairment, with higher staff-to-resident ratios and an environment designed to reduce confusion and wandering risk.

Lakewood (Morse Park)103 84.2% +10%3.74 +4%-3%0225.5-90 84 Goeglein, Amy$11.9M$6.2M52.2%65209
Wheatridge Care Center
NH

Nursing Home Licensed facility providing 24/7 skilled nursing care for residents with complex, ongoing medical needs. Staffed by RNs, LPNs, and CNAs. Inspected and star-rated annually by CMS. Accepts Medicare (short-term rehab) and Medicaid (long-term care).

HC

Home Care Professional care delivered in the person's own home — from companionship and errands to skilled nursing and therapy. Allows seniors to age in place. Medicare covers skilled home health when medically necessary.

RC

Respite Care Short-term temporary care — days to weeks — to give family caregivers a break. Full care provided during the stay. Often used after hospitalization or to trial a facility before a permanent placement decision.

Wheat Ridge65 91.0% +19%3.44 +34%-11%2244.8260 59 Moskowitz, Joyce$8.4M$3.4M40.7%65308
Prestige Care Center of Morrison
NH

Nursing Home Licensed facility providing 24/7 skilled nursing care for residents with complex, ongoing medical needs. Staffed by RNs, LPNs, and CNAs. Inspected and star-rated annually by CMS. Accepts Medicare (short-term rehab) and Medicaid (long-term care).

HC

Home Care Professional care delivered in the person's own home — from companionship and errands to skilled nursing and therapy. Allows seniors to age in place. Medicare covers skilled home health when medically necessary.

RC

Respite Care Short-term temporary care — days to weeks — to give family caregivers a break. Full care provided during the stay. Often used after hospitalization or to trial a facility before a permanent placement decision.

Morrison180 65.7% -14%3.71 -20%-4%3645.3985 36 -$13.3M$5.8M43.5%65188

Guides for Better Senior Living

Care Cost Calculator: See Prices in Your Area

Nursing Home Data Explorer

Don’t Wait Too Long: 7 Red Flag Signs Your Parent Needs Assisted Living Now

The True Cost of Assisted Living in 2025 – And How Families Are Paying For It

Understanding Senior Living Costs: Pricing Models, Discounts & Financial Assistance

Frequently Asked Questions about Wheatridge Care Center

Is Wheatridge Care Center in a walkable area?

Wheatridge Care Center has a walk score of 59. Moderately walkable. Some errands can be accomplished on foot, with a mix of nearby amenities.

Who is the administrator of Wheatridge Care Center?

field_administrator is the administrator of Wheatridge Care Center.

What is the address of Wheatridge Care Center?

Wheatridge Care Center is located at 2920 Fenton St, Wheat Ridge, CO 80214.

What is the phone number of Wheatridge Care Center?

(303) 238-0481 will put you in contact with the team at Wheatridge Care Center.

Is Wheatridge Care Center Medicare or Medicaid certified?

Yes — Wheatridge Care Center is a CMS-certified provider of Medicare and Medicaid.

Explore Open Rooms
1 Contact details
2 What type of senior care service are you looking for?
3 What budget do you have in mind for senior care?
4 How soon do you need to find care?
5 Additional details

Thank you for your interest!

Our team will be in touch shortly to help with next steps.