


Total health inspections
3
New York average 3.6
Last Health inspection on Jan 2025
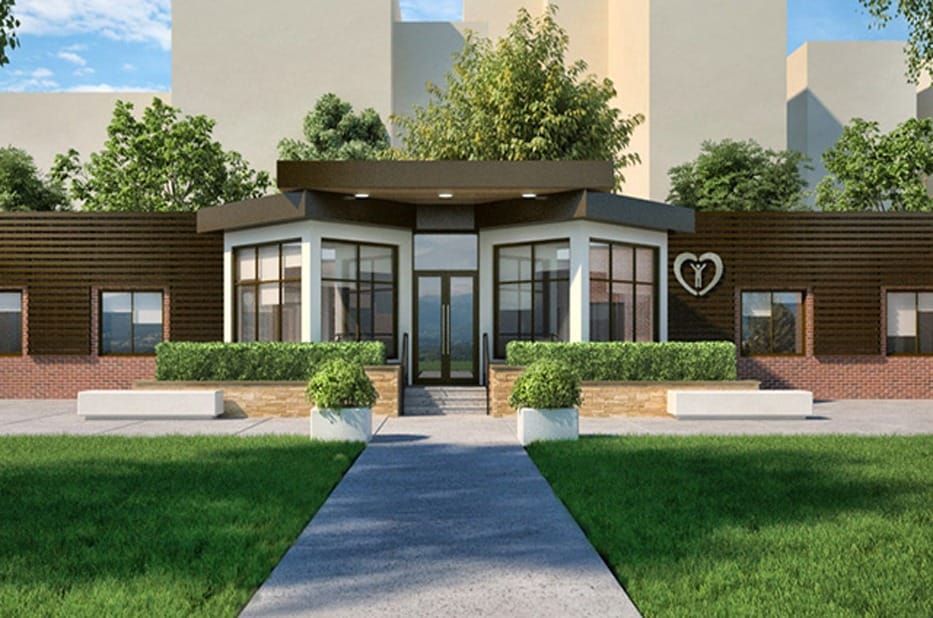


Williamsbridge Center for Rehabilitation and Nursing has been dedicated to providing the highest standard of quality living while maintaining a level of tight-knit relationships among everyone in the community. The upscale skilled nursing home is proudly results-driven– found in its state-of-the-art technology that makes for a fast recovery period. Williamsbridge is the type of community that understands the meaning of family which is why they make it a point to promote an environment that has kindred spirits and strong friendships.
Considerably the best rehab center in the Bronx, Williamsbridge’s areas of quality services include an on-site medical staff of clinical specialists, EMR and charting technology, and the RehabStrong™ program that focuses on getting stronger.
Staffing hours
![]() Daily nursing hours per resident by staff type, reported to CMS. Higher is generally better — compare this facility to state and national averages to see where staffing stands.
Daily nursing hours per resident by staff type, reported to CMS. Higher is generally better — compare this facility to state and national averages to see where staffing stands.
Hours per resident per day vs New York averages
Total nursing care
![]() This home is ranked 181st out of 389 homes in New York for nurse hours. Total adjusted nursing hours per resident per day, combining RN, LPN, and aide time. CMS adjusts this for case-mix so facilities can be fairly compared.
This home is ranked 181st out of 389 homes in New York for nurse hours. Total adjusted nursing hours per resident per day, combining RN, LPN, and aide time. CMS adjusts this for case-mix so facilities can be fairly compared.
3h 17m
9% below state avg4 of 6 metrics below state avg
In New York, the Department of Health, Office of Aging and Long Term Care performs unannounced onsite inspections to monitor compliance with state and federal healthcare regulations.
7 points above the New York average for assisted living residences (83/100)
Rank #196 / 616 in New York Inspection Score — State benchmarked This home is ranked 196th out of 616 homes in New York for inspection score. Shows this facility's inspection score compared to the New York average among 616 comparable communities in the ranking pool. Facilities with the same value for a metric share the same rank. Rankings are based only on facilities in New York that report data for that category. Facilities without available data are excluded from the ranking. This is a proprietary Assisted Living Magazine score. Inspection score: 90 out of 100. Letter grade A-. 7 points above the New York average for assisted living residences (83/100)
Inspections
| This Facility | NY Average | vs. NY Avg |
|---|---|---|---|
|
Total inspections
| 3 | 9 | This facility has had 67% fewer total inspections than the New York average (3 vs. NY avg 9). More inspections can mean more regulatory scrutiny rather than worse care.↓ 67% fewer |
|
Complaint visits
| 1 | 6 | This facility has had 83% fewer complaint visits than the New York average (1 vs. NY avg 6). More inspections can mean more regulatory scrutiny rather than worse care.↓ 83% fewer |
Violations
| This Facility | NY Average | vs. NY Avg |
|---|---|---|---|
|
Total violations
| 17 | 14.5 | This facility has 17% more total violations than a typical New York assisted living residence (17 vs. NY avg 14.5).↑ 17% worse |
|
Violations per inspection
| 5.7 | 1.6 | This facility has 256% more violations per inspection than a typical New York assisted living residence (5.7 vs. NY avg 1.6).↑ 256% worse |
New York average 3.6
Last Health inspection on Jan 2025
New York average 18.5
New York average 5.05
Health citations are formal notices following inspections when they fail to comply with safety and care standards.
14 of 17 citations resulted from standard inspections; and 3 of 17 resulted from complaint investigations.
New York average: 0.2
New York average: 0.2
Summary of court-record activity tied to this facility, compiled from publicly available case dockets.
Source: State court e-filing records
Reporting period: October 1 – December 31, 2025 (Q4 2025). Source: CMS Payroll-Based Journal report.
Manages medical care and health needs.
Assists with medical care and medications.
Helps with daily care and mobility.
Total hours from contractors
4,409 contractor hours this quarter
| Certified Nursing Assistant | 44 | 0 | 44 | 15,908 | 92 | 100% | 7.1 |
| Licensed Practical Nurse | 14 | 3 | 17 | 4,647 | 92 | 100% | 7.3 |
| Registered Nurse | 14 | 0 | 14 | 1,712 | 92 | 100% | 5.9 |
| Respiratory Therapy Technician | 0 | 3 | 3 | 1,205 | 81 | 88% | 6.9 |
| Physical Therapy Aide | 0 | 3 | 3 | 1,001 | 80 | 87% | 7.9 |
| Speech Language Pathologist | 0 | 3 | 3 | 754 | 73 | 79% | 6.5 |
| Physical Therapy Assistant | 0 | 3 | 3 | 735 | 80 | 87% | 5.4 |
| Other Social Services Staff | 2 | 0 | 2 | 574 | 69 | 75% | 7.8 |
| Clinical Nurse Specialist | 2 | 0 | 2 | 508 | 58 | 63% | 7.4 |
| Administrator | 1 | 0 | 1 | 464 | 58 | 63% | 8 |
| Dental Services Staff | 1 | 0 | 1 | 448 | 64 | 70% | 7 |
| Nurse Practitioner | 1 | 0 | 1 | 447 | 63 | 68% | 7.1 |
| Qualified Social Worker | 0 | 2 | 2 | 239 | 40 | 43% | 6 |
| Occupational Therapy Aide | 2 | 0 | 2 | 238 | 29 | 32% | 8 |
| Other Dietary Services Staff | 0 | 1 | 1 | 206 | 30 | 33% | 6.9 |
Federal penalties imposed by CMS for regulatory violations, including civil money penalties (fines) and denials of payment for new Medicare/Medicaid admissions.
Source: CMS Penalties Database
No penalties in the past 3 years
No civil money penalties or payment denials were reported in the last 3 years.
These measures show how residents usually do over time at this home, based on health outcomes and preventive care.
New York average: 9.8
New York average: 18.1
New York average: 16.4%
New York average: 16.6%
New York average: 21.4%
New York average: 3.0%
New York average: 7.2%
New York average: 1.4%
New York average: 6.1%
New York average: 18.1%
New York average: 12.6%
New York average: 91.4%
New York average: 95.2%
New York average: 1.71
New York average: 1.35
New York average: 76.6%
New York average: 1.3%
New York average: 78.8%
New York average: 0.8%
New York average: 53.7%
Quality measures are calculated from Minimum Data Set (MDS) assessments. For most measures, lower percentages indicate better care quality.
26% of new residents, usually for short-term rehab.
58% of new residents, often for short stays.
16% of new residents, often for long-term daily care.
Source: CMS Long-Term Care Facility Characteristics (Data as of Jan 2026)
Residents meet regularly to discuss policies, care quality, and activities
Organized group of residents that meets regularly to discuss facility policies, quality of life, and activities.
Data sourced from CMS Long-Term Care Facility Characteristics quarterly report. Payer mix reflects the current resident census by primary payment source.
Historical financial and operational data for Williamsbridge Center for Rehabilitation and Nursing from 2011–2023, based on CMS SNF Cost Reports.
Key figures below are for fiscal year ending in 12/2023.
Based on CMS SNF Cost Report for fiscal year ending in 12/2023.
This home supports both short-term rehab and long-term care, with residents staying for a wide range of durations.
Most new residents arrive under private pay (58% of admissions), and a typical private pay stay runs around 2 - 3 months.
Coverage residents most often arrive under.
Coverage residents most often leave under.
What do you like most about living here?
Nothing.
Are there enough caregivers to handle the residents' needs, especially during emergencies?
Yes
Are the common areas pleasant and comfortable for socializing or relaxing?
No
How do you feel about the level of social interaction available with other residents?
Scary.
How was the units offered in this community?
Crowded.
Do you feel safe living in this community?
No
How well do you think the community handles emergencies or unexpected events?
Can't say.
How would you rate the quality and variety of the meals? (1-5)
1
Are special diets handled well?
No
Is the dining schedule flexible enough to meet your preferences?
No
Are there any hidden fees or unexpected charges?
I wouldn't know
Would you recommend this community to others looking for senior living options?
NO!!!!
Is there anything you wish you knew before moving in?
I wish out insurance covered another place
![]() 1.0 miles from city center
1.0 miles from city center
![]() Estimated distance in miles from Bronx's city center to Williamsbridge Center for Rehabilitation and Nursing's address, calculated via Google Maps.
— 0.15 miles to nearest hospital (Calvary Hospital)
Estimated distance in miles from Bronx's city center to Williamsbridge Center for Rehabilitation and Nursing's address, calculated via Google Maps.
— 0.15 miles to nearest hospital (Calvary Hospital)
Add your location
Info below is compiled from CMS reports & the NY State Dept. of Health (NYSDOH), senior community websites & trusted data sources such as Walk Score & BBB.
Communities are listed from highest to lowest based on our ranking methodology.
| The Plaza Rehab and Nursing Center | NH HOS PC RC SNF | Bronx (Fordham Manor) | 744
Facility
744
NY AVG
160
Rank
#1 / 737 |
98.0%
Facility
98.0%
NY AVG
87.2
Rank
#59 / 408 | +12% | 3.22
Facility
3.22
NY AVG
3.58
Rank
#199 / 389 | +74% | -10% | $0
Facility
$0
NY AVG
$67.6k
Rank
#1 / 397 | 81
Facility
81
NY AVG
83
Rank
#390 / 616 | 14
Facility
14
NY AVG
18.5
Rank
#147 / 396 | 4.7
Facility
4.7
NY AVG
5.1
Rank
#190 / 396 | - | 729 | A+ |
87
Facility
87
NY AVG
64
Rank
#344 / 1149 | Tcprnc, LLC (For Profit) | $127.4MFiscal year ending 12/2023
Facility
$127.4MFiscal year ending 12/2023
NY AVG
$29.2M
Rank
#1 / 381 | $51.1MFiscal year ending 12/2023
Facility
$51.1MFiscal year ending 12/2023
NY AVG
$15.4M
Rank
#14 / 381 | 40.1%Fiscal year ending 12/2023
Facility
40.1%Fiscal year ending 12/2023
NY AVG
55.8%
Rank
#314 / 380 | 335462 | ||||
| Providence Rest | NH HC MC RC SNF | Bronx (East Bronx) | 200
Facility
200
NY AVG
160
Rank
#165 / 737 |
96.0%
Facility
96.0%
NY AVG
87.2
Rank
#141 / 408 | +10% | 2.93
Facility
2.93
NY AVG
3.58
Rank
#282 / 389 | +51% | -18% | $0
Facility
$0
NY AVG
$67.6k
Rank
#1 / 397 | 80
Facility
80
NY AVG
83
Rank
#408 / 616 | 18
Facility
18
NY AVG
18.5
Rank
#211 / 396 | 6.0
Facility
6.0
NY AVG
5.1
Rank
#277 / 396 | 1 | 192 | - |
50
Facility
50
NY AVG
64
Rank
#778 / 1149 | Telma Flores | $31.4MFiscal year ending 12/2023
Facility
$31.4MFiscal year ending 12/2023
NY AVG
$29.2M
Rank
#142 / 381 | $15.8MFiscal year ending 12/2023
Facility
$15.8MFiscal year ending 12/2023
NY AVG
$15.4M
Rank
#133 / 381 | 50.2%Fiscal year ending 12/2023
Facility
50.2%Fiscal year ending 12/2023
NY AVG
55.8%
Rank
#216 / 380 | 335583 | ||||
| Eastchester Rehabilitation and Health Care Center | NH SNF | Bronx (Laconia) | 200
Facility
200
NY AVG
160
Rank
#165 / 737 |
92.0%
Facility
92.0%
NY AVG
87.2
Rank
#251 / 408 | +5% | - | +40% | - | $0
Facility
$0
NY AVG
$67.6k
Rank
#1 / 397 | 99
Facility
99
NY AVG
83
Rank
#21 / 616 | 6
Facility
6
NY AVG
18.5
Rank
#21 / 396 | 2.0
Facility
2.0
NY AVG
5.1
Rank
#14 / 396 | - | 184 | - |
72
Facility
72
NY AVG
64
Rank
#581 / 1149 | Moshe Sirkis | $32.5MFiscal year ending 12/2023
Facility
$32.5MFiscal year ending 12/2023
NY AVG
$29.2M
Rank
#133 / 381 | $20.1MFiscal year ending 12/2023
Facility
$20.1MFiscal year ending 12/2023
NY AVG
$15.4M
Rank
#77 / 381 | 61.7%Fiscal year ending 12/2023
Facility
61.7%Fiscal year ending 12/2023
NY AVG
55.8%
Rank
#96 / 380 | 335214 | ||||
| Gold Crest Care Center | NH HOS PC RC SNF | Bronx (Laconia) | 175
Facility
175
NY AVG
160
Rank
#273 / 737 |
90.9%
Facility
90.9%
NY AVG
87.2
Rank
#269 / 408 | +4% | 4.01
Facility
4.01
NY AVG
3.58
Rank
#77 / 389 | -3% | +12% | $0
Facility
$0
NY AVG
$67.6k
Rank
#1 / 397 | 91
Facility
91
NY AVG
83
Rank
#173 / 616 | 11
Facility
11
NY AVG
18.5
Rank
#90 / 396 | 2.8
Facility
2.8
NY AVG
5.1
Rank
#52 / 396 | - | 159 | - |
72
Facility
72
NY AVG
64
Rank
#581 / 1149 | Anna Appel | $24.1MFiscal year ending 12/2023
Facility
$24.1MFiscal year ending 12/2023
NY AVG
$29.2M
Rank
#191 / 381 | $13.0MFiscal year ending 12/2023
Facility
$13.0MFiscal year ending 12/2023
NY AVG
$15.4M
Rank
#186 / 381 | 53.8%Fiscal year ending 12/2023
Facility
53.8%Fiscal year ending 12/2023
NY AVG
55.8%
Rank
#168 / 380 | 335079 | ||||
| Williamsbridge Center for Rehabilitation and Nursing | NH SNF | Bronx (Westchester Square) | 77
Facility
77
NY AVG
160
Rank
#595 / 737 |
97.8%
Facility
97.8%
NY AVG
87.2
Rank
#77 / 408 | +12% | 3.28
Facility
3.28
NY AVG
3.58
Rank
#181 / 389 | +12% | -9% | $0
Facility
$0
NY AVG
$67.6k
Rank
#1 / 397 | 90
Facility
90
NY AVG
83
Rank
#196 / 616 | 17
Facility
17
NY AVG
18.5
Rank
#199 / 396 | 5.7
Facility
5.7
NY AVG
5.1
Rank
#262 / 396 | - | 75 | A+ |
89
Facility
89
NY AVG
64
Rank
#285 / 1149 | Meir Horovitz | $11.1MFiscal year ending 12/2023
Facility
$11.1MFiscal year ending 12/2023
NY AVG
$29.2M
Rank
#336 / 381 | $3.3MFiscal year ending 12/2023
Facility
$3.3MFiscal year ending 12/2023
NY AVG
$15.4M
Rank
#374 / 381 | 30%Fiscal year ending 12/2023
Facility
30%Fiscal year ending 12/2023
NY AVG
55.8%
Rank
#374 / 380 | 335048 |
Williamsbridge Center for Rehabilitation and Nursing is located in New York City, New York State.
Here are the financial assistance programs available to residents in New York City.
Williamsbridge Center for Rehabilitation and Nursing is in the Westchester Square neighborhood of Bronx.
Williamsbridge Center for Rehabilitation and Nursing has a walk score of 89. Very walkable. Most errands can be accomplished on foot, and many essentials are within a short walk.
Williamsbridge Center for Rehabilitation and Nursing's occupancy is 96.5%.
No, Williamsbridge Center for Rehabilitation and Nursing has a no-pet policy.
Williamsbridge Center for Rehabilitation and Nursing is registered as a for-profit in NY.
Williamsbridge Center for Rehabilitation and Nursing has had 17 reported violations since 2021 according to records from New York State Department of Health (NYSDOH).
Yes — there are 18 photos of Williamsbridge Center for Rehabilitation and Nursing in the photo gallery on this page.
Care Cost Calculator: See Prices in Your Area
Nursing Home Data Explorer
Don’t Wait Too Long: 7 Red Flag Signs Your Parent Needs Assisted Living Now
The True Cost of Assisted Living in 2025 – And How Families Are Paying For It
Understanding Senior Living Costs: Pricing Models, Discounts & Financial Assistance


