Woodbury Heights Nursing and Rehabilitation Center
Nursing Home, Hospice Care, Memory Care, Palliative Care & Skilled Nursing · Woodbury, NY
CMS overall rating Info CMS (the Centers for Medicare & Medicaid Services) is the federal agency that rates nursing home quality. Its Overall Rating runs from 1 to 5 stars, combining health inspections, staffing, and quality measures, with inspections weighted most heavily.

Woodbury Heights Nursing and Rehabilitation Center

Nursing Home, Hospice Care, Memory Care, Palliative Care & Skilled Nursing · Woodbury, NY
CMS overall rating Info CMS (the Centers for Medicare & Medicaid Services) is the federal agency that rates nursing home quality. Its Overall Rating runs from 1 to 5 stars, combining health inspections, staffing, and quality measures, with inspections weighted most heavily.
Woodbury Heights Nursing and Rehabilitation Center accepts Medicare, Medicaid, and private pay.

Overview of Woodbury Heights Nursing and Rehabilitation Center

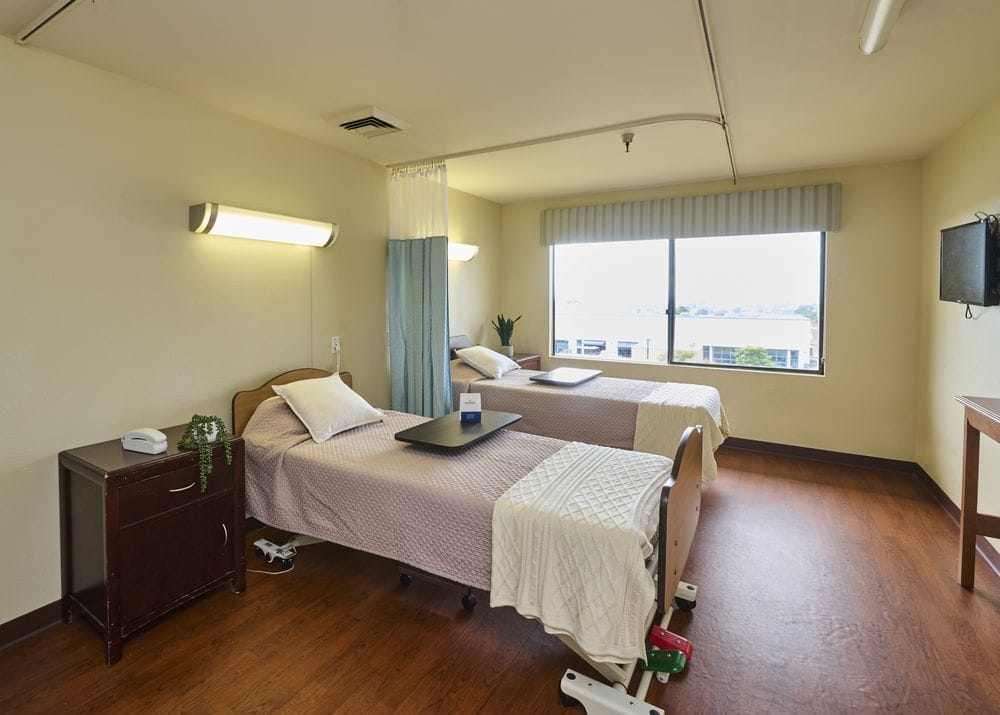
Woodbury Heights Nursing and Rehabilitation Center is a nursing home in Woodbury, NY, offering memory care, hospice care, rehabilitation, and skilled nursing. The community also ensures older adults feel at home in a comfortable and clean setting. With restaurant-style dining, 24-hour care, and beauty parlor services, residents experience maintenance-free living. Through customized care plans, residents also receive the best possible care tailored to their ever-changing needs and habits.

Pet visits, light exercises, and fun gatherings help keep residents happy and encourage them to maintain holistic well-being. With a spacious courtyard, a chapel, and a gift shop, residents have more spaces for interactions and relaxation. North Shore Lij Health Systems, Stillwell Woods Park, and a variety of local amenities are available in the area, ensuring accessibility and convenience. This nursing home is committed to helping older adults live to their potential, making it one of the trusted options for senior living in New York.

Quality ratings

Measured by Centers for Medicare & Medicaid Services (CMS)

Overall rating Info The Overall CMS Rating combines results from health inspections, staffing levels and quality measures. Health inspections carry the most weight. Staffing and quality scores can increase or decrease the final rating based on performance compared to state and national standards.
▼ 67.1% Below NY avg. ▼ 67.1% Below NY avg.NY average: 3.0Click the badge to see the full State ranking.Click here to see the full State ranking.
Health Inspection Info Based on the results of the facility's three most recent standard inspections and any complaint investigations. CMS reviews the number, scope, and severity of deficiencies, with more recent findings weighted more heavily.
▼ 63.7% Below NY avg. ▼ 63.7% Below NY avg.NY average: 2.8Click the badge to see the full State ranking.Click here to see the full State ranking.
Staffing Info Measures average nursing staff hours per resident per day, including Registered Nurses (RNs) and total nursing staff. Ratings are adjusted based on the level of care residents require and are compared to state and national benchmarks.
▲ 7.5% Above NY avg. ▲ 7.5% Above NY avg.NY average: 2.8Click the badge to see the full State ranking.Click here to see the full State ranking.
Quality Measures Info Based on clinical and physical health indicators reported to CMS, such as hospital readmissions, falls, pressure ulcers, and improvements in mobility. These measures reflect how well residents' health needs are being managed.
▲ 3.7% Above NY avg. ▲ 3.7% Above NY avg.NY average: 3.9Click the badge to see the full State ranking.Click here to see the full State ranking.

Staffing Info Nursing care per resident per day and state rankings: CMS Provider Information.

Total nursing care per resident / day Info This nursing home is ranked 167th out of 501 nursing homes we track in New York for nurse hours. Total adjusted nursing hours per resident per day, combining RN, LPN, and aide time. CMS adjusts this for case-mix so facilities can be fairly compared.
↑ 4% · NY 3h 35mThis facility: 3h 44m per resident per day, 4% above the New York average of 3h 35m (among New York facilities reporting a recent figure).Green: 5% or more better than the state average. Yellow: within 5%. Red: 5% or more worse. Rank #167 / 501Nurse hours — State benchmarked This nursing home is ranked 167th out of 501 nursing homes we track in New York for nurse hours. Shows adjusted nurse hours per resident per day benchmarked to the New York average, with a ranking across 501 New York facilities. More hours mean more direct care. The national average is about 3.5 hrs; below 3.0 is a red flag. Communities with the same value for a metric share the same rank. Rankings compare like with like: every nursing home we track in New York that reports data for that category. Nursing homes without available data are excluded, so the pool size varies from metric to metric.
3h 44m

Standout metric: RN, weekends is +17% above New York average

2 of 6 metrics below New York average

By The Numbers

Community insights.

Walk Score Info Somewhat walkable. Some errands can be accomplished on foot, with a mix of nearby amenities. Rank #277 / 450Walk Score — State benchmarked This nursing home is ranked 277th out of 450 nursing homes we track in New York for walk score. Shows how walkable this facility's neighborhood is compared to the average walk score across New York facilities. Higher scores benefit residents, families, and staff. Communities with the same value for a metric share the same rank. Rankings compare like with like: every nursing home we track in New York that reports data for that category. Nursing homes without available data are excluded, so the pool size varies from metric to metric.
61 / 100
Residents per day (avg) Info The average number of residents living at this facility on a given day. CMS calculates this figure from the facility's Minimum Data Set (MDS) assessments and uses this value for other measures like Hours Per Resident Per Day (HPRD) and 5-Star Staffing rating.
278

Source: CMS Provider Information, average daily residents (data as of Aug 2026)

Avg. Length of Stay Info Average number of days residents stay at this facility, based on CMS cost report data. Shorter stays often reflect post-acute or rehab care; longer stays reflect long-term care.
174 days

About This Community

License Details

Inspection Rating1

Therapy & Rehabilitation

4 services
Short-Term Rehab
Cardiac RehabilitationA supervised program that helps people regain strength and endurance after heart problems or procedures, often including exercise and risk-factor education.
Stroke Recovery
Orthopedic Rehabilitation

Staffing & Medical

3 services
Wound CareCare for wounds such as pressure sores, surgical wounds, or ulcers, including assessment, dressing changes, and monitoring for infection.
Respiratory & Ventilation
Dialysis

Memory & Specialized Care

2 services
Palliative CareCare focused on relieving pain, symptoms, and stress while supporting quality of life. It can be provided alongside treatment for a serious illness.
Hospice & Comfort Care

Additional Services

1 service
Beauty Services

Amenities & Lifestyle

Courtyard
Wi-Fi
Activities
Movie Nights
Cookouts
Live Entertainment
Themed Parties
Karaoke
Holiday Celebrations

Faith & Spiritual Life

Chapel

Contact Woodbury Heights Nursing and Rehabilitation Center

Penalties and fines

Federal penalties imposed by CMS for regulatory violations, including civil money penalties (fines) and denials of payment for new Medicare/Medicaid admissions.

Source: CMS Penalties Database

No penalties in the past 3 years

No civil money penalties or payment denials were reported in the last 3 years.

Breakdown by payment type

Medicare

25% of new residents, usually for short-term rehab.

Typical stay 27 days

Private pay

25% of new residents, often for short stays.

Typical stay 4 - 5 months

Medicaid

50% of new residents, often for long-term daily care.

Typical stay 11 months

Finances and operations

Based on CMS SNF Cost Report for fiscal year ending in 12/2024.

For-profit
Operated by a limited liability company.
Net patient revenue Info Net patient revenue — what the home actually collects for resident care, after contractual allowances, bad debt and discounts are subtracted from its gross charges (CMS cost report, Worksheet G-3). It covers resident care only; money the home earns from other sources is shown separately as "Other income."
$64.3MFiscal year ending 12/2024
Net patient income Info Net patient income: net patient revenue minus the home's total operating expenses. A positive figure means it earns more from resident care than it spends to deliver it; a negative figure means the opposite. It excludes non-operating "other income."
-$21.0MFiscal year ending 12/2024
For-profit Operated by a limited liability company.
Net patient revenue Info Net patient revenue — what the home actually collects for resident care, after contractual allowances, bad debt and discounts are subtracted from its gross charges (CMS cost report, Worksheet G-3). It covers resident care only; money the home earns from other sources is shown separately as "Other income."
$64.3MFiscal year ending 12/2024 Rank #11 / 464Net patient revenue — State benchmarked This nursing home is ranked 11th out of 464 nursing homes we track in New York. Shows this facility's net patient revenue compared to the New York average, among facilities reporting a recent fiscal year. Higher revenue generally means more resources for staffing and capital — read alongside Payroll %. Communities with the same value for a metric share the same rank. Rankings compare like with like: every nursing home we track in New York that reports data for that category. Nursing homes without available data are excluded, so the pool size varies from metric to metric.
Net patient income Info Net patient income: net patient revenue minus the home's total operating expenses. A positive figure means it earns more from resident care than it spends to deliver it; a negative figure means the opposite. It excludes non-operating "other income."
-$21.0MFiscal year ending 12/2024
Other income Info Money the home earns outside of resident care — such as investments, grants, rentals and other non-operating sources (CMS cost report, Worksheet G-3). It is tracked separately from net patient revenue: it is not part of that figure, and it is not included in net patient income.
$8.0KFiscal year ending 12/2024
Payroll costs Info Staff salaries plus wage-related costs — benefits such as payroll taxes, health insurance and retirement — from the home's own accounting records (CMS cost report, Worksheet A). Contract or agency labor is counted separately, under other operating costs. Rank #2 / 464Payroll costs — State benchmarked This nursing home is ranked 2nd out of 464 nursing homes we track in New York. Shows total staff payroll — salaries plus wage-related benefits — benchmarked to the New York average, among facilities reporting a recent fiscal year. Higher payroll relative to peers often signals better staffing and less reliance on contract labor. Communities with the same value for a metric share the same rank. Rankings compare like with like: every nursing home we track in New York that reports data for that category. Nursing homes without available data are excluded, so the pool size varies from metric to metric.
$59.2MFiscal year ending 12/2024 92.1% of net patient revenue Info Payroll as a share of revenue: staff salaries and wage-related benefits divided by net patient revenue. A higher figure means more of each revenue dollar goes to staff pay. Rank #25 / 462Payroll % of net patient revenue — State benchmarked This nursing home is ranked 25th out of 462 nursing homes we track in New York. Shows payroll as a percentage of net patient revenue versus the New York average, among facilities reporting a recent fiscal year. Below 25% may signal understaffing or heavy agency use — read with Staffing ratings. Communities with the same value for a metric share the same rank. Rankings compare like with like: every nursing home we track in New York that reports data for that category. Nursing homes without available data are excluded, so the pool size varies from metric to metric.
Other operating costs Info Everything it costs to run the home apart from payroll — food, utilities, supplies, maintenance, contract labor and administration. Calculated as total operating expense minus payroll (staff salaries and wage-related benefits).
$26.1MFiscal year ending 12/2024
Total costs Info The home's total operating expense for the year — all the costs of running it, salaries included (CMS cost report, Worksheet G-3).
$85.3MFiscal year ending 12/2024

Who this home usually serves

TYPE OF STAY

Mostly long-term care residents

Most residents stay for extended periods and receive ongoing daily care.

Most new residents arrive under Medicaid (50% of admissions), and a typical Medicaid stay runs around 11 months.

Admissions
660 total

Coverage residents most often arrive under.

Medicare 25%
Private pay 25%
Medicaid 50%
Discharges
793 total

Coverage residents most often leave under.

Medicare 8%
Private pay 25%
Medicaid 66%

Places of interest near Woodbury Heights Nursing and Rehabilitation Center

Address 378 Syosset-Woodbury Rd, Woodbury, NY 11797

Calculate Travel Distance to Woodbury Heights Nursing and Rehabilitation Center

Add your location

Address

Financial Assistance for
Nursing Home in New York

Woodbury Heights Nursing and Rehabilitation Center is located in Woodbury, New York State.
Here are the financial assistance programs available to residents in New York State.

Get Financial aid guidance

Community First Choice Option

NY Medicaid CFCO

Age 65+ or disabled
General New York resident, Medicaid- eligible, care need (not necessarily nursing home level).
Income Limits (2025) ~$2,829/month 300% FBR, individual
Asset Limits $30,182 individual, higher due to NY Medicaid expansion
NY

Higher asset limit; urban density increases demand.

Benefits
Personal care (5-7 hours/day) Respite care (240 hours/year) Home modifications ($1,500 avg.) Assistive technology ($500 avg.)

Expanded In-Home Services for the Elderly Program (EISEP)

NY EISEP

Age 60+
General New York resident, at risk of decline but not nursing home level.
Income Limits ~$2,500/month individual, varies
Asset Limits $15,000 individual
NY

Cost-sharing required above certain income; urban/rural balance.

Benefits
In-home care (3-5 hours/week) Respite (up to 10 days/year) Case management Transportation (~5 trips/month)

Frequently Asked Questions about Woodbury Heights Nursing and Rehabilitation Center

Is Woodbury Heights Nursing and Rehabilitation Center in a walkable area?

Woodbury Heights Nursing and Rehabilitation Center has a walk score of 61. Somewhat walkable. Some errands can be accomplished on foot, with a mix of nearby amenities.

What is the occupancy rate at Woodbury Heights Nursing and Rehabilitation Center?

Woodbury Heights Nursing and Rehabilitation Center's occupancy is 59.1%.

Are pets allowed at Woodbury Heights Nursing and Rehabilitation Center?

No, Woodbury Heights Nursing and Rehabilitation Center has a no-pet policy.

What is the best email address for Woodbury Heights Nursing and Rehabilitation Center?

The team at Woodbury Heights Nursing and Rehabilitation Center can be reached at info@woodburyhnrc.com.

Does Woodbury Heights Nursing and Rehabilitation Center operate as a for-profit or non-profit?

Woodbury Heights Nursing and Rehabilitation Center is registered as a for-profit.

What is the overall rating for Woodbury Heights Nursing and Rehabilitation Center?

Woodbury Heights Nursing and Rehabilitation Center received a 1-star overall rating from the CMS (Centers for Medicare and Medicaid Services). This score combines results from staffing levels, quality measures, and health inspections.

Are there photos of Woodbury Heights Nursing and Rehabilitation Center?

Yes — there is 1 photo of Woodbury Heights Nursing and Rehabilitation Center in the photo gallery on this page.

Guides for Better Senior Living

Care Cost Calculator: See Prices in Your Area

Nursing Home Data Explorer

Don’t Wait Too Long: 7 Red Flag Signs Your Parent Needs Assisted Living Now

The True Cost of Assisted Living in 2025 – And How Families Are Paying For It

Understanding Senior Living Costs: Pricing Models, Discounts & Financial Assistance