Worthington Healthcare Center
Nursing Home, Assisted Living & Memory Care · Parkersburg, WV
CMS overall rating Info The Overall CMS Rating is scored from 1 to 5 stars and combines results from health inspections, staffing levels, and quality measures. Health inspections carry the most weight. Staffing and quality scores can increase or decrease the final rating based on performance compared to state and national standards.

Worthington Healthcare Center

Nursing Home, Assisted Living & Memory Care · Parkersburg, WV
CMS overall rating Info The Overall CMS Rating is scored from 1 to 5 stars and combines results from health inspections, staffing levels, and quality measures. Health inspections carry the most weight. Staffing and quality scores can increase or decrease the final rating based on performance compared to state and national standards.
Calculator: See prices in your area
Worthington Healthcare Center accepts Medicaid, Medicare, and private pay.

Overview of Worthington Healthcare Center

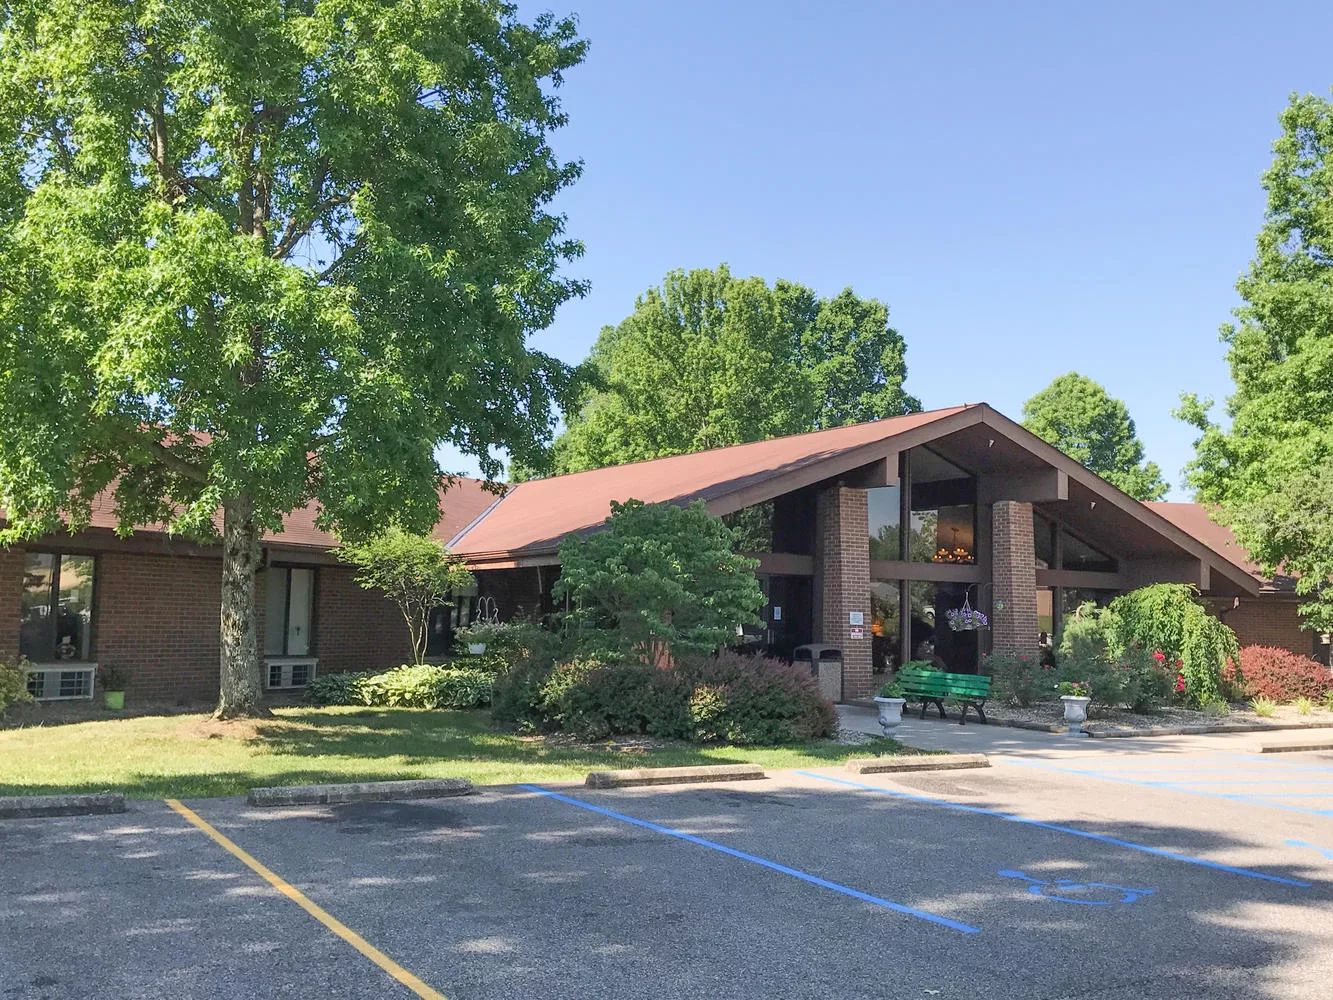
Worthington Healthcare Center, by the CommuniCare Family of Communities, is Parkersburg’s leading skilled nursing and rehabilitation home with memory care. It offers a warm and welcoming atmosphere where residents and staff are encouraged to create friendships and build a mutual level of trust with each other. The long-term care facility aims to enhance the quality of life for its residents by ensuring that seniors can satisfy their holistic wellness.

Worthington Healthcare Center emphasizes its short and long-term care services delivered by a dedicated team of caregivers who strive to meet and follow a resident’s individualized care plan for a complete healing period. Areas of expertise include wound care, memory care training, post-surgical care, palliative care, hospice care, and therapy (physical, occupational, and speech).

(304) 485-7447

Quality ratings

Measured by Centers for Medicare & Medicaid Services (CMS)

Overall rating Info The Overall CMS Rating combines results from health inspections, staffing levels and quality measures. Health inspections carry the most weight. Staffing and quality scores can increase or decrease the final rating based on performance compared to state and national standards.
▼ 11.1% Below WV avg. ▼ 11.1% Below WV avg.Click the badge to see the full State ranking.Click here to see the full State ranking.
Health Inspection Info Based on the results of the facility's three most recent standard inspections and any complaint investigations. CMS reviews the number, scope, and severity of deficiencies, with more recent findings weighted more heavily.
▼ 18.0% Below WV avg. ▼ 18.0% Below WV avg.Click the badge to see the full State ranking.Click here to see the full State ranking.
Staffing Info Measures average nursing staff hours per resident per day, including Registered Nurses (RNs) and total nursing staff. Ratings are adjusted based on the level of care residents require and are compared to state and national benchmarks.
▲ 26.6% Above WV avg. ▲ 26.6% Above WV avg.Click the badge to see the full State ranking.Click here to see the full State ranking.
Quality Measures Info Based on clinical and physical health indicators reported to CMS, such as hospital readmissions, falls, pressure ulcers, and improvements in mobility. These measures reflect how well residents' health needs are being managed.
▼ 17.4% Below WV avg. ▼ 17.4% Below WV avg.Click the badge to see the full State ranking.Click here to see the full State ranking.

Staffing hours breakdown

Info Daily nursing hours per resident by staff type, reported to CMS. Higher is generally better — compare this facility to state and national averages to see where staffing stands.

Hours per resident per day — compared to West Virginia state averages

Total nursing care / resident Info This home is ranked 16th out of 39 homes in West Virginia.

Total adjusted nursing hours per resident per day, combining RN, LPN, and aide time. CMS adjusts this for case-mix so facilities can be fairly compared.
3h 30m per day
Rank #16 / 39Nurse hours — State benchmarkedThis home is ranked 16th out of 39 homes in West Virginia.Shows adjusted nurse hours per resident per day benchmarked to the West Virginia average, with a ranking across 39 West Virginia SNFs. More hours mean more direct care. The national average is about 3.5 hrs; below 3.0 is a red flag.Click the rank badge to see the full State ranking.Click here to see the full State ranking.
This facility West Virginia avg (3h 27m per day)
vs West Virginia avg
+2%

4 of 6 metrics below state avg

Standout metric LPN / LVN is +5% above state avg
Staff type Hours / Day / Resident vs state avg
Registered Nurse (RN) Info RNs hold the highest nursing license and can assess residents, interpret test results, and direct care plans. More RN hours per day often signals stronger clinical oversight and faster response to health changes. 24m per day ▼ 43% State avg: 42m per day · National avg: 41m per day
LPN / LVN Info Licensed Practical Nurses (LPNs) or Licensed Vocational Nurses (LVNs) deliver routine hands-on care — medication administration, wound dressing, and monitoring vital signs. They work under RN supervision and make up a large share of daily bedside care. 58m per day ▲ 5% State avg: 55m per day · National avg: 52m per day
Nurse Aide Info Certified Nurse Aides (CNAs) provide the most direct day-to-day assistance: bathing, dressing, feeding, and mobility. Nurse aide hours are typically the largest staffing category and directly affect residents' quality of life. 1h 58m per day ▼ 5% State avg: 2h 4m per day · National avg: 2h 20m per day
Total Nursing (Weekend) Info Combined nursing hours (RN + LPN + Nurse Aide) per resident per day on weekends. Staffing often drops on weekends — this figure reveals whether the facility maintains adequate coverage outside of weekday hours. 2h 46m per day ▼ 13% State avg: 3h 11m per day · National avg: 3h 26m per day
Physical Therapist Info Hours per resident per day provided by licensed Physical Therapists (PTs) or PT Assistants. PT services help residents recover mobility after injury or illness and are especially important for post-acute (short-stay) rehabilitation. 3m per day ■ Avg State avg: 3m per day · National avg: 4m per day
RN (Weekend) Info Registered nurse hours specifically on weekends. Facilities sometimes reduce RN presence on Saturdays and Sundays — a low weekend RN figure compared to weekday hours can indicate reduced clinical oversight when most administrative staff are absent. 9m per day ▼ 61% State avg: 23m per day · National avg: 28m per day

Capacity and availability

Avg. Length of Stay
107 days

Who this home usually serves

TYPE OF STAY

Primarily short stays

Residents typically stay for brief periods, with frequent admissions and discharges throughout the year.

Breakdown by payment type

Medicare

26% of new residents, usually for short-term rehab.

Typical stay 1 - 2 months

Private pay

74% of new residents, often for short stays.

Typical stay 14 days

Finances and operations

Privately-owned community
Operated by a business corporation.
Home revenue
$18.0M
Profit
$2.4M
Privately-owned community Operated by a business corporation.
Home revenue
$18.0M Rank #14 / 39Revenue — State benchmarkedThis home is ranked 14th out of 39 homes in West Virginia.Shows this facility's annual revenue compared to the West Virginia SNF average. Higher revenue generally means more resources for staffing and capital — read alongside Payroll %.Click the rank badge to see the full State ranking.Click here to see the full State ranking.
Profit
$2.4M
Payroll costs Info The portion of the home's budget spent on staff, including nurses, caregivers, and other employees who support care and operations. Rank #18 / 39Payroll — State benchmarkedThis home is ranked 18th out of 39 homes in West Virginia.Shows total annual staff payroll benchmarked to the West Virginia average. Higher payroll investment relative to peers often signals better staffing and less reliance on cheaper contract labor.Click the rank badge to see the full State ranking.Click here to see the full State ranking.
$6.5M
36.1% of revenue Rank #27 / 39Payroll % — State benchmarkedThis home is ranked 27th out of 39 homes in West Virginia.Shows payroll as a percentage of revenue versus the West Virginia average. Well-run West Virginia SNFs typically land around 43–58% — the top third Statewide. Below 25% may signal understaffing or heavy agency use — read with Staffing ratings.Click the rank badge to see the full State ranking.Click here to see the full State ranking.
Other operating costs Info All remaining costs needed to run the home, such as food, utilities, building maintenance, supplies and administrative expenses.
$9.1M
Total costs $15.6M
Bed community size
105-bed community Rank #15 / 41Bed count — State benchmarkedThis home is ranked 15th out of 41 homes in West Virginia.Shows this facility's certified or reported bed count compared to other West Virginia SNFs. Larger communities may offer more amenities, programs, and on-site services for residents and families.Click the rank badge to see the full State ranking.Click here to see the full State ranking.
A larger shared setting that may offer more common spaces and organized community services.
Years in operation
1 year in operation Rank #8 / 31Years in operation — State benchmarkedThis home is ranked 8th out of 31 homes in West Virginia.Shows how long this facility has been in operation compared to other West Virginia SNFs. Longer operating histories may benefit residents, families, and staff.Click the rank badge to see the full State ranking.Click here to see the full State ranking.
A newer community that may feature more recent facilities and programs.
Walk Score
Walk Score: 10 / 100 Rank #34 / 39Walk Score — State benchmarkedThis home is ranked 34th out of 39 homes in West Virginia.Shows how walkable this facility's neighborhood is compared to the average Walk Score across West Virginia SNFs. Higher scores benefit residents, families, and staff.Click the rank badge to see the full State ranking.Click here to see the full State ranking.
Car-dependent. Most errands require a car, with limited nearby walkable options.

About this community

Occupancy

Occupancy rate
100%
Rank #24 / 39Occupancy rate — State benchmarkedThis home is ranked 24th out of 39 homes in West Virginia.Shows this facility's occupancy rate versus the West Virginia average, with its Statewide rank out of 39. Higher occupancy signals strong local demand and financial stability.Click the rank badge to see the full State ranking.Click here to see the full State ranking.
Higher than the West Virginia average: 89.9%
Occupied beds
105 / 105
Average residents per home in West Virginia 77 per day

License Details

Facility TypeNursing Home (nh)
StatusActive
IssuanceOctober 1, 2024
ExpirationSeptember 30, 2025
CountyWood
License Number56

Ownership & Operating Entity

Worthington Healthcare Center is administrated by Randy Wright.

Type Of Units

Supplemental Security Income Beds Units available for residents receiving Supplemental Security Income (SSI) benefits.
0 units
Certified LTC
105 units
Total beds
105 units

Contact Information

Fax(304)485-9344

What does this home offer?

Pets allowed icon
Pets allowed icon

Pets Allowed

Building type icon
Building type icon

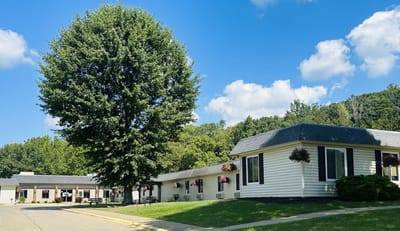
Building Type: Single-story

Transportation services icon

Transportation Services

Fitness and recreation icon

Fitness and Recreation

Types of Care at Worthington Healthcare Center

Assisted Living Memory Care Nursing Home

Contact Worthington Healthcare Center

Inspection History

In West Virginia, the Department of Health and Human Resources, Office of Health Facility Licensure is responsible for the unannounced inspection and certification of all senior care facilities.

Inspection Scorecard Info This scorecard compares key inspection, citation, and complaint metrics at this facility against the West Virginia state average. Metrics rated ≥15% worse than average are highlighted in red; those ≥15% better are highlighted in green.

Latest Inspection February 4, 2025

Deficiencies Info Deficiencies are formal regulatory issues recorded during state inspections.

Metric This Facility WV Average vs. WV Avg
Total deficiencies Info Formal regulatory issues recorded by inspectors across all inspection types. 305 249 This facility has 22% more total deficiencies than a typical West Virginia nursing home (305 vs. WV avg 249). Click this badge to view the full West Virginia ranking.↑ 22% worse
Deficiencies per inspection Info Average deficiencies per inspection. 16.1 14.6 This facility has 10% more deficiencies per inspection than a typical West Virginia nursing home (16.1 vs. WV avg 14.6). Click this badge to view the full West Virginia ranking.↑ 10% worse

Inspections Info State inspections evaluate whether the facility meets health and safety standards.

Metric This Facility WV Average vs. WV Avg
Total inspections Info Combined count of all routine and focused inspections. Excludes complaint investigations. 19 17 This facility has 12% more total inspections than a typical West Virginia nursing home (19 vs. WV avg 17). Click this badge to view the full West Virginia ranking.↑ 12% worse
Health investigations Info On-site investigations focused on resident health and care quality. 16
Life safety inspections Info Inspections focused on building safety — fire prevention, emergency egress, and similar. 3

Inspection Reports Summary Info An editor-reviewed summary of the themes and findings across this facility's recent inspection reports.

The most recent inspections on April 2, 2025 identified deficiencies related to fire safety, including failure to maintain fire dampers and conduct required fire drills, as well as issues with medication administration, food safety, and advance care planning. Earlier inspections showed a pattern of deficiencies involving resident care, documentation, infection control, and regulatory compliance, with several substantiated complaints including immediate jeopardy findings related to supervision and abuse prevention in 2024. Complaint investigations often found issues with care planning, medication management, and staff screening, though many complaints were unsubstantiated. Enforcement actions included immediate jeopardy declarations that were abated, but no fines or license suspensions were listed in the available reports. The facility’s record shows ongoing challenges with compliance in clinical care and safety areas, with some corrective actions accepted and partial improvements noted over time.

Read the full inspection reports for this facility, including detailed findings and corrective actions.

Show Inspection Reports

Health Inspection History

Inspections Since 2022
Total health inspections 8

West Virginia average 4.8


Last Health inspection on Apr 2025

Total health citations
38 Rank #17 / 41Health citations — State benchmarkedThis home is ranked 17th out of 41 homes in West Virginia.Shows this facility's total health deficiency citations benchmarked to the West Virginia State average, with a ranking across all 41 WV SNFs. Lower citation counts earn a better rank.Click the rank badge to see the full State ranking.Click here to see the full State ranking.

West Virginia average 43.1

Citations per inspection
4.75 Rank #2 / 41Citations per inspection — State benchmarkedThis home is ranked 2nd out of 41 homes in West Virginia.Shows average deficiency citations per CMS inspection for this facility versus the West Virginia mean across 41 SNFs with citation data. Lower is better.Click the rank badge to see the full State ranking.Click here to see the full State ranking.

West Virginia average 9.25


Health citations are formal notices following inspections when they fail to comply with safety and care standards.

19 of 38 citations resulted from standard inspections; 18 of 38 resulted from complaint investigations; and 1 of 38 came from combined inspections (standard and complaint).

Breakdown of citation severity (last 4 years)
Critical Health citations
4
400% worse than West Virginia average

West Virginia average: 0.8


Serious Health citations
0
100% better than West Virginia average

West Virginia average: 0.5

4 critical citations West Virginia average: 0.8

0 serious citations West Virginia average: 0.5

34 moderate citations West Virginia average: 41.5

0 minor citations West Virginia average: 0.3
Citations history (last 4 years)
Nutrition moderate citation Apr 02, 2025
Corrected

Quality of Care moderate citation Apr 02, 2025
Corrected

Quality of Care moderate citation Apr 02, 2025
Corrected

Quality of Care moderate citation Apr 02, 2025
Corrected

Financial Assistance for
Nursing Home in West Virginia

Worthington Healthcare Center is located in Parkersburg, West Virginia.
Here are the financial assistance programs available to residents in West Virginia.

Get Financial aid guidance

Aged and Disabled Waiver

WV Medicaid A&D Waiver

Age 65+ or disabled
General West Virginia resident, Medicaid-eligible, nursing home-level care need.
Income Limits (2025) ~$2,829/month 300% FBR, individual
Asset Limits $2,000 (individual), $3,000 (couple).
WV

Rural state; limited providers in some areas.

Benefits
Personal care (5-7 hours/day) Respite (240 hours/year) Adult day care (~$60/day) Home aides

West Virginia Lighthouse Program

WV Lighthouse

Age 60+
General West Virginia resident, at risk of nursing home.
Income Limits ~$2,000/month individual, varies
Asset Limits $5,000 individual
WV

Limited funding; rural focus.

Benefits
In-home care (3-5 hours/week) Respite (up to 10 days/year) Transportation (~5 trips/month)

Older Americans Act (OAA) Services

West Virginia OAA Services

Age 60+
General WV resident; no income/asset limits.
Income Limits (2025) None; donations encouraged.
Asset Limits Not assessed.
WV

Includes Meals on Wheels; serves ~20,000 annually; rural emphasis.

Benefits
Meals (~$5-$7/meal) Transportation Homemaker services (~4 hours/week) Respite (~5 days/year) Legal aid

Medicare Savings Program (MSP)

West Virginia Medicare Savings Program

Age 65+ or disabled
General WV resident, Medicare Part A/B.
Income Limits (2025) ~$2,510/month (QMB), ~$3,380/month (SLMB), ~$3,598/month (QI)—individual.
Asset Limits $9,430 (individual), $14,130 (couple).
WV

Includes Extra Help for Part D; no waitlist.

Benefits
Covers Part B premiums ($174.70/month) Deductibles ($240/year) Copays (~20%)

Low-Income Energy Assistance Program (LIEAP)

West Virginia LIEAP

Age 60+ prioritized
General WV resident, low-income household.
Income Limits (2025) ~$3,970/month 185% FPL
Asset Limits Not assessed.
WV

Covers gas, electric, wood; emergency aid available.

Benefits
Heating aid ($300-$1,000/season) Emergency aid ($500 max)

Family Caregiver Support Program (FCSP)

West Virginia Family Caregiver Support Program

Age
General Caregivers of 60+ needing care or 55+ caregivers of others; WV resident; 2+ ADLs.
Income Limits (2025) No strict cap; prioritizes low-income ~$24,980/year
Asset Limits Not assessed.
WV

Includes grandparent caregivers; serves ~1,500 annually.

Benefits
Respite (4-6 hours/week or 5 days/year) Adult day care ($60/day) Training Supplies (~$500/year)

VA Aid and Attendance (A&A) and Housebound Benefits

West Virginia VA Aid and Attendance/Housebound

Age 65+ or disabled veteran/spouse
General WV resident, wartime service, ADL help (A&A) or homebound.
Income Limits (2025) Net income < ~$1,984/month (veteran with dependent, A&A); pension offsets income.
Asset Limits ~$155,356 net worth
WV

High rural veteran use; supports care costs.

Benefits
Cash (~$1,433-$2,642/month veteran, ~$951-$1,318 spouse) for care costs

Homestead Exemption for Seniors

West Virginia Homestead Exemption

Age 65+ or totally disabled
General WV resident, homeowner (homestead).
Income Limits (2025) None; tax-based eligibility.
Asset Limits Not assessed.
WV

$20,000 assessed value exemption; saves ~$200-$400/year.

Benefits
Tax exemption (~$200-$400/year avg.)

Senior Farmers’ Market Nutrition Program (SFMNP)

West Virginia SFMNP

Age 60+
General WV resident, low-income.
Income Limits (2025) ~$2,322/month 185% FPL
Asset Limits Not assessed.
WV

Vouchers (~$50/season); serves ~10,000 annually.

Benefits
Vouchers (~$50/season) for produce at farmers’ markets

Places of interest near Worthington Healthcare Center

Address 3.6 miles from city center Info Estimated distance in miles from Parkersburg's city center to Worthington Healthcare Center's address, calculated via Google Maps. — 1.68 miles to nearest hospital (Encompass Health Rehabilitation Hospital of Parkersburg)

Calculate Travel Distance to Worthington Healthcare Center

Add your location

Address

Staffing Data

Reporting period: April 1 – June 30, 2025 (Q2 2025). Source: CMS Payroll-Based Journal report.

Total staff 145
Employees 107
Contractors 38
Staff to resident ratio 1.56:1
5% better than West Virginia average
West Virginia average ratio: 1.48:1 West Virginia average ratio: 1.48:1See full West Virginia ranking
Avg staff/day 48
Average shift 8.4 hours
0% compared with West Virginia average
West Virginia average: 8.4 hours West Virginia average shift: 8.4 hoursSee full West Virginia ranking
Total staff hours (quarter) 36,549

Nursing staff breakdown

Q2 2025 · Apr 1 – Jun 30 More info This data comes from the CMS Payroll-Based Journal report covering April 1 – June 30, 2025.
Registered Nurse

Manages medical care and health needs.

Total count 14
Average shift length Info Average shift length. Calculated as total hours divided by days worked and average staff per day. 8.2 hours

This role is partially covered by contractors.

Licensed Practical Nurse

Assists with medical care and medications.

Total count 28
Average shift length Info Average shift length. Calculated as total hours divided by days worked and average staff per day. 9.6 hours

This role is partially covered by contractors.

Certified Nursing Assistant

Helps with daily care and mobility.

Total count 52
Average shift length Info Average shift length. Calculated as total hours divided by days worked and average staff per day. 8.7 hours

This role is partially covered by contractors.

Contractor staffing

Q2 2025 · Apr 1 – Jun 30 More info This data comes from the CMS Payroll-Based Journal report covering April 1 – June 30, 2025.

Total hours from contractors

12.5%

4,572 contractor hours this quarter

Licensed Practical Nurse: 12 Physical Therapy Aide: 4 Speech Language Pathologist: 4 Certified Nursing Assistant: 4 Physical Therapy Assistant: 3 Registered Nurse: 3 Qualified Social Worker: 3 Qualified Activities Professional: 2 Respiratory Therapy Technician: 1 Mental Health Service Worker: 1 Medical Director: 1

Staff by category

Q2 2025 · Apr 1 – Jun 30 More info This data comes from the CMS Payroll-Based Journal report covering April 1 – June 30, 2025.
Certified Nursing Assistant 48 4 52 16,488 91 100% 8.7
Licensed Practical Nurse 16 12 28 6,574 91 100% 9.6
Registered Nurse 11 3 14 3,206 91 100% 8.2
Other Dietary Services Staff 4 0 4 1,945 91 100% 7.9
Clinical Nurse Specialist 10 0 10 1,691 70 77% 7.7
Physical Therapy Aide 0 4 4 897 67 74% 7.2
Speech Language Pathologist 0 4 4 710 69 76% 5.9
Mental Health Service Worker 2 1 3 562 60 66% 7.3
Nurse Practitioner 2 0 2 520 60 66% 8
Administrator 1 0 1 512 64 70% 8
Physical Therapy Assistant 0 3 3 482 63 69% 7.6
Dietitian 1 0 1 444 57 63% 7.8
Dental Services Staff 1 0 1 440 57 63% 7.7
RN Director of Nursing 1 0 1 414 55 60% 7.5
Respiratory Therapy Technician 0 1 1 406 65 71% 6.2
Qualified Social Worker 1 3 4 404 69 76% 5.8
Nurse Aide in Training 4 0 4 403 16 18% 7.4
Occupational Therapy Aide 4 0 4 304 32 35% 6.6
Medical Director 0 1 1 95 31 34% 3.1
Occupational Therapy Assistant 1 0 1 48 24 26% 2
Qualified Activities Professional 0 2 2 8 2 2% 4
52 Certified Nursing Assistant
% of Days 100%
28 Licensed Practical Nurse
% of Days 100%
14 Registered Nurse
% of Days 100%
4 Other Dietary Services Staff
% of Days 100%
10 Clinical Nurse Specialist
% of Days 77%
4 Physical Therapy Aide
% of Days 74%
4 Speech Language Pathologist
% of Days 76%
3 Mental Health Service Worker
% of Days 66%
2 Nurse Practitioner
% of Days 66%
1 Administrator
% of Days 70%
3 Physical Therapy Assistant
% of Days 69%
1 Dietitian
% of Days 63%
1 Dental Services Staff
% of Days 63%
1 RN Director of Nursing
% of Days 60%
1 Respiratory Therapy Technician
% of Days 71%
4 Qualified Social Worker
% of Days 76%
4 Nurse Aide in Training
% of Days 18%
4 Occupational Therapy Aide
% of Days 35%
1 Medical Director
% of Days 34%
1 Occupational Therapy Assistant
% of Days 26%
2 Qualified Activities Professional
% of Days 2%

Facility Characteristics

Source: CMS Long-Term Care Facility Characteristics (Data as of Jan 2026)

Total residents 93
Medicare
10
10.8% of residents
Medicaid
74
79.6% of residents
Private pay or other
9
9.7% of residents
Programs & Services
Residents Group

Residents meet regularly to discuss policies, care quality, and activities

Active Resident Council

Organized group of residents that meets regularly to discuss facility policies, quality of life, and activities.

Quality of care over time

These measures show how residents usually do over time at this home, based on health outcomes and preventive care.

High-risk clinical events score Info A composite score based on pressure ulcers, falls with injury, weight loss, walking ability decline, and activities of daily living decline. 8.1
28% better than West Virginia average

West Virginia average: 11.3

Functional decline score Info A composite score based on activities of daily living decline, walking ability decline, and incontinence. 15.6
26% better than West Virginia average

West Virginia average: 21.1

Long-stay resident measures
Above average West Virginia avg: 3.2 Info CMS star rating based on long-stay quality measure performance. 5 stars = significantly above average, 1 star = significantly below average.
Need for Help with Daily Activities Increased Info Percent of long-stay residents whose need for help with daily activities has increased 12.0%
36% better than West Virginia average

West Virginia average: 18.9%

Walking Ability Worsened Info Percent of long-stay residents whose ability to move independently worsened 13.0%
41% better than West Virginia average

West Virginia average: 21.8%

Low Risk Residents with Bowel/Bladder Incontinence Info Percent of low risk long-stay residents who lose control of their bowels or bladder 22.0%
In line with West Virginia average

West Virginia average: 22.6%

Falls with Major Injury Info Percent of long-stay residents experiencing one or more falls with major injury 2.7%
39% better than West Virginia average

West Virginia average: 4.5%

High Risk Residents with Pressure Ulcers Info Percent of long-stay high risk residents with pressure ulcers 5.2%
5% worse than West Virginia average

West Virginia average: 4.9%

Urinary Tract Infection Info Percent of long-stay residents with a urinary tract infection 1.2%
38% better than West Virginia average

West Virginia average: 2.0%

Lost Too Much Weight Info Percent of long-stay residents who lose too much weight 7.6%
16% worse than West Virginia average

West Virginia average: 6.6%

Depressive Symptoms Info Percent of long-stay residents who have depressive symptoms 10.0%
63% worse than West Virginia average

West Virginia average: 6.1%

Antipsychotic Use Info Percent of long-stay residents who received an antipsychotic medication 4.7%
65% better than West Virginia average

West Virginia average: 13.2%

Pneumococcal Vaccine Info Percent of long-stay residents assessed and appropriately given the pneumococcal vaccine 99.7%
In line with West Virginia average

West Virginia average: 96.8%

Influenza Vaccine Info Percent of long-stay residents assessed and appropriately given the seasonal influenza vaccine 100.0%
In line with West Virginia average

West Virginia average: 97.6%

Short-stay resident measures
Significantly below average West Virginia avg: 2.0 Info CMS star rating based on short-stay quality measure performance. 5 stars = much above average, 1 star = much below average.
Pneumococcal Vaccine Info Percent of short-stay residents assessed and appropriately given the pneumococcal vaccine 74.9%
5% worse than West Virginia average

West Virginia average: 78.6%

Antipsychotic medication increase Info Percent of short-stay residents who newly received an antipsychotic medication 0.0%
100% better than West Virginia average

West Virginia average: 1.0%

Influenza Vaccine Info Percent of short-stay residents assessed and appropriately given the seasonal influenza vaccine 84.0%
6% better than West Virginia average

West Virginia average: 79.4%

Re-hospitalized after SNF stay Info Percentage of short-stay residents who were re-hospitalized after their nursing home admission. 33.5%
46% worse than West Virginia average

West Virginia average: 23.0%

Emergency department visits Info Percentage of short-stay residents who had an outpatient emergency department visit. 10.0%
19% better than West Virginia average

West Virginia average: 12.4%

Falls with major injury Info Percentage of SNF residents who experience falls with major injury during their stay. 0.0%
100% better than West Virginia average

West Virginia average: 0.8%

Ability to care for self at discharge Info Percentage of residents at or above expected ability to care for themselves at discharge. 56.7%
6% better than West Virginia average

West Virginia average: 53.7%

Successful return to home or community Info Rate of successful return to home or community from a skilled nursing facility. 41.5%
18% worse than West Virginia average

West Virginia average: 50.6%

Penalties and fines

Federal penalties imposed by CMS for regulatory violations, including civil money penalties (fines) and denials of payment for new Medicare/Medicaid admissions.

Source: CMS Penalties Database (Data as of Jan 2026)

Total fines amount $104K Rank #39 / 41Federal fines — State benchmarkedThis home is ranked 39th out of 41 homes in West Virginia.Shows this facility's cumulative CMS federal fine dollars versus the West Virginia average among facilities with fines, and where it ranks among 41 skilled nursing facilities in the pool. Lower total dollars mean a better rank.Click the rank badge to see the full State ranking.Click here to see the full State ranking.
93% higher than West Virginia average

West Virginia average: $54K

Number of fines 1
35% fewer fines than West Virginia average

West Virginia average: 1.5

Payment Denials Info Serious action where Medicare and/or Medicaid temporarily stops payments for new residents until issues are fixed. 1
2199% more payment denials than West Virginia average

West Virginia average: 0.0

Fines amount comparison
This facility $104K
West Virginia average $54K
Penalty History

Penalties are imposed by CMS for violations of federal nursing home regulations.

2 penalties in the past 3 years

Multiple penalties were reported in the last 3 years.

Civil Money Penalty Info Fines imposed for noncompliance, which can be assessed per day or per instance of violation. Feb 23, 2024
$104K
Payment Denial Info Serious action where Medicare and/or Medicaid temporarily stops payments for new residents until issues are fixed. Feb 23, 2024
34 days

Last updated: Jan 2026

Guides for Better Senior Living

Care Cost Calculator: See Prices in Your Area

Nursing Home Data Explorer

Don’t Wait Too Long: 7 Red Flag Signs Your Parent Needs Assisted Living Now

The True Cost of Assisted Living in 2025 – And How Families Are Paying For It

Understanding Senior Living Costs: Pricing Models, Discounts & Financial Assistance

Frequently Asked Questions about Worthington Healthcare Center

What neighborhood is Worthington Healthcare Center in?

Worthington Healthcare Center is in the North Parkersburg neighborhood of Parkersburg.

Is Worthington Healthcare Center in a walkable area?

Worthington Healthcare Center has a walk score of 10. Car-dependent. Most errands require a car, with limited nearby walkable options.

What is the license number of Worthington Healthcare Center?

According to WV state health department records, Worthington Healthcare Center's license number is 56.

When does Worthington Healthcare Center's license expire?

According to WV state health department records, Worthington Healthcare Center's license expires on September 30, 2025.

What is the occupancy rate at Worthington Healthcare Center?

Worthington Healthcare Center's occupancy is 100%.

Who is the administrator of Worthington Healthcare Center?

Randy Wright is the administrator of Worthington Healthcare Center.

How many beds does Worthington Healthcare Center have?

Worthington Healthcare Center has 105 beds.

Explore Open Rooms
1 Contact details
2 What type of senior care service are you looking for?
3 What budget do you have in mind for senior care?
4 How soon do you need to find care?
5 Additional details

Thank you for your interest!

Our team will be in touch shortly to help with next steps.