Meadow Lake Senior Living – Tyler
Nursing Home, Assisted Living, Independent Living, Memory Care & Respite Care · Tyler, TX
CMS overall rating Info CMS (the Centers for Medicare & Medicaid Services) is the federal agency that rates nursing home quality. Its Overall Rating runs from 1 to 5 stars, combining health inspections, staffing, and quality measures, with inspections weighted most heavily.

Meadow Lake Senior Living – Tyler

Nursing Home, Assisted Living, Independent Living, Memory Care & Respite Care · Tyler, TX
CMS overall rating Info CMS (the Centers for Medicare & Medicaid Services) is the federal agency that rates nursing home quality. Its Overall Rating runs from 1 to 5 stars, combining health inspections, staffing, and quality measures, with inspections weighted most heavily.
Calculator: See prices in your area
Meadow Lake Senior Living – Tyler accepts Medicare and private pay.

Overview of Meadow Lake Senior Living – Tyler

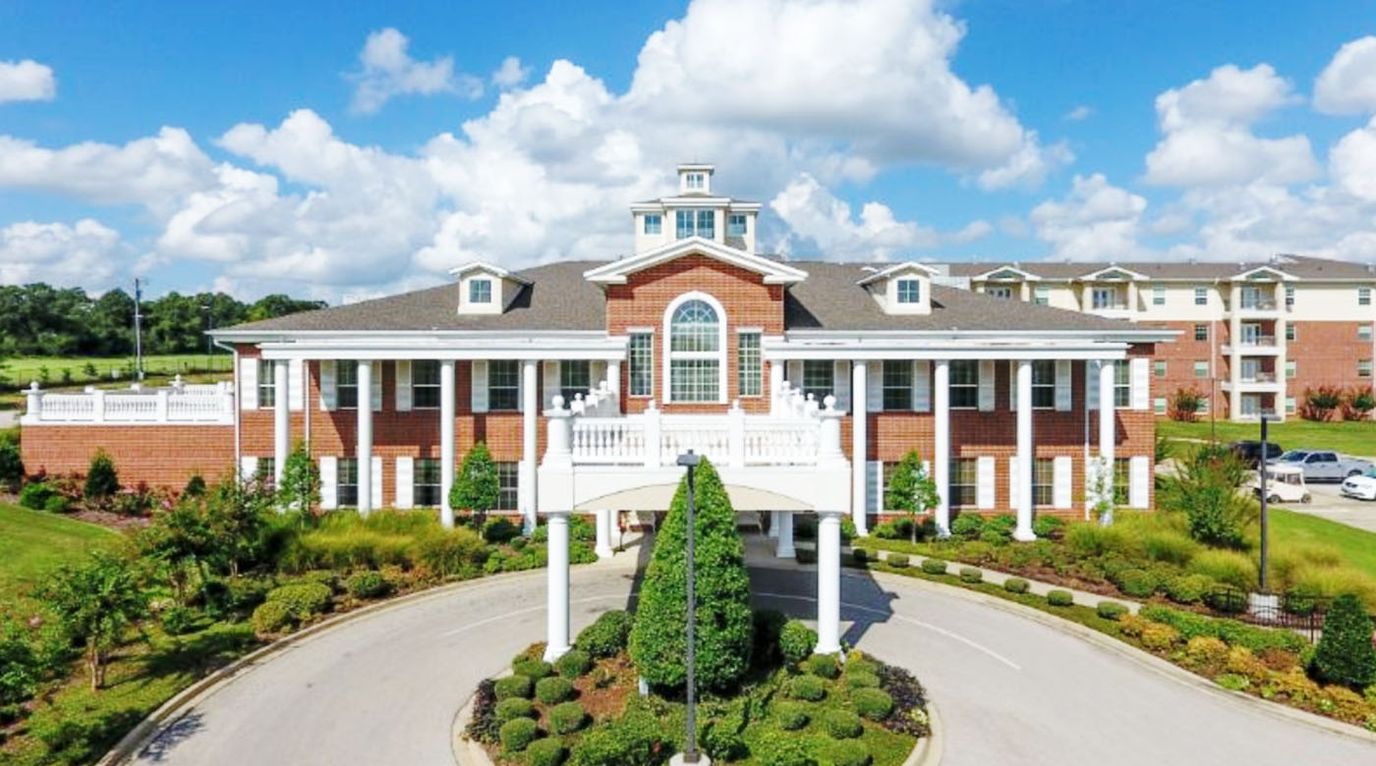
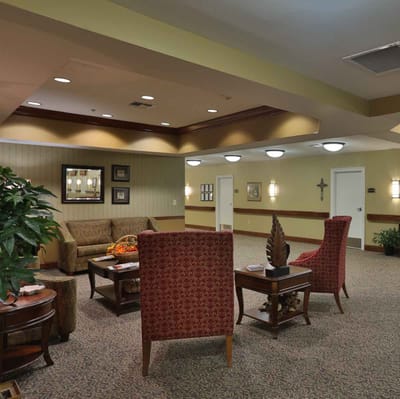
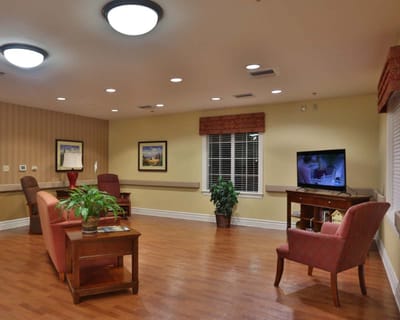
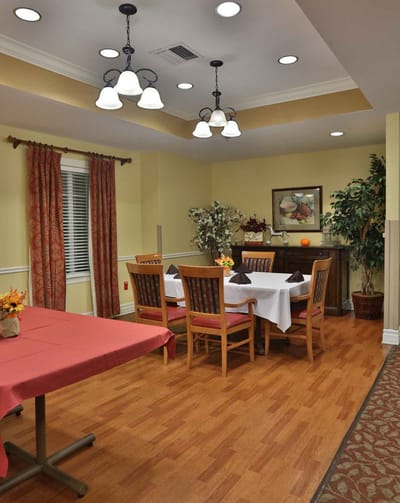
Meadow Lake Senior Living is a vibrant senior living community for adults and seniors who wish to retire in a luxurious community. Offering residential assisted living, independent living, memory care, and skilled nursing services– the nurturing environment empowers and enhances the quality of life for residents by providing tailored care to each unique individual. Residents are given the freedom and choice to build a lifestyle on their terms with the unwavering support of the professional staff.

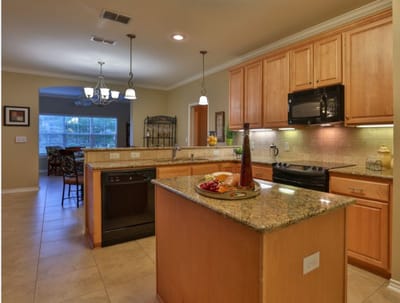
Meadow Lake’s all-inclusive amenities include delicious and nutritious daily meals, weekly housekeeping and laundry, transportation to and from, specialized programs, social gatherings, and educational activities. 

(903) 526-5599

Quality ratings

Measured by Centers for Medicare & Medicaid Services (CMS)

Overall rating Info The Overall CMS Rating combines results from health inspections, staffing levels and quality measures. Health inspections carry the most weight. Staffing and quality scores can increase or decrease the final rating based on performance compared to state and national standards.
▲ 78.9% Above TX avg. ▲ 78.9% Above TX avg.TX average: 2.8Click the badge to see the full State ranking.Click here to see the full State ranking.
Health Inspection Info Based on the results of the facility's three most recent standard inspections and any complaint investigations. CMS reviews the number, scope, and severity of deficiencies, with more recent findings weighted more heavily.
▲ 80.9% Above TX avg. ▲ 80.9% Above TX avg.TX average: 2.8Click the badge to see the full State ranking.Click here to see the full State ranking.
Staffing Info Measures average nursing staff hours per resident per day, including Registered Nurses (RNs) and total nursing staff. Ratings are adjusted based on the level of care residents require and are compared to state and national benchmarks.
▲ 88.5% Above TX avg. ▲ 88.5% Above TX avg.TX average: 2.1Click the badge to see the full State ranking.Click here to see the full State ranking.
Quality Measures Info Based on clinical and physical health indicators reported to CMS, such as hospital readmissions, falls, pressure ulcers, and improvements in mobility. These measures reflect how well residents' health needs are being managed.
▲ 33.2% Above TX avg. ▲ 33.2% Above TX avg.TX average: 3.8Click the badge to see the full State ranking.Click here to see the full State ranking.

Staffing hours breakdown

Info Daily nursing hours per resident by staff type, reported to CMS. Higher is generally better — compare this facility to state and national averages to see where staffing stands.

Hours per resident per day — compared to Texas state averages

Total nursing care / resident Info This home is ranked 56th out of 296 homes in Texas for nurse hours. Total adjusted nursing hours per resident per day, combining RN, LPN, and aide time. CMS adjusts this for case-mix so facilities can be fairly compared.
4h 18m per day
Rank #56 / 296Nurse hours — State benchmarkedThis home is ranked 56th out of 296 homes in Texas. Shows adjusted nurse hours per resident per day benchmarked to the Texas average, with a ranking across 296 Texas facilities. More hours mean more direct care. The national average is about 3.5 hrs; below 3.0 is a red flag.Rankings are based only on facilities in Texas that report data for that category. Facilities without available data are excluded from the ranking.Click the rank badge to see the full State ranking.Click here to see the full State ranking.
This facility Texas avg (3h 38m per day)
vs Texas avg
+18%

2 of 6 metrics below state avg

Standout metric Registered Nurse (RN) is +138% above state avg
Staff typeHours / Day / Residentvs state avg
Registered Nurse (RN) Info RNs hold the highest nursing license and can assess residents, interpret test results, and direct care plans. More RN hours per day often signals stronger clinical oversight and faster response to health changes. 1h 2m per day ▲ 138% State avg: 26m per day · National avg: 41m per day
LPN / LVN Info Licensed Practical Nurses (LPNs) or Licensed Vocational Nurses (LVNs) deliver routine hands-on care — medication administration, wound dressing, and monitoring vital signs. They work under RN supervision and make up a large share of daily bedside care. 26m per day ▼ 54% State avg: 57m per day · National avg: 52m per day
Nurse Aide Info Certified Nurse Aides (CNAs) provide the most direct day-to-day assistance: bathing, dressing, feeding, and mobility. Nurse aide hours are typically the largest staffing category and directly affect residents' quality of life. 2h 46m per day ▲ 37% State avg: 2h 1m per day · National avg: 2h 21m per day
Weekend Total Nursing Info Combined nursing hours (RN + LPN + Nurse Aide) per resident per day on weekends. Staffing often drops on weekends — this figure reveals whether the facility maintains adequate coverage outside of weekday hours. 3h 42m per day ▲ 24% State avg: 2h 59m per day · National avg: 3h 26m per day
Physical Therapist Info Hours per resident per day provided by licensed Physical Therapists (PTs) or PT Assistants. PT services help residents recover mobility after injury or illness and are especially important for post-acute (short-stay) rehabilitation. 2m per day ▼ 43% State avg: 4m per day · National avg: 4m per day
Weekend RN Info Registered nurse hours specifically on weekends. Facilities sometimes reduce RN presence on Saturdays and Sundays — a low weekend RN figure compared to weekday hours can indicate reduced clinical oversight when most administrative staff are absent. 41m per day ▲ 96% State avg: 21m per day · National avg: 29m per day

Capacity and availability

This home usually has availability

Higher occupancy than the Texas average: 63.5%
Occupancy rate
80.1% Rank #72 / 304Occupancy rate — State benchmarkedThis home is ranked 72nd out of 304 homes in Texas. Shows this facility's occupancy rate versus the Texas average, with its Statewide rank out of 304. Higher occupancy signals strong local demand and financial stability.Rankings are based only on facilities in Texas that report data for that category. Facilities without available data are excluded from the ranking.Click the rank badge to see the full State ranking.Click here to see the full State ranking.
Avg. Length of Stay
70 days
Bed community size
20-bed community Rank #804 / 988Bed count — State benchmarkedThis home is ranked 804th out of 988 homes in Texas. Shows this facility's certified or reported bed count compared to other Texas facilities. Larger communities may offer more amenities, programs, and on-site services for residents and families.Rankings are based only on facilities in Texas that report data for that category. Facilities without available data are excluded from the ranking.Click the rank badge to see the full State ranking.Click here to see the full State ranking.
A smaller, more intimate setting that may offer a quieter environment and closer staff-resident interactions.
Years in operation
15 years in operation Rank #312 / 583Years in operation — State benchmarkedThis home is ranked 312th out of 583 homes in Texas. Shows how long this facility has been in operation compared to other Texas facilities. Longer operating histories may benefit residents, families, and staff.Rankings are based only on facilities in Texas that report data for that category. Facilities without available data are excluded from the ranking.Click the rank badge to see the full State ranking.Click here to see the full State ranking.
A community with a solid operating history and experience delivering ongoing care.
Walk Score
Walk Score: 33 / 100 Rank #884 / 1391Walk Score — State benchmarkedThis home is ranked 884th out of 1391 homes in Texas. Shows how walkable this facility's neighborhood is compared to the average Walk Score across Texas facilities. Higher scores benefit residents, families, and staff.Rankings are based only on facilities in Texas that report data for that category. Facilities without available data are excluded from the ranking.Click the rank badge to see the full State ranking.Click here to see the full State ranking.
Somewhat walkable. A few nearby services may be reachable on foot, but most trips require transportation.
BBB Rating
BBB Rating: A+ (Accredited)
An independent rating from the Better Business Bureau based on factors such as complaint history, transparency, and business practices.
How BBB ratings work

About this community

Awards

5-Star Rating from Centers for Medicare & Medicaid Services

License Details

License Number104686

Safety & Compliance

Secured Perimeter
Safety FeaturesEmergency response system.

Staffing

Key information about the people who lead and staff this community.

Leadership

ContactDavid Gustafson, Executive Director

Payment & Insurance

1 service
Accept Medicare

Therapy & Rehabilitation

2 services
Rehabilitation Services
Respite Care

Staffing & Medical

1 service
24-Hour Staffing

Amenities & Lifestyle

Multiple Dining Venues
Five-Acre Lake
Walking Trails
Rustic Community Lodge
Clubs
Hobby Groups
Private Dining Room
Catering Services
Priority Access To Health Center
Personal Safe In Each Home
Exercise Area
Beauty Salon
Arts And Crafts
Library
Cards And Game Room
Gated Campus
Scheduled Transportation
Active Life Enrichment Program
ActivitiesActivities include clubs, classes, and hobby groups.

Dining & Nutrition

Food DescriptionFulfilling, mouth-watering, and nutritious meals are offered daily by a dining team who serves with excellence.

Contact Meadow Lake Senior Living – Tyler

Inspection History

In Texas, the Health and Human Services Commission (HHSC) is the primary regulatory body that conducts unannounced inspections and publishes quality reports for all long-term care homes.

Since 2023 · 3 years of data 4 citations

Inspection Scorecard Info This scorecard compares key inspection, citation, and complaint metrics at this facility against the Texas state average. Metrics rated ≥15% worse than average are highlighted in red; those ≥15% better are highlighted in green.

Since 2023 vs. Texas state average
Overall vs. TX average 0 Worse No metrics in this bucket. 2 Better Metrics better than Texas average:
• Total citations (33% below)
• Citations per year (35% below)
Latest Inspection September 24, 2025 Other An inspection that falls outside standard annual surveys and formal complaint investigations. May include administrative compliance checks, documentation reviews, focused surveys on specific concerns, or revisit surveys to verify prior corrections.

Citations Info Citations are formal regulatory issues recorded during state inspections.

This FacilityTX Averagevs. TX Avg
Total citations Info Formal regulatory issues recorded by inspectors across all inspection types. 46 This facility has 33% fewer total citations than a typical Texas nursing home (4 vs. TX avg 6).↓ 33% better
Citations per year Info Average citations per year since 2023. 1.32 This facility has 35% fewer citations per year than a typical Texas nursing home (1.3 vs. TX avg 2).↓ 35% better

Inspection Reports Summary Info An editor-reviewed summary of the themes and findings across this facility's recent inspection reports.

  • The most recent inspection on September 24, 2025, found no health deficiencies or complaints.
  • A May 19, 2025 complaint investigation cited failure to notify the physician and family after a resident’s fall, resulting in one deficiency and staff retraining.
  • A July 19, 2023 complaint investigation found two deficiencies for failing to timely report and investigate suspected abuse and injuries for two residents.

Health Inspection History

Inspections since 2023
Total health inspections 3

Texas average 7.4


Last Health inspection on May 2025

Total health citations
4 Rank #2 / 299Health citations — State benchmarkedThis home is ranked 2nd out of 299 homes in Texas. Shows this facility's total health deficiency citations benchmarked to the Texas State average, with a ranking across all 299 TX facilities. Lower citation counts earn a better rank.Rankings are based only on facilities in Texas that report data for that category. Facilities without available data are excluded from the ranking.Click the rank badge to see the full State ranking.Click here to see the full State ranking.

Texas average 25.9

Citations per inspection
1.33 Rank #2 / 299Citations per inspection — State benchmarkedThis home is ranked 2nd out of 299 homes in Texas. Shows average deficiency citations per CMS inspection for this facility versus the Texas mean across 299 facilities with citation data. Lower is better.Rankings are based only on facilities in Texas that report data for that category. Facilities without available data are excluded from the ranking.Click the rank badge to see the full State ranking.Click here to see the full State ranking.

Texas average 3.67


Health citations are formal notices following inspections when they fail to comply with safety and care standards.

3 of 4 citations resulted from standard inspections; and 1 of 4 resulted from complaint investigations.

Breakdown of citation severity (last 3 years)
Critical health citations
0
100% better than Texas average

Texas average: 2


Serious health citations
0
100% better than Texas average

Texas average: 0.4

0 critical citations Texas average: 2

0 serious citations Texas average: 0.4

4 moderate citations Texas average: 23

0 minor citations Texas average: 0.4
Citations history (last 3 years)
Resident Rights moderate citation May 19, 2025
Corrected

Care Planning moderate citation Aug 21, 2024
Corrected

Abuse/Neglect moderate citation Jul 19, 2023
Corrected

Abuse/Neglect moderate citation Jul 19, 2023
Corrected

Staffing Data

Reporting period: October 1 – December 31, 2025 (Q4 2025). Source: CMS Payroll-Based Journal report.

Total staff 51
Employees 34
Contractors 17
Staff to resident ratio 0 : 0
100% fewer staff per resident than Texas average
Texas average ratio: 1.48 : 1 Texas average ratio: 1.48 : 1See full Texas ranking
Avg staff/day 18
Average shift 7.6 hours
6% worse than Texas average
Texas average: 8.1 hours Texas average shift: 8.1 hoursSee full Texas ranking
Total staff hours (quarter) 12,657

Nursing staff breakdown

Q4 2025 · Oct 1 – Dec 31 More info This data comes from the CMS Payroll-Based Journal report covering October 1 – December 31, 2025.
Registered Nurse

Manages medical care and health needs.

RN Staff Info 10 total: 8 full-time employees and 2 contractors. 10
Average shift length Info Average shift length. Calculated as total hours divided by days worked and average staff per day. 9.3 hours
Licensed Practical Nurse

Assists with medical care and medications.

LPN Staff Info 3 total: 2 full-time employees and 1 contractor. 3
Average shift length Info Average shift length. Calculated as total hours divided by days worked and average staff per day. 12 hours
Certified Nursing Assistant

Helps with daily care and mobility.

CNA Staff Info All 14 CNA Staff are full-time employees. No contractors work on this role. 14
Average shift length Info Average shift length. Calculated as total hours divided by days worked and average staff per day. 8.4 hours

Contractor staffing

Q4 2025 · Oct 1 – Dec 31 More info This data comes from the CMS Payroll-Based Journal report covering October 1 – December 31, 2025.

Total hours from contractors

10.9%

1,376 contractor hours this quarter

Speech Language Pathologist: 4 Physical Therapy Assistant: 3 Respiratory Therapy Technician: 3 Qualified Social Worker: 2 Registered Nurse: 2 Physical Therapy Aide: 2 Licensed Practical Nurse: 1

Staff by category

Q4 2025 · Oct 1 – Dec 31 More info This data comes from the CMS Payroll-Based Journal report covering October 1 – December 31, 2025.
Certified Nursing Assistant140145,30192100%8.4
Registered Nurse82101,78892100%9.3
Medication Aide/Technician4041,4989199%10.6
Licensed Practical Nurse2136105054%12
Administrator1014806065%8
RN Director of Nursing1014625863%8
Mental Health Service Worker1014405560%8
Qualified Social Worker0224297379%5.9
Nurse Practitioner1014085155%8
Speech Language Pathologist0443387784%2.8
Clinical Nurse Specialist1013284145%8
Physical Therapy Aide0223026267%4.8
Physical Therapy Assistant0331415358%2.6
Respiratory Therapy Technician033935964%1.4
Other Dietary Services Staff1013967%6.4
14 Certified Nursing Assistant
% of Days 100%
10 Registered Nurse
% of Days 100%
4 Medication Aide/Technician
% of Days 99%
3 Licensed Practical Nurse
% of Days 54%
1 Administrator
% of Days 65%
1 RN Director of Nursing
% of Days 63%
1 Mental Health Service Worker
% of Days 60%
2 Qualified Social Worker
% of Days 79%
1 Nurse Practitioner
% of Days 55%
4 Speech Language Pathologist
% of Days 84%
1 Clinical Nurse Specialist
% of Days 45%
2 Physical Therapy Aide
% of Days 67%
3 Physical Therapy Assistant
% of Days 58%
3 Respiratory Therapy Technician
% of Days 64%
1 Other Dietary Services Staff
% of Days 7%

Penalties and fines

Federal penalties imposed by CMS for regulatory violations, including civil money penalties (fines) and denials of payment for new Medicare/Medicaid admissions.

Source: CMS Penalties Database

No penalties in the past 3 years

No civil money penalties or payment denials were reported in the last 3 years.

Quality of care over time

These measures show how residents usually do over time at this home, based on health outcomes and preventive care.

High-risk clinical events score Info A composite score based on pressure ulcers, falls with injury, weight loss, walking ability decline, and activities of daily living decline. 4.2
52% better than Texas average

Texas average: 8.6

Functional decline score Info A composite score based on activities of daily living decline, walking ability decline, and incontinence. 10.4
35% better than Texas average

Texas average: 16.0

Long-stay resident measures
Significantly above average Texas avg: 4.1 Info CMS star rating based on long-stay quality measure performance. 5 stars = significantly above average, 1 star = significantly below average.
Need for Help with Daily Activities Increased Info Percent of long-stay residents whose need for help with daily activities has increased 5.4%
67% better than Texas average

Texas average: 16.2%

Low Risk Residents with Bowel/Bladder Incontinence Info Percent of low risk long-stay residents who lose control of their bowels or bladder 15.3%
In line with Texas average

Texas average: 15.7%

Falls with Major Injury Info Percent of long-stay residents experiencing one or more falls with major injury 1.5%
55% better than Texas average

Texas average: 3.2%

High Risk Residents with Pressure Ulcers Info Percent of long-stay high risk residents with pressure ulcers 4.3%
In line with Texas average

Texas average: 4.4%

Urinary Tract Infection Info Percent of long-stay residents with a urinary tract infection 0.0%
100% better than Texas average

Texas average: 0.8%

Lost Too Much Weight Info Percent of long-stay residents who lose too much weight 5.6%
60% worse than Texas average

Texas average: 3.5%

Depressive Symptoms Info Percent of long-stay residents who have depressive symptoms 6.3%
118% worse than Texas average

Texas average: 2.9%

Antipsychotic Use Info Percent of long-stay residents who received an antipsychotic medication 13.0%
66% worse than Texas average

Texas average: 7.9%

Pneumococcal Vaccine Info Percent of long-stay residents assessed and appropriately given the pneumococcal vaccine 100.0%
In line with Texas average

Texas average: 97.3%

Influenza Vaccine Info Percent of long-stay residents assessed and appropriately given the seasonal influenza vaccine 95.5%
In line with Texas average

Texas average: 97.9%

Short-stay resident measures
Average Texas avg: 3.1 Info CMS star rating based on short-stay quality measure performance. 5 stars = much above average, 1 star = much below average.
Pneumococcal Vaccine Info Percent of short-stay residents assessed and appropriately given the pneumococcal vaccine 100.0%
11% better than Texas average

Texas average: 90.4%

Antipsychotic medication increase Info Percent of short-stay residents who newly received an antipsychotic medication 2.2%
52% worse than Texas average

Texas average: 1.4%

Influenza Vaccine Info Percent of short-stay residents assessed and appropriately given the seasonal influenza vaccine 100.0%
14% better than Texas average

Texas average: 88.0%

Re-hospitalized after SNF stay Info Percentage of short-stay residents who were re-hospitalized after their nursing home admission. 26.0%
In line with Texas average

Texas average: 25.9%

Emergency department visits Info Percentage of short-stay residents who had an outpatient emergency department visit. 12.0%
In line with Texas average

Texas average: 12.0%

Falls with major injury Info Percentage of SNF residents who experience falls with major injury during their stay. 0.0%
100% better than Texas average

Texas average: 0.8%

Ability to care for self at discharge Info Percentage of residents at or above expected ability to care for themselves at discharge. 57.1%
6% better than Texas average

Texas average: 53.7%

Successful return to home or community Info Rate of successful return to home or community from a skilled nursing facility. 55.4%
9% better than Texas average

Texas average: 50.6%

Breakdown by payment type

Medicare

70% of new residents, usually for short-term rehab.

Typical stay 29 days

Private pay

30% of new residents, often for short stays.

Typical stay 6 - 7 months

Finances and operations

Based on CMS SNF Cost Report for fiscal year ending in 12/2023.

Governmental community
Operated by a subsidized facility district.
Net patient revenue Info Net patient revenue — what the home actually collects for resident care, after contractual allowances, bad debt and discounts are subtracted from its gross charges (CMS cost report, Worksheet G-3). It covers resident care only; money the home earns from other sources is shown separately as "Other income."
$9.8M
Net patient income Info Net patient income: net patient revenue minus the home's total operating expenses. A positive figure means it earns more from resident care than it spends to deliver it; a negative figure means the opposite. It excludes non-operating "other income."
-$6.2M
Governmental community Operated by a subsidized facility district.
Net patient revenue Info Net patient revenue — what the home actually collects for resident care, after contractual allowances, bad debt and discounts are subtracted from its gross charges (CMS cost report, Worksheet G-3). It covers resident care only; money the home earns from other sources is shown separately as "Other income."
$9.8M Rank #141 / 304Revenue — State benchmarkedThis home is ranked 141st out of 304 homes in Texas. Shows this facility's annual revenue compared to the Texas average. Higher revenue generally means more resources for staffing and capital — read alongside Payroll %.Rankings are based only on facilities in Texas that report data for that category. Facilities without available data are excluded from the ranking.Click the rank badge to see the full State ranking.Click here to see the full State ranking.
Net patient income Info Net patient income: net patient revenue minus the home's total operating expenses. A positive figure means it earns more from resident care than it spends to deliver it; a negative figure means the opposite. It excludes non-operating "other income."
-$6.2M
Other income Info Money the home earns outside of resident care — such as investments, grants, rentals and other non-operating sources (CMS cost report, Worksheet G-3). It is tracked separately from net patient revenue: it is not part of that figure, and it is not included in net patient income.
$627.6K
Payroll costs Info Staff salaries plus wage-related costs — benefits such as payroll taxes, health insurance and retirement — from the home's own accounting records (CMS cost report, Worksheet A). Contract or agency labor is counted separately, under other operating costs. Rank #120 / 304Payroll — State benchmarkedThis home is ranked 120th out of 304 homes in Texas. Shows total annual staff payroll benchmarked to the Texas average. Higher payroll investment relative to peers often signals better staffing and less reliance on cheaper contract labor.Rankings are based only on facilities in Texas that report data for that category. Facilities without available data are excluded from the ranking.Click the rank badge to see the full State ranking.Click here to see the full State ranking.
$5.0M 51.5% of net patient revenue Info Payroll as a share of revenue: staff salaries and wage-related benefits divided by net patient revenue. A higher figure means more of each revenue dollar goes to staff pay. Rank #113 / 304Payroll % — State benchmarkedThis home is ranked 113th out of 304 homes in Texas. Shows payroll as a percentage of revenue versus the Texas average. Well-run Texas facilities typically land around 51–63% — the top third Statewide. Below 25% may signal understaffing or heavy agency use — read with Staffing ratings.Rankings are based only on facilities in Texas that report data for that category. Facilities without available data are excluded from the ranking.Click the rank badge to see the full State ranking.Click here to see the full State ranking.
Other operating costs Info Everything it costs to run the home apart from payroll — food, utilities, supplies, maintenance, contract labor and administration. Calculated as total operating expense minus payroll (staff salaries and wage-related benefits).
$10.9M
Total costs Info The home's total operating expense for the year — all the costs of running it, salaries included (CMS cost report, Worksheet G-3).
$16.0M

What does this home offer?

Pets allowed icon
Pets allowed icon

Pets Allowed

Housing options icon

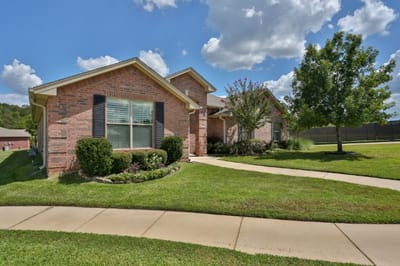
Housing Options: 1 Bed / 2 Bed

Building type icon
Building type icon

Building Type: Two-story

Transportation services icon

Transportation Services

Fitness and recreation icon

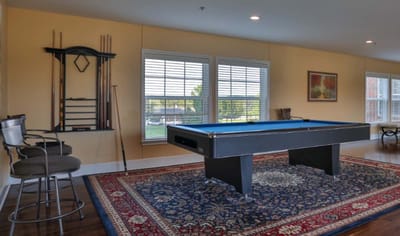
Fitness and Recreation

Who this home usually serves

TYPE OF STAY

Mostly short-term rehab stays

Most residents typically stay for a few weeks or months before returning home or moving on.

Most new residents arrive under Medicare (70% of admissions), and a typical Medicare stay runs around 29 days.

Admissions
115 total

Coverage residents most often arrive under.

Medicare 70%
Private pay 30%
Discharges
125 total

Coverage residents most often leave under.

Medicare 50%
Private pay 50%

Places of interest near Meadow Lake Senior Living – Tyler

Address 8.5 miles from city center Info Estimated distance in miles from Tyler's city center to Meadow Lake Senior Living – Tyler's address, calculated via Google Maps.

Calculate Travel Distance to Meadow Lake Senior Living – Tyler

Add your location

Address

Compare Nursing Homes around Tyler

The information below is reported by the Texas Health and Human Services Commission.

2 facilities compared · CMS & TX Dept. of Health data

Meadow Lake Senior Living – Tyler
NH
AL
IL
MC
RC
Tyler
20
Facility 20
TX AVG 80
Rank #804 / 988
80.1%
Facility 80.1%
TX AVG 63.5%
Rank #72 / 304
+26%
4.30
Facility 4.30
TX AVG 3.63
Rank #56 / 296
+156%+18%
$0
Facility $0
TX AVG $81.8k
Rank #1 / 301
4
Facility 4
TX AVG 25.9
Rank #2 / 299
1.3
Facility 1.3
TX AVG 3.7
Rank #2 / 299
-27A+
33
Facility 33
TX AVG 41
Rank #884 / 1391
Robbin Bell
$9.8M
Facility $9.8M
TX AVG $8.4M
Rank #141 / 304
$5.0M
Facility $5.0M
TX AVG $3.5M
Rank #120 / 304
51.5%
Facility 51.5%
TX AVG 47%
Rank #113 / 304
676286
Asher Point Independent Living of Tyler
NH
IL
Tyler
63
Facility 63
TX AVG 80
Rank #577 / 988
90.8%
Facility 90.8%
TX AVG 63.5%
Rank #14 / 304
+43%
3.22
Facility 3.22
TX AVG 3.63
Rank #222 / 296
+32%-11%
$0
Facility $0
TX AVG $81.8k
Rank #1 / 301
12
Facility 12
TX AVG 25.9
Rank #39 / 299
4.0
Facility 4.0
TX AVG 3.7
Rank #215 / 299
-55-
55
Facility 55
TX AVG 41
Rank #387 / 1391
Operators Of Pilot Point LLC
$5.7M
Facility $5.7M
TX AVG $8.4M
Rank #259 / 304
$2.4M
Facility $2.4M
TX AVG $3.5M
Rank #288 / 304
41.3%
Facility 41.3%
TX AVG 47%
Rank #273 / 304
675902

Financial Assistance for
Nursing Home in Texas

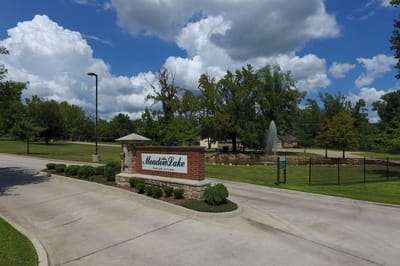
Meadow Lake Senior Living – Tyler is located in Tyler, Texas.
Here are the financial assistance programs available to residents in Texas.

Get Financial aid guidance

Community Care for the Aged and Disabled (CCAD)

TX Medicaid CCAD

Age 65+ or disabled
General Texas resident, Medicaid-eligible, care need (not always nursing home level).
Income Limits (2025) ~$2,829/month 300% FBR, individual
Asset Limits $2,000 (individual), $3,000 (couple).
TX

Large state; rural access challenges.

Benefits
Personal care (5-7 hours/day) Respite (240 hours/year) Adult day care (~$60/day) Home aides

Texas Community Care Services

TX CCS

Age 60+
General Texas resident, at risk of decline.
Income Limits ~$2,000/month individual, varies
Asset Limits $5,000 individual
TX

Limited funding; high demand in urban areas.

Benefits
In-home care (3-5 hours/week) Respite (up to 10 days/year) Transportation (~5 trips/month)

Area Agency on Aging (AAA) Services

Texas AAA Services

Age 60+
General TX resident; no income/asset limits.
Income Limits (2025) None; donations encouraged.
Asset Limits Not assessed.
TX

28 AAAs; includes Meals on Wheels in some areas.

Benefits
Meals (~$5-$7/meal) Transportation Homemaker services (~4 hours/week) Respite (~5 days/year) Legal aid

Medicare Savings Program (MSP)

Texas Medicare Savings Program

Age 65+ or disabled
General TX resident, Medicare Part A/B.
Income Limits (2025) ~$2,510/month (QMB), ~$3,380/month (SLMB), ~$3,598/month (QI)—individual.
Asset Limits $9,430 (individual), $14,130 (couple).
TX

Includes Extra Help for Part D; no waitlist.

Benefits
Covers Part B premiums ($174.70/month) Deductibles ($240/year) Copays (~20%)

Family Caregiver Support Program (FCSP)

Texas Family Caregiver Support Program

Age
General Caregivers of 60+ needing care or 55+ caregivers of others; TX resident; 2+ ADLs.
Income Limits (2025) No strict cap; prioritizes low-income ~$24,980/year
Asset Limits Not assessed.
TX

High rural demand; includes grandparent caregivers.

Benefits
Respite (4-6 hours/week or 5 days/year) Adult day care ($60/day) Training Supplies (~$500/year)

VA Aid and Attendance (A&A) and Housebound Benefits

Texas VA Aid and Attendance/Housebound

Age 65+ or disabled veteran/spouse
General TX resident, wartime service, ADL help (A&A) or homebound.
Income Limits (2025) Net income < ~$1,984/month (veteran with dependent, A&A); pension offsets income.
Asset Limits ~$155,356 net worth
TX

High veteran population; supports rural/urban needs.

Benefits
Cash (~$1,433-$2,642/month veteran, ~$951-$1,318 spouse) for care costs

Property Tax Exemption for Seniors

Texas Senior Property Tax Exemption

Age 65+
General TX resident, homeowner (homestead).
Income Limits (2025) None; tax-based eligibility.
Asset Limits Not assessed.
TX

$25,000+ exemption; optional freeze in some counties; saves ~$500-$1,000/year.

Benefits
Tax exemption or freeze (~$500-$1,000/year savings)

Senior Farmers’ Market Nutrition Program (SFMNP)

Texas SFMNP

Age 60+
General TX resident, low-income.
Income Limits (2025) ~$2,322/month 185% FPL
Asset Limits Not assessed.
TX

Vouchers (~$50/season); serves ~20,000 via 28 AAAs.

Benefits
Vouchers (~$50/season) for produce at farmers’ markets

Frequently Asked Questions about Meadow Lake Senior Living – Tyler

Is Meadow Lake Senior Living – Tyler in a walkable area?

Meadow Lake Senior Living – Tyler has a walk score of 33. Somewhat walkable. A few nearby services may be reachable on foot, but most trips require transportation.

What is the occupancy rate at Meadow Lake Senior Living – Tyler?

Meadow Lake Senior Living – Tyler's occupancy is 80.1%.

Are there photos of Meadow Lake Senior Living – Tyler?

Yes — there are 18 photos of Meadow Lake Senior Living – Tyler in the photo gallery on this page.

What is the address of Meadow Lake Senior Living – Tyler?

Meadow Lake Senior Living – Tyler is located at 16044 County Rd 165, Tyler, TX 75703.

What is the phone number of Meadow Lake Senior Living – Tyler?

(903) 526-5599 will put you in contact with the team at Meadow Lake Senior Living – Tyler.

Is Meadow Lake Senior Living – Tyler Medicare or Medicaid certified?

Yes — Meadow Lake Senior Living – Tyler is a CMS-certified provider of Medicare and Medicaid.

Guides for Better Senior Living

Care Cost Calculator: See Prices in Your Area

Nursing Home Data Explorer

Don’t Wait Too Long: 7 Red Flag Signs Your Parent Needs Assisted Living Now

The True Cost of Assisted Living in 2025 – And How Families Are Paying For It

Understanding Senior Living Costs: Pricing Models, Discounts & Financial Assistance