Fellowship Community
Nursing Home, Assisted Living, Independent Living & Memory Care · Whitehall, PA
CMS overall rating Info CMS (the Centers for Medicare & Medicaid Services) is the federal agency that rates nursing home quality. Its Overall Rating runs from 1 to 5 stars, combining health inspections, staffing, and quality measures, with inspections weighted most heavily.

Fellowship Community

Nursing Home, Assisted Living, Independent Living & Memory Care · Whitehall, PA
CMS overall rating Info CMS (the Centers for Medicare & Medicaid Services) is the federal agency that rates nursing home quality. Its Overall Rating runs from 1 to 5 stars, combining health inspections, staffing, and quality measures, with inspections weighted most heavily.
Calculator: See prices in your area
Fellowship Community accepts Medicare, Medicaid, and private pay.

Overview of Fellowship Community

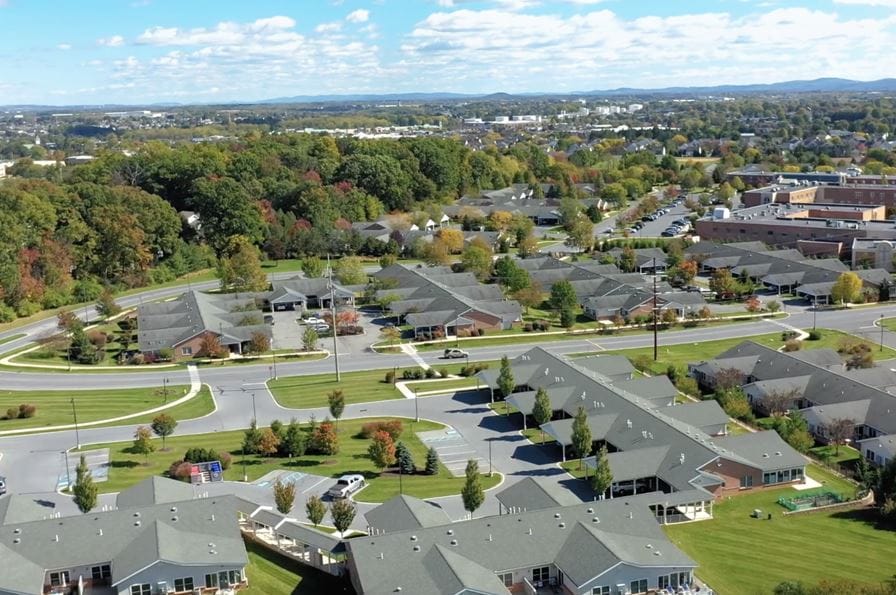
Meet new friends with the distinguished senior living community of Fellowship Community set in the peaceful Fellowship Drive, Whitehall, PA, that focuses on independent living. The community promotes a vibrant and friendly environment for seniors to live in comfort with its meticulously designed and spacious accommodations. Lead a meaningful life with a dedicated and highly skilled team that strives to help seniors in their daily activities.

Remain connected with your surroundings and enjoy a relaxing alone time with engaging activities and programs that highlight interests and strengths. Experience exquisite dining with delightful and healthy meals that cater to dietary needs and preferences. Fellowship Community strives to provide a haven for seniors to spend their golden years without worries.

Quality ratings

Measured by Centers for Medicare & Medicaid Services (CMS)

Overall rating Info The Overall CMS Rating combines results from health inspections, staffing levels and quality measures. Health inspections carry the most weight. Staffing and quality scores can increase or decrease the final rating based on performance compared to state and national standards.
Health Inspection Info Based on the results of the facility's three most recent standard inspections and any complaint investigations. CMS reviews the number, scope, and severity of deficiencies, with more recent findings weighted more heavily.
Staffing Info Measures average nursing staff hours per resident per day, including Registered Nurses (RNs) and total nursing staff. Ratings are adjusted based on the level of care residents require and are compared to state and national benchmarks.
Quality Measures Info Based on clinical and physical health indicators reported to CMS, such as hospital readmissions, falls, pressure ulcers, and improvements in mobility. These measures reflect how well residents' health needs are being managed.

Staffing hours breakdown

Info Daily nursing hours per resident by staff type, reported to CMS. Higher is generally better — compare this facility to state and national averages to see where staffing stands.

Hours per resident per day — compared to state averages

Total nursing care / resident Info Total adjusted nursing hours per resident per day, combining RN, LPN, and aide time. CMS adjusts this for case-mix so facilities can be fairly compared.
4h 24m per day
Rank #80 / 207Nurse hours — State benchmarkedThis home is ranked 80th out of 207 homes in Pennsylvania. Shows adjusted nurse hours per resident per day benchmarked to the Pennsylvania average, with a ranking across 207 Pennsylvania facilities. More hours mean more direct care. The national average is about 3.5 hrs; below 3.0 is a red flag.Rankings are based only on facilities in Pennsylvania that report data for that category. Facilities without available data are excluded from the ranking.Click the rank badge to see the full State ranking.Click here to see the full State ranking.
vs avg
Staff typeHours / Day / Residentvs state avg
Registered Nurse (RN) Info RNs hold the highest nursing license and can assess residents, interpret test results, and direct care plans. More RN hours per day often signals stronger clinical oversight and faster response to health changes. 1h 22m per day
LPN / LVN Info Licensed Practical Nurses (LPNs) or Licensed Vocational Nurses (LVNs) deliver routine hands-on care — medication administration, wound dressing, and monitoring vital signs. They work under RN supervision and make up a large share of daily bedside care. 33m per day
Nurse Aide Info Certified Nurse Aides (CNAs) provide the most direct day-to-day assistance: bathing, dressing, feeding, and mobility. Nurse aide hours are typically the largest staffing category and directly affect residents' quality of life. 2h 35m per day
Weekend Total Nursing Info Combined nursing hours (RN + LPN + Nurse Aide) per resident per day on weekends. Staffing often drops on weekends — this figure reveals whether the facility maintains adequate coverage outside of weekday hours. 3h 57m per day
Physical Therapist Info Hours per resident per day provided by licensed Physical Therapists (PTs) or PT Assistants. PT services help residents recover mobility after injury or illness and are especially important for post-acute (short-stay) rehabilitation. 4m per day
Weekend RN Info Registered nurse hours specifically on weekends. Facilities sometimes reduce RN presence on Saturdays and Sundays — a low weekend RN figure compared to weekday hours can indicate reduced clinical oversight when most administrative staff are absent. 57m per day

Capacity and availability

This home is often near full

Higher occupancy than the state average
Occupancy rate
95.1% Rank #18 / 518Occupancy rate — State benchmarkedThis home is ranked 18th out of 518 homes in Pennsylvania. Shows this facility's occupancy rate versus the Pennsylvania average, with its Statewide rank out of 518. Higher occupancy signals strong local demand and financial stability.Rankings are based only on facilities in Pennsylvania that report data for that category. Facilities without available data are excluded from the ranking.Click the rank badge to see the full State ranking.Click here to see the full State ranking.
Avg. Length of Stay
100 days
Bed community size
121-bed community Rank #122 / 555Bed count — State benchmarkedThis home is ranked 122nd out of 555 homes in Pennsylvania. Shows this facility's certified or reported bed count compared to other Pennsylvania facilities. Larger communities may offer more amenities, programs, and on-site services for residents and families.Rankings are based only on facilities in Pennsylvania that report data for that category. Facilities without available data are excluded from the ranking.Click the rank badge to see the full State ranking.Click here to see the full State ranking.
A larger shared setting that may offer more common spaces and organized community services.
Walk Score
Walk Score: 4 / 100 Rank #645 / 668Walk Score — State benchmarkedThis home is ranked 645th out of 668 homes in Pennsylvania. Shows how walkable this facility's neighborhood is compared to the average Walk Score across Pennsylvania facilities. Higher scores benefit residents, families, and staff.Rankings are based only on facilities in Pennsylvania that report data for that category. Facilities without available data are excluded from the ranking.Click the rank badge to see the full State ranking.Click here to see the full State ranking.
Car-dependent. Most errands require a car, with limited nearby walkable options.

Therapy & Rehabilitation

1 service
Rehabilitation Services

Additional Policies & Features

HousekeepingYes

Amenities & Lifestyle

Housekeeping
Maintenance Services
Workshop
Library
Country Store
Fellowship Park
Outdoor Activities
Pet-Friendly Campus
ActivitiesTai Chi, movie nights, excursions
Specific ProgramsPersonal Care, Short-Term Rehabilitation, Fellowship Fit Club and Wellness Programs

Contact Fellowship Community

Staffing Data

Reporting period: October 1 – December 31, 2025 (Q4 2025). Source: CMS Payroll-Based Journal report.

Total staff 216
Employees 182
Contractors 34
Staff to resident ratio 1.85 : 1
0% compared with State average

State average ratio: 0 : 0

Avg staff/day 88
Average shift 7.4 hours
0% compared with State average

State average: 0 hours

Total staff hours (quarter) 60,147

Nursing staff breakdown

Q4 2025 · Oct 1 – Dec 31 More info This data comes from the CMS Payroll-Based Journal report covering October 1 – December 31, 2025.
Registered Nurse

Manages medical care and health needs.

RN Staff Info 39 total: 38 full-time employees and 1 contractor. 39
Average shift length Info Average shift length. Calculated as total hours divided by days worked and average staff per day. 7.6 hours
Licensed Practical Nurse

Assists with medical care and medications.

LPN Staff Info 20 total: 16 full-time employees and 4 contractors. 20
Average shift length Info Average shift length. Calculated as total hours divided by days worked and average staff per day. 7.6 hours
Certified Nursing Assistant

Helps with daily care and mobility.

CNA Staff Info 105 total: 80 full-time employees and 25 contractors. 105
Average shift length Info Average shift length. Calculated as total hours divided by days worked and average staff per day. 7.6 hours

Contractor staffing

Q4 2025 · Oct 1 – Dec 31 More info This data comes from the CMS Payroll-Based Journal report covering October 1 – December 31, 2025.

Total hours from contractors

1.6%

980 contractor hours this quarter

Certified Nursing Assistant: 25 Licensed Practical Nurse: 4 Occupational Therapy Aide: 2 Registered Nurse: 1 Medical Director: 1 Occupational Therapy Assistant: 1

Staff by category

Q4 2025 · Oct 1 – Dec 31 More info This data comes from the CMS Payroll-Based Journal report covering October 1 – December 31, 2025.
Certified Nursing Assistant802510527,89592100%7.6
Registered Nurse3813911,25992100%7.6
Licensed Practical Nurse164205,46592100%7.6
Other Dietary Services Staff140145,39792100%7.4
Clinical Nurse Specialist100103,0236975%7.6
Speech Language Pathologist3039568289%6.4
Mental Health Service Worker2028586470%7.8
Physical Therapy Assistant4048456773%7
Respiratory Therapy Technician4047177582%5.1
Physical Therapy Aide3035186166%7.2
Occupational Therapy Aide0225036470%7.5
Nurse Practitioner1014596065%7.7
RN Director of Nursing1014576065%7.6
Dietitian1014546470%7.1
Respiratory Therapist1014375964%7.4
Administrator1014315661%7.7
Qualified Social Worker3033995863%6.4
Occupational Therapy Assistant011511112%4.6
Medical Director0112433%8
105 Certified Nursing Assistant
% of Days 100%
39 Registered Nurse
% of Days 100%
20 Licensed Practical Nurse
% of Days 100%
14 Other Dietary Services Staff
% of Days 100%
10 Clinical Nurse Specialist
% of Days 75%
3 Speech Language Pathologist
% of Days 89%
2 Mental Health Service Worker
% of Days 70%
4 Physical Therapy Assistant
% of Days 73%
4 Respiratory Therapy Technician
% of Days 82%
3 Physical Therapy Aide
% of Days 66%
2 Occupational Therapy Aide
% of Days 70%
1 Nurse Practitioner
% of Days 65%
1 RN Director of Nursing
% of Days 65%
1 Dietitian
% of Days 70%
1 Respiratory Therapist
% of Days 64%
1 Administrator
% of Days 61%
3 Qualified Social Worker
% of Days 63%
1 Occupational Therapy Assistant
% of Days 12%
1 Medical Director
% of Days 3%

Penalties and fines

Federal penalties imposed by CMS for regulatory violations, including civil money penalties (fines) and denials of payment for new Medicare/Medicaid admissions.

Source: CMS Penalties Database

No penalties in the past 3 years

No civil money penalties or payment denials were reported in the last 3 years.

Quality of care over time

These measures show how residents usually do over time at this home, based on health outcomes and preventive care.

High-risk clinical events score Info A composite score based on pressure ulcers, falls with injury, weight loss, walking ability decline, and activities of daily living decline. 10.9
In line with State average

State average: 11.0

Functional decline score Info A composite score based on activities of daily living decline, walking ability decline, and incontinence. 22.5
In line with State average

State average: 22.2

Long-stay resident measures
Need for Help with Daily Activities Increased Info Percent of long-stay residents whose need for help with daily activities has increased 12.4%
34% better than State average

State average: 19.0%

Walking Ability Worsened Info Percent of long-stay residents whose ability to move independently worsened 32.1%
52% worse than State average

State average: 21.1%

Low Risk Residents with Bowel/Bladder Incontinence Info Percent of low risk long-stay residents who lose control of their bowels or bladder 22.9%
14% better than State average

State average: 26.7%

Falls with Major Injury Info Percent of long-stay residents experiencing one or more falls with major injury 3.8%
18% worse than State average

State average: 3.2%

High Risk Residents with Pressure Ulcers Info Percent of long-stay high risk residents with pressure ulcers 3.9%
29% better than State average

State average: 5.5%

Urinary Tract Infection Info Percent of long-stay residents with a urinary tract infection 1.2%
34% better than State average

State average: 1.8%

Lost Too Much Weight Info Percent of long-stay residents who lose too much weight 2.5%
62% better than State average

State average: 6.6%

Depressive Symptoms Info Percent of long-stay residents who have depressive symptoms 1.6%
72% better than State average

State average: 5.5%

Antipsychotic Use Info Percent of long-stay residents who received an antipsychotic medication 23.1%
35% worse than State average

State average: 17.1%

Pneumococcal Vaccine Info Percent of long-stay residents assessed and appropriately given the pneumococcal vaccine 99.1%
14% better than State average

State average: 86.9%

Influenza Vaccine Info Percent of long-stay residents assessed and appropriately given the seasonal influenza vaccine 97.9%
5% better than State average

State average: 93.5%

Short-stay resident measures
Pneumococcal Vaccine Info Percent of short-stay residents assessed and appropriately given the pneumococcal vaccine 96.3%
40% better than State average

State average: 68.8%

Antipsychotic medication increase Info Percent of short-stay residents who newly received an antipsychotic medication 1.2%
20% better than State average

State average: 1.5%

Influenza Vaccine Info Percent of short-stay residents assessed and appropriately given the seasonal influenza vaccine 82.8%
21% better than State average

State average: 68.7%

Breakdown by payment type

Medicare

50% of new residents, usually for short-term rehab.

Typical stay 24 days

Private pay

46% of new residents, often for short stays.

Typical stay 3 - 4 months

Medicaid

4% of new residents, often for long-term daily care.

Typical stay 3 years

Facility Characteristics

Source: CMS Long-Term Care Facility Characteristics (Data as of Jan 2026)

Total residents 117
Medicare
13
11.1% of residents
Medicaid
36
30.8% of residents
Private pay or other
68
58.1% of residents
Programs & Services
Residents Group

Residents meet regularly to discuss policies, care quality, and activities

Family Member Group

Family members meet regularly to discuss policies, care quality, and activities

CCRC

Part of a Continuing Care Retirement Community offering multiple care levels

Active Family Council

Organized group of family members that meets regularly to discuss facility policies, resident care, and activities.

Active Resident Council

Organized group of residents that meets regularly to discuss facility policies, quality of life, and activities.

Finances and operations

Based on CMS SNF Cost Report for fiscal year ending in 06/2024.

Nonprofit
Nonprofit Corporation
Net patient revenue Info Net patient revenue — what the home actually collects for resident care, after contractual allowances, bad debt and discounts are subtracted from its gross charges (CMS cost report, Worksheet G-3). It covers resident care only; money the home earns from other sources is shown separately as "Other income."
$33.3M
Net patient income Info Net patient income: net patient revenue minus the home's total operating expenses. A positive figure means it earns more from resident care than it spends to deliver it; a negative figure means the opposite. It excludes non-operating "other income."
-$1.2M
Nonprofit Nonprofit Corporation
Net patient revenue Info Net patient revenue — what the home actually collects for resident care, after contractual allowances, bad debt and discounts are subtracted from its gross charges (CMS cost report, Worksheet G-3). It covers resident care only; money the home earns from other sources is shown separately as "Other income."
$33.3M Rank #27 / 209Revenue — State benchmarkedThis home is ranked 27th out of 209 homes in Pennsylvania. Shows this facility's annual revenue compared to the Pennsylvania average. Higher revenue generally means more resources for staffing and capital — read alongside Payroll %.Rankings are based only on facilities in Pennsylvania that report data for that category. Facilities without available data are excluded from the ranking.Click the rank badge to see the full State ranking.Click here to see the full State ranking.
Net patient income Info Net patient income: net patient revenue minus the home's total operating expenses. A positive figure means it earns more from resident care than it spends to deliver it; a negative figure means the opposite. It excludes non-operating "other income."
-$1.2M
Other income Info Money the home earns outside of resident care — such as investments, grants, rentals and other non-operating sources (CMS cost report, Worksheet G-3). It is tracked separately from net patient revenue: it is not part of that figure, and it is not included in net patient income.
$2.0M
Payroll costs Info Staff salaries plus wage-related costs — benefits such as payroll taxes, health insurance and retirement — from the home's own accounting records (CMS cost report, Worksheet A). Contract or agency labor is counted separately, under other operating costs. Rank #20 / 209Payroll — State benchmarkedThis home is ranked 20th out of 209 homes in Pennsylvania. Shows total annual staff payroll benchmarked to the Pennsylvania average. Higher payroll investment relative to peers often signals better staffing and less reliance on cheaper contract labor.Rankings are based only on facilities in Pennsylvania that report data for that category. Facilities without available data are excluded from the ranking.Click the rank badge to see the full State ranking.Click here to see the full State ranking.
$19.9M 59.8% of net patient revenue Info Payroll as a share of revenue: staff salaries and wage-related benefits divided by net patient revenue. A higher figure means more of each revenue dollar goes to staff pay. Rank #106 / 209Payroll % — State benchmarkedThis home is ranked 106th out of 209 homes in Pennsylvania. Shows payroll as a percentage of revenue versus the Pennsylvania average. Well-run Pennsylvania facilities typically land around 53–61% — the top third Statewide. Below 25% may signal understaffing or heavy agency use — read with Staffing ratings.Rankings are based only on facilities in Pennsylvania that report data for that category. Facilities without available data are excluded from the ranking.Click the rank badge to see the full State ranking.Click here to see the full State ranking.
Other operating costs Info Everything it costs to run the home apart from payroll — food, utilities, supplies, maintenance, contract labor and administration. Calculated as total operating expense minus payroll (staff salaries and wage-related benefits).
$14.5M
Total costs Info The home's total operating expense for the year — all the costs of running it, salaries included (CMS cost report, Worksheet G-3).
$34.5M

What does this home offer?

Pets allowed icon
Pets allowed icon

Pets Allowed

Housing options icon

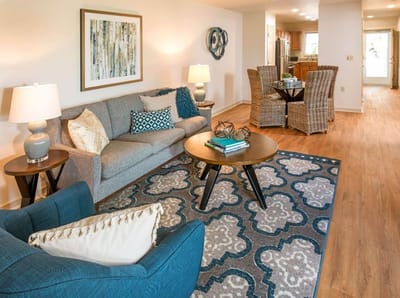
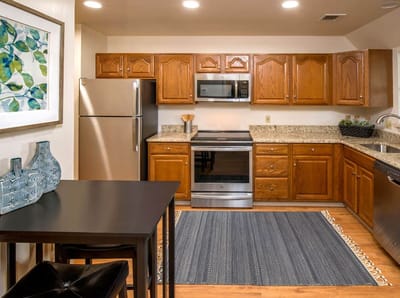
Housing Options: 1 Bed / 2 Bed

Building type icon
Building type icon

Building Type: Single-story

Fitness and recreation icon

Fitness and Recreation

Who this home usually serves

TYPE OF STAY

Mostly short-term rehab stays

Most residents typically stay for a few weeks or months before returning home or moving on.

Most new residents arrive under Medicare (50% of admissions), and a typical Medicare stay runs around 24 days.

Admissions
429 total

Coverage residents most often arrive under.

Medicare 50%
Private pay 46%
Medicaid 4%
Discharges
423 total

Coverage residents most often leave under.

Medicare 38%
Private pay 55%
Medicaid 7%

Places of interest near Fellowship Community

Address 3000 Fellowship Dr, Whitehall, PA 18052

Calculate Travel Distance to Fellowship Community

Add your location

Address

Compare Nursing Homes around the area

The information below is reported by the Pennsylvania Department of Human Services and Department of Health.

Fellowship Community
NH
AL
IL
MC
Whitehall (Fellowship Community) -121 - 4 1 Bed / 2 Bed
Barclay Friends
NH
AL
MC
RC
West Chester (North Franklin Street) -103 A+ 35 Private / Shared Suites
Overlook Green Senior Living
NH
MC
Pittsburgh -128 - 30 Studio / 1 Bed
Freedom Village at Brandywine
NH
AL
IL
MC
RC
Coatesville -60 A+ 9 1 Bed / 2 Bed
Souderton Mennonite Homes
NH
AL
MC
RC
Souderton -154 - 31 Studio / 1 Bed / 2 Bed

Frequently Asked Questions about Fellowship Community

What neighborhood is Fellowship Community in?

Fellowship Community is in the Fellowship Community neighborhood.

Is Fellowship Community in a walkable area?

Fellowship Community has a walk score of 4. Car-dependent. Most errands require a car, with limited nearby walkable options.

What is the occupancy rate at Fellowship Community?

Fellowship Community's occupancy is 95.1%.

Does Fellowship Community operate as a for-profit or non-profit?

Fellowship Community is registered as a non-profit.

Are there photos of Fellowship Community?

Yes — there are 4 photos of Fellowship Community in the photo gallery on this page.

What is the address of Fellowship Community?

Fellowship Community is located at 3000 Fellowship Dr, Whitehall, PA 18052.

What is the phone number of Fellowship Community?

(610) 799-3000 will put you in contact with the team at Fellowship Community.

Guides for Better Senior Living

Care Cost Calculator: See Prices in Your Area

Nursing Home Data Explorer

Don’t Wait Too Long: 7 Red Flag Signs Your Parent Needs Assisted Living Now

The True Cost of Assisted Living in 2025 – And How Families Are Paying For It

Understanding Senior Living Costs: Pricing Models, Discounts & Financial Assistance