Laurelwood Assisted Living, LLC
Nursing Home, Assisted Living & Memory Care · Ohio, OH
CMS overall rating Info The Overall CMS Rating is scored from 1 to 5 stars and combines results from health inspections, staffing levels, and quality measures. Health inspections carry the most weight. Staffing and quality scores can increase or decrease the final rating based on performance compared to state and national standards.

Laurelwood Assisted Living, LLC

Nursing Home, Assisted Living & Memory Care · Ohio, OH
CMS overall rating Info The Overall CMS Rating is scored from 1 to 5 stars and combines results from health inspections, staffing levels, and quality measures. Health inspections carry the most weight. Staffing and quality scores can increase or decrease the final rating based on performance compared to state and national standards.
Calculator: See prices in your area
Laurelwood Assisted Living, LLC accepts Medicare and private pay.

Overview of Laurelwood Assisted Living, LLC

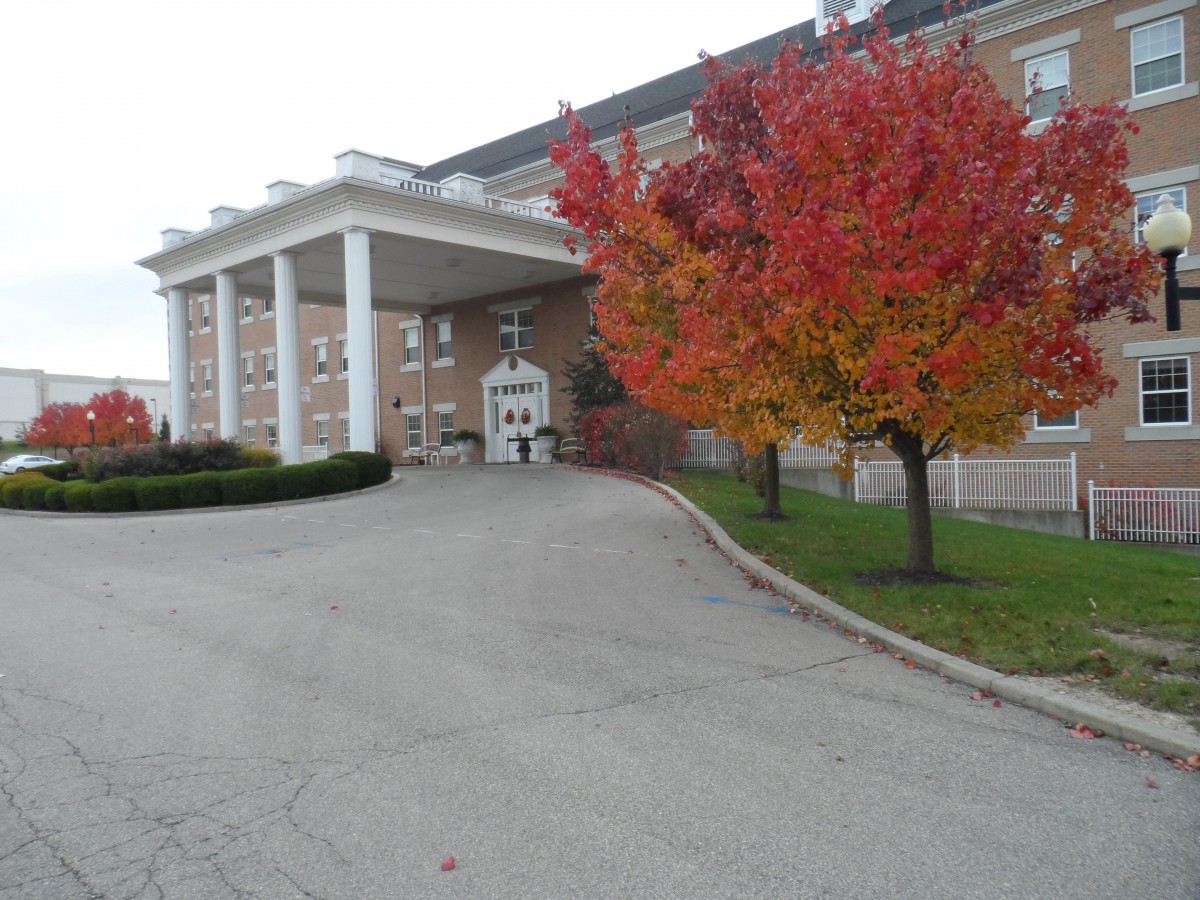
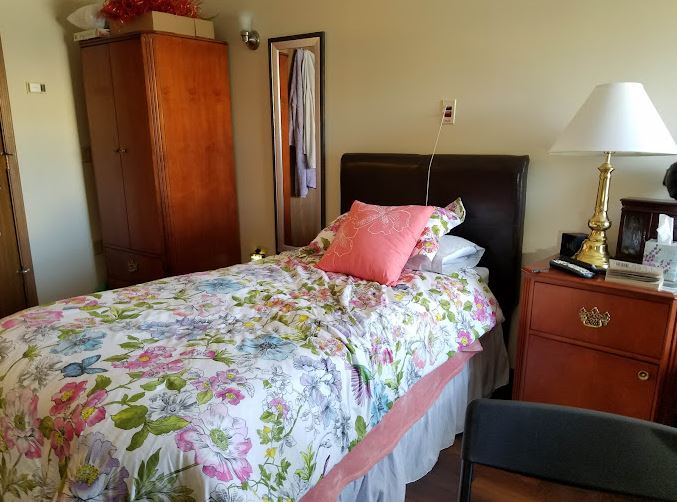
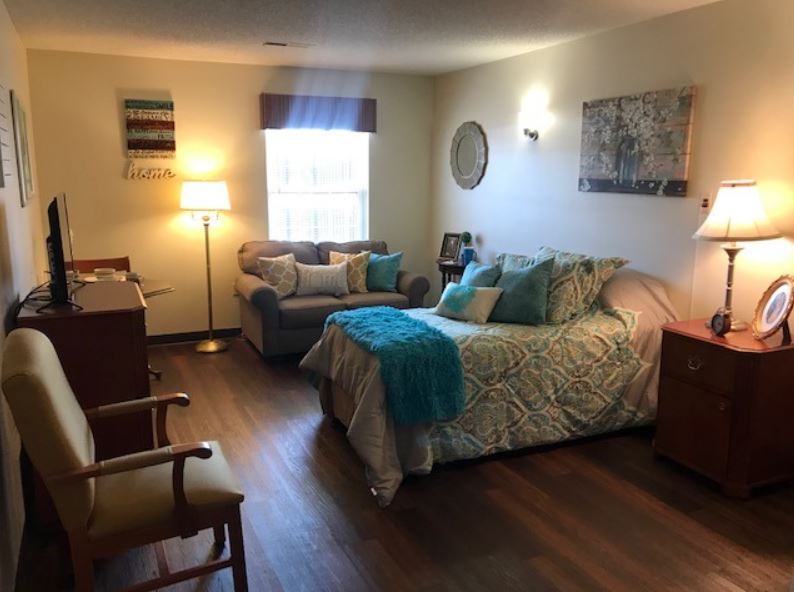
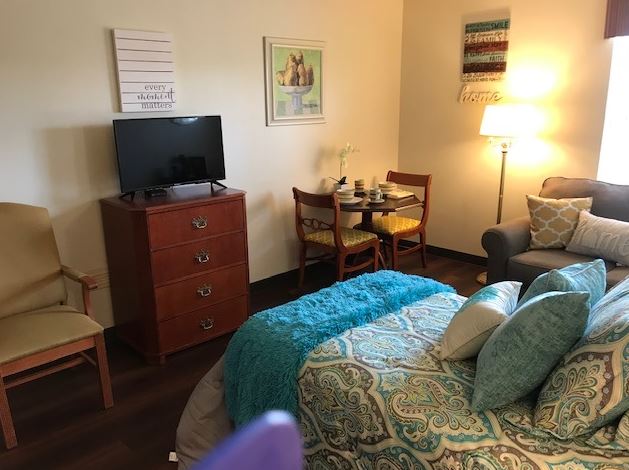
Set in the quiet neighborhood of Summit Glen Drive, Dayton, OH, Laurelwood Senior Living LLCis an astounding senior living community providing assisted living and memory care. Beautifully designed and spacious residences await seniors as they transition into the community. The community strives to deliver top-notch care and assistance that best fit seniors’ needs and preferences.

Meet people that share the same belief and experience wonderful moments through fun programs and stimulating activities. Committed to seniors’ well-being, the community conducts exercise classes for an active and well-connected lifestyle. Home-cooked meals foster comfort and satisfy dietary needs and tastes. Laurelwood Senior Living LLC ensures seniors are well-cared for with a kind and compassionate team providing help around the clock.

(937) 436-6155

Quality ratings

Measured by Centers for Medicare & Medicaid Services (CMS)

Overall rating Info The Overall CMS Rating combines results from health inspections, staffing levels and quality measures. Health inspections carry the most weight. Staffing and quality scores can increase or decrease the final rating based on performance compared to state and national standards.
▼ 11.8% Below OH avg. ▼ 11.8% Below OH avg.Click the badge to see the full State ranking.Click here to see the full State ranking.
Health Inspection Info Based on the results of the facility's three most recent standard inspections and any complaint investigations. CMS reviews the number, scope, and severity of deficiencies, with more recent findings weighted more heavily.
▲ 4.2% Above OH avg. ▲ 4.2% Above OH avg.Click the badge to see the full State ranking.Click here to see the full State ranking.
Staffing Info Measures average nursing staff hours per resident per day, including Registered Nurses (RNs) and total nursing staff. Ratings are adjusted based on the level of care residents require and are compared to state and national benchmarks.
▼ 64.9% Below OH avg. ▼ 64.9% Below OH avg.Click the badge to see the full State ranking.Click here to see the full State ranking.
Quality Measures Info Based on clinical and physical health indicators reported to CMS, such as hospital readmissions, falls, pressure ulcers, and improvements in mobility. These measures reflect how well residents' health needs are being managed.
▲ 13.1% Above OH avg. ▲ 13.1% Above OH avg.Click the badge to see the full State ranking.Click here to see the full State ranking.

Staffing hours breakdown

Info Daily nursing hours per resident by staff type, reported to CMS. Higher is generally better — compare this facility to state and national averages to see where staffing stands.

Hours per resident per day — compared to Ohio state averages

Total nursing care / resident Info This home is ranked 194th out of 203 homes in Ohio. Total adjusted nursing hours per resident per day, combining RN, LPN, and aide time. CMS adjusts this for case-mix so facilities can be fairly compared.
2h 42m per day
Rank #194 / 203Nurse hours — State benchmarkedThis home is ranked 194th out of 203 homes in Ohio. Shows adjusted nurse hours per resident per day benchmarked to the Ohio average, with a ranking across 203 Ohio SNFs. More hours mean more direct care. The national average is about 3.5 hrs; below 3.0 is a red flag.Click the rank badge to see the full State ranking.Click here to see the full State ranking.
This facility Ohio avg (3h 50m per day)
vs Ohio avg
-30%

1 of 1 metrics below state avg

Staff type Hours / Day / Resident vs state avg
Weekend Total Nursing Info Combined nursing hours (RN + LPN + Nurse Aide) per resident per day on weekends. Staffing often drops on weekends — this figure reveals whether the facility maintains adequate coverage outside of weekday hours. 2h 47m per day ▼ 15% State avg: 3h 17m per day · National avg: 3h 25m per day

Types of Care at Laurelwood Assisted Living, LLC

Assisted Living Memory Care

Capacity and availability

This home usually has availability

Lower occupancy than the Ohio average: 78.7%
Occupancy rate
69.2% Rank #155 / 204Occupancy rate — State benchmarkedThis home is ranked 155th out of 204 homes in Ohio. Shows this facility's occupancy rate versus the Ohio average, with its Statewide rank out of 204. Higher occupancy signals strong local demand and financial stability.Click the rank badge to see the full State ranking.Click here to see the full State ranking.
Avg. Length of Stay
236 days
Years in operation
31 years in operation
A longer operating history, which may indicate experience navigating regulations and delivering ongoing care.
Walk Score
Walk Score: 52 / 100 Rank #229 / 705Walk Score — State benchmarkedThis home is ranked 229th out of 705 homes in Ohio. Shows how walkable this facility's neighborhood is compared to the average Walk Score across Ohio SNFs. Higher scores benefit residents, families, and staff.Click the rank badge to see the full State ranking.Click here to see the full State ranking.
Moderately walkable. Some errands can be accomplished on foot, with a mix of nearby amenities.
BBB Rating
BBB Rating: A+ (Not Accredited)
An independent rating from the Better Business Bureau based on factors such as complaint history, transparency, and business practices.
How BBB ratings work

About this community

Staffing

Key information about the people who lead and staff this community.

Leadership

ContactMs. Christa Hinton, Administrator

Contact Laurelwood Assisted Living, LLC

Health Inspection History

Inspections since 2019
Total health inspections 10

Ohio average 6.7


Last Health inspection on Mar 2025

Total health citations
30 Rank #109 / 203Health citations — State benchmarkedThis home is ranked 109th out of 203 homes in Ohio. Shows this facility's total health deficiency citations benchmarked to the Ohio State average, with a ranking across all 203 OH SNFs. Lower citation counts earn a better rank.Click the rank badge to see the full State ranking.Click here to see the full State ranking.

Ohio average 30.9

Citations per inspection
3 Rank #43 / 203Citations per inspection — State benchmarkedThis home is ranked 43rd out of 203 homes in Ohio. Shows average deficiency citations per CMS inspection for this facility versus the Ohio mean across 203 SNFs with citation data. Lower is better.Click the rank badge to see the full State ranking.Click here to see the full State ranking.

Ohio average 4.59


Health citations are formal notices following inspections when they fail to comply with safety and care standards.

17 of 30 citations resulted from standard inspections; 10 of 30 resulted from complaint investigations; and 3 of 30 came from combined inspections (standard and complaint).

Breakdown of citation severity (last 7 years)
Critical health citations
0
100% better than Ohio average

Ohio average: 0.3


Serious health citations
1
11% worse than Ohio average

Ohio average: 0.9

0 critical citations Ohio average: 0.3

1 serious citation Ohio average: 0.9

29 moderate citations Ohio average: 29

0 minor citations Ohio average: 0.7
Citations history (last 7 years)
Abuse/Neglect moderate citation Mar 06, 2025
Corrected

Abuse/Neglect moderate citation Mar 06, 2025
Corrected

Care Planning moderate citation Mar 06, 2025
Corrected

Quality of Care moderate citation Sep 03, 2024
Corrected

Staffing Data

Reporting period: October 1 – December 31, 2025 (Q4 2025). Source: CMS Payroll-Based Journal report.

Total staff 198
Employees 185
Contractors 13
Staff to resident ratio 1.48:1
27% worse than Ohio average
Ohio average ratio: 2.04:1 Ohio average ratio: 2.04:1See full Ohio ranking
Avg staff/day 59
Average shift 8.5 hours
5% better than Ohio average
Ohio average: 8.1 hours Ohio average shift: 8.1 hoursSee full Ohio ranking
Total staff hours (quarter) 46,356

Nursing staff breakdown

Q4 2025 · Oct 1 – Dec 31 More info This data comes from the CMS Payroll-Based Journal report covering October 1 – December 31, 2025.
Registered Nurse

Manages medical care and health needs.

RN Staff Info All 11 RN Staff are full-time employees. No contractors work on this role. 11
Average shift length Info Average shift length. Calculated as total hours divided by days worked and average staff per day. 11.8 hours
Licensed Practical Nurse

Assists with medical care and medications.

LPN Staff Info All 26 LPN Staff are full-time employees. No contractors work on this role. 26
Average shift length Info Average shift length. Calculated as total hours divided by days worked and average staff per day. 8.9 hours
Certified Nursing Assistant

Helps with daily care and mobility.

CNA Staff Info All 116 CNA Staff are full-time employees. No contractors work on this role. 116
Average shift length Info Average shift length. Calculated as total hours divided by days worked and average staff per day. 8.7 hours

Contractor staffing

Q4 2025 · Oct 1 – Dec 31 More info This data comes from the CMS Payroll-Based Journal report covering October 1 – December 31, 2025.

Total hours from contractors

4.1%

1,912 contractor hours this quarter

Respiratory Therapy Technician: 3 Physical Therapy Aide: 3 Physical Therapy Assistant: 3 Qualified Social Worker: 2 Speech Language Pathologist: 1 Medical Director: 1

Staff by category

Q4 2025 · Oct 1 – Dec 31 More info This data comes from the CMS Payroll-Based Journal report covering October 1 – December 31, 2025.
Certified Nursing Assistant 116 0 116 24,117 92 100% 8.7
Licensed Practical Nurse 26 0 26 8,892 92 100% 8.9
Registered Nurse 11 0 11 4,249 92 100% 11.8
Other Dietary Services Staff 12 0 12 2,178 92 100% 7.6
Nurse Practitioner 3 0 3 1,377 64 70% 8
Medication Aide/Technician 2 0 2 917 77 84% 11.4
Clinical Nurse Specialist 7 0 7 658 67 73% 4.6
Mental Health Service Worker 1 0 1 512 64 70% 8
Dental Services Staff 1 0 1 493 61 66% 8.1
Physical Therapy Aide 0 3 3 493 63 68% 7.4
Speech Language Pathologist 0 1 1 466 64 70% 7.3
Dietitian 1 0 1 432 54 59% 8
Qualified Social Worker 0 2 2 408 63 68% 6.5
Physical Therapy Assistant 0 3 3 381 57 62% 6.7
Occupational Therapy Aide 2 0 2 335 42 46% 7.4
Administrator 1 0 1 216 27 29% 8
Respiratory Therapy Technician 0 3 3 117 38 41% 3
Occupational Therapy Assistant 1 0 1 60 36 39% 1.7
Medical Director 0 1 1 47 16 17% 3
Diagnostic X-ray Services Staff 1 0 1 10 2 2% 5
116 Certified Nursing Assistant
% of Days 100%
26 Licensed Practical Nurse
% of Days 100%
11 Registered Nurse
% of Days 100%
12 Other Dietary Services Staff
% of Days 100%
3 Nurse Practitioner
% of Days 70%
2 Medication Aide/Technician
% of Days 84%
7 Clinical Nurse Specialist
% of Days 73%
1 Mental Health Service Worker
% of Days 70%
1 Dental Services Staff
% of Days 66%
3 Physical Therapy Aide
% of Days 68%
1 Speech Language Pathologist
% of Days 70%
1 Dietitian
% of Days 59%
2 Qualified Social Worker
% of Days 68%
3 Physical Therapy Assistant
% of Days 62%
2 Occupational Therapy Aide
% of Days 46%
1 Administrator
% of Days 29%
3 Respiratory Therapy Technician
% of Days 41%
1 Occupational Therapy Assistant
% of Days 39%
1 Medical Director
% of Days 17%
1 Diagnostic X-ray Services Staff
% of Days 2%

Penalties and fines

Federal penalties imposed by CMS for regulatory violations, including civil money penalties (fines) and denials of payment for new Medicare/Medicaid admissions.

Source: CMS Penalties Database

No penalties in the past 3 years

No civil money penalties or payment denials were reported in the last 3 years.

Quality of care over time

These measures show how residents usually do over time at this home, based on health outcomes and preventive care.

High-risk clinical events score Info A composite score based on pressure ulcers, falls with injury, weight loss, walking ability decline, and activities of daily living decline. 2.5
57% better than Ohio average

Ohio average: 5.8

Functional decline score Info A composite score based on activities of daily living decline, walking ability decline, and incontinence. 9.9
22% better than Ohio average

Ohio average: 12.7

Long-stay resident measures
Need for Help with Daily Activities Increased Info Percent of long-stay residents whose need for help with daily activities has increased 0.7%
90% better than Ohio average

Ohio average: 6.8%

Walking Ability Worsened Info Percent of long-stay residents whose ability to move independently worsened 0.3%
97% better than Ohio average

Ohio average: 8.9%

Low Risk Residents with Bowel/Bladder Incontinence Info Percent of low risk long-stay residents who lose control of their bowels or bladder 28.8%
31% worse than Ohio average

Ohio average: 22.0%

Falls with Major Injury Info Percent of long-stay residents experiencing one or more falls with major injury 5.8%
68% worse than Ohio average

Ohio average: 3.4%

High Risk Residents with Pressure Ulcers Info Percent of long-stay high risk residents with pressure ulcers 1.2%
68% better than Ohio average

Ohio average: 3.9%

Urinary Tract Infection Info Percent of long-stay residents with a urinary tract infection 0.0%
100% better than Ohio average

Ohio average: 0.5%

Lost Too Much Weight Info Percent of long-stay residents who lose too much weight 4.6%
26% better than Ohio average

Ohio average: 6.2%

Depressive Symptoms Info Percent of long-stay residents who have depressive symptoms 99.8%
315% worse than Ohio average

Ohio average: 24.0%

Antipsychotic Use Info Percent of long-stay residents who received an antipsychotic medication 22.3%
165% worse than Ohio average

Ohio average: 8.4%

Pneumococcal Vaccine Info Percent of long-stay residents assessed and appropriately given the pneumococcal vaccine 96.9%
5% better than Ohio average

Ohio average: 92.4%

Influenza Vaccine Info Percent of long-stay residents assessed and appropriately given the seasonal influenza vaccine 98.7%
In line with Ohio average

Ohio average: 94.5%

Short-stay resident measures
Pneumococcal Vaccine Info Percent of short-stay residents assessed and appropriately given the pneumococcal vaccine 91.6%
17% better than Ohio average

Ohio average: 78.0%

Antipsychotic medication increase Info Percent of short-stay residents who newly received an antipsychotic medication 0.0%
100% better than Ohio average

Ohio average: 1.3%

Influenza Vaccine Info Percent of short-stay residents assessed and appropriately given the seasonal influenza vaccine 97.9%
30% better than Ohio average

Ohio average: 75.6%

Breakdown by payment type

Medicare

10% of new residents, usually for short-term rehab.

Typical stay 1 - 2 months

Private pay

90% of new residents, often for short stays.

Typical stay 2 months

Facility Characteristics

Source: CMS Long-Term Care Facility Characteristics (Data as of Jan 2026)

Total residents 134
Medicare
5
3.7% of residents
Medicaid
77
57.5% of residents
Private pay or other
52
38.8% of residents
Programs & Services
Residents Group

Residents meet regularly to discuss policies, care quality, and activities

Active Resident Council

Organized group of residents that meets regularly to discuss facility policies, quality of life, and activities.

Finances and operations

Privately-owned community
Operated by a business corporation.
Home revenue
$14.5M
Operating loss
-$506.5K
Privately-owned community Operated by a business corporation.
Home revenue
$14.5M Rank #55 / 203Revenue — State benchmarkedThis home is ranked 55th out of 203 homes in Ohio. Shows this facility's annual revenue compared to the Ohio SNF average. Higher revenue generally means more resources for staffing and capital — read alongside Payroll %.Click the rank badge to see the full State ranking.Click here to see the full State ranking.
Operating loss
-$506.5K
Payroll costs Info The portion of the home's budget spent on staff, including nurses, caregivers, and other employees who support care and operations. Rank #65 / 203Payroll — State benchmarkedThis home is ranked 65th out of 203 homes in Ohio. Shows total annual staff payroll benchmarked to the Ohio average. Higher payroll investment relative to peers often signals better staffing and less reliance on cheaper contract labor.Click the rank badge to see the full State ranking.Click here to see the full State ranking.
$6.5M
45.2% of revenue Rank #155 / 203Payroll % — State benchmarkedThis home is ranked 155th out of 203 homes in Ohio. Shows payroll as a percentage of revenue versus the Ohio average. Well-run Ohio SNFs typically land around 54–64% — the top third Statewide. Below 25% may signal understaffing or heavy agency use — read with Staffing ratings.Click the rank badge to see the full State ranking.Click here to see the full State ranking.
Other operating costs Info All remaining costs needed to run the home, such as food, utilities, building maintenance, supplies and administrative expenses.
$8.5M
Total costs $15.0M

What does this home offer?

Building type icon
Building type icon

Building Type: 3-story

Fitness and recreation icon

Fitness and Recreation

Who this home usually serves

TYPE OF STAY

Primarily short stays

Residents typically stay for brief periods, with frequent admissions and discharges throughout the year.

Places of interest near Laurelwood Assisted Living, LLC

Address 15.3 miles from city center Info Estimated distance in miles from Dayton's city center to Laurelwood Assisted Living, LLC's address, calculated via Google Maps.

Calculate Travel Distance to Laurelwood Assisted Living, LLC

Add your location

Address

Financial Assistance for
Nursing Home in Ohio

Laurelwood Assisted Living, LLC is located in Dayton, Ohio.
Here are the financial assistance programs available to residents in Ohio.

Get Financial aid guidance

PASSPORT Waiver

Ohio Medicaid PASSPORT

Age 60+
General Ohio resident, Medicaid-eligible, nursing home-level care need.
Income Limits (2025) ~$2,829/month 300% FBR, individual
Asset Limits $2,000 (individual), $3,000 (couple).
OH

Administered through regional agencies; waitlists possible.

Benefits
Personal care (5-7 hours/day) Respite (240 hours/year) Adult day care ($65/day) Home modifications ($1,500 avg.)

Ohio Home Care Program (non-Medicaid)

OH HCP

Age 60+
General Ohio resident, at risk of decline.
Income Limits ~$2,000/month individual, varies
Asset Limits $5,000 individual
OH

Limited funding; regional variation.

Benefits
In-home care (3-5 hours/week) Respite (up to 10 days/year) Transportation (~5 trips/month)

Assisted Living Waiver (ALW)

Ohio Assisted Living Waiver

Age 21+ (65+ prioritized)
General OH resident, Medicaid-eligible, NFLOC.
Income Limits (2025) ~$2,829/month (individual); QIT required.
Asset Limits $2,000 (individual), $3,000 (couple).
OH

Covers ~300 facilities; room/board not included (separate cost).

Benefits
Personal care Meals Medication management Transportation (~$3,000-$4,000/month value)

Program of All-Inclusive Care for the Elderly (PACE)

Ohio PACE (e.g., McGregor PACE)

Age 55+
General OH resident (specific counties), NFLOC, safe with PACE support.
Income Limits (2025) ~$2,829/month (Medicaid-eligible); private pay option available.
Asset Limits $2,000 (individual), $3,000 (couple) for Medicaid enrollees.
OH

Available in 9 counties (e.g., Cuyahoga, Franklin); expanding via Healthy Aging Grants.

Benefits
Personal care (5-7 hours/day) Medical care Meals Transportation Respite Therapies

Medicare Savings Program (MSP)

Ohio Medicare Savings Program

Age 65+ or disabled
General OH resident, Medicare Part A/B.
Income Limits (2025) ~$2,510/month (QMB), ~$3,380/month (SLMB), ~$3,598/month (QI)—individual.
Asset Limits $9,430 (individual), $14,130 (couple).
OH

Three tiers; includes Extra Help for Part D; no waitlist.

Benefits
Covers Part B premiums ($174.70/month) Deductibles ($240/year) Copays (~20%)

Home Energy Assistance Program (HEAP)

Ohio HEAP

Age 60+ prioritized
General OH resident, low-income household.
Income Limits (2025) ~$3,970/month individual, 185% FPL
Asset Limits Not assessed; income-focused.
OH

Covers gas, electric, oil; emergency aid via Winter/Summer Crisis Programs.

Benefits
Heating/cooling aid ($300-$1,000/season) Emergency aid ($500 max)

Family Caregiver Support Program (FCSP)

Ohio Family Caregiver Support Program

Age
General Caregivers of 60+ needing care or 55+ caregivers of others; OH resident; functional needs (2+ ADLs).
Income Limits (2025) Prioritizes ~$24,980/year (individual); no strict cap.
Asset Limits Not assessed; need-based.
OH

12 AAAs; rural/low-income priority; volunteer respite option.

Benefits
Respite (4-6 hours/week or 5 days/year) Adult day care ($60/day) Training Supplies (~$500/year)

VA Aid and Attendance (A&A) and Housebound Benefits

Ohio VA Aid and Attendance/Housebound

Age 65+ or disabled veteran/spouse
General OH resident, wartime service, need for ADL help (A&A) or homebound.
Income Limits (2025) Net income < ~$1,984/month (veteran with dependent, A&A); pension offsets income.
Asset Limits ~$155,356 net worth limit
OH

High veteran demand; supports care in multiple settings.

Benefits
Cash (~$1,433-$2,642/month veteran, ~$951-$1,318 spouse) for care costs (e.g., in-home, assisted living)

Homestead Exemption

Ohio Homestead Exemption

Age 65+ (or disabled)
General OH resident, homeowner, low-income.
Income Limits (2025) ~$38,500/year individual, adjusted annually
Asset Limits Not assessed; home ownership required.
OH

Reduces taxable value by $25,000; applies to primary residence.

Benefits
Tax reduction (~$400-$800/year avg., varies by county)

Save the Dream Ohio (Homeowner Assistance Fund)

Ohio Save the Dream

Age 60+ prioritized
General OH resident, homeowner, hardship post-Jan 21, 2020.
Income Limits (2025) ~$147,600/year family of 4, 150% AMI; varies by county
Asset Limits Not assessed; hardship-focused.
OH

Covers delinquent mortgages, utilities, taxes; max $25,000 mortgage aid.

Benefits
Mortgage aid ($25,000 max) Utility/property tax aid ($5,000 avg.)

Compare Nursing Home around Montgomery County

The information below is reported by the Ohio Department of Health, Bureau of Survey and Certification.

2 facilities compared · CMS & OH Dept. of Health data

Filter by care type
Symphony at Centerville
NH

Nursing Home Licensed facility providing 24/7 skilled nursing care for residents with complex, ongoing medical needs. Staffed by RNs, LPNs, and CNAs. Inspected and star-rated annually by CMS. Accepts Medicare (short-term rehab) and Medicaid (long-term care).

MC

Memory Care Secured, specialized care for people living with Alzheimer's or dementia. Staff trained in cognitive impairment, with higher staff-to-resident ratios and an environment designed to reduce confusion and wandering risk.

Dayton 129 - - 3.13 +62% -12% $3.5k 21 3.0 - 95 - 23 Brittney Schaerer $10.0M $6.1M 61.2% 366100
Laurelwood Assisted Living, LLC
NH

Nursing Home Licensed facility providing 24/7 skilled nursing care for residents with complex, ongoing medical needs. Staffed by RNs, LPNs, and CNAs. Inspected and star-rated annually by CMS. Accepts Medicare (short-term rehab) and Medicaid (long-term care).

AL

Assisted Living A licensed, long-term care setting for seniors or individuals with disabilities who need help with daily activities — like bathing, dressing, and medication management — but not 24-hour skilled nursing. Offers housing, meals, and around-the-clock support while aiming to maximize resident independence.

MC

Memory Care Secured, specialized care for people living with Alzheimer's or dementia. Staff trained in cognitive impairment, with higher staff-to-resident ratios and an environment designed to reduce confusion and wandering risk.

Dayton (West Carrollton City) 148 - - 2.70 -39% -24% $0 30 3.0 1 141 A+ 52 Dmh Mstr Lsco, LLC $14.5M $6.5M 45.2% 365722

Frequently Asked Questions about Laurelwood Assisted Living, LLC

What neighborhood is Laurelwood Assisted Living, LLC in?

Laurelwood Assisted Living, LLC is in the West Carrollton City neighborhood of Dayton.

Is Laurelwood Assisted Living, LLC in a walkable area?

Laurelwood Assisted Living, LLC has a walk score of 52. Moderately walkable. Some errands can be accomplished on foot, with a mix of nearby amenities.

Are there photos of Laurelwood Assisted Living, LLC?

Yes — there are 4 photos of Laurelwood Assisted Living, LLC in the photo gallery on this page.

What is the phone number of Laurelwood Assisted Living, LLC?

(937) 436-6155 will put you in contact with the team at Laurelwood Assisted Living, LLC.

Is Laurelwood Assisted Living, LLC Medicare or Medicaid certified?

Yes — Laurelwood Assisted Living, LLC is a CMS-certified provider of Medicare and Medicaid.

Guides for Better Senior Living

Care Cost Calculator: See Prices in Your Area

Nursing Home Data Explorer

Don’t Wait Too Long: 7 Red Flag Signs Your Parent Needs Assisted Living Now

The True Cost of Assisted Living in 2025 – And How Families Are Paying For It

Understanding Senior Living Costs: Pricing Models, Discounts & Financial Assistance

Explore Open Rooms
1 Contact details
2 What type of senior care service are you looking for?
3 What budget do you have in mind for senior care?
4 How soon do you need to find care?
5 Additional details

Thank you for your interest!

Our team will be in touch shortly to help with next steps.