


Total health inspections
2
State average 6.7
Last Health inspection on Dec 2023
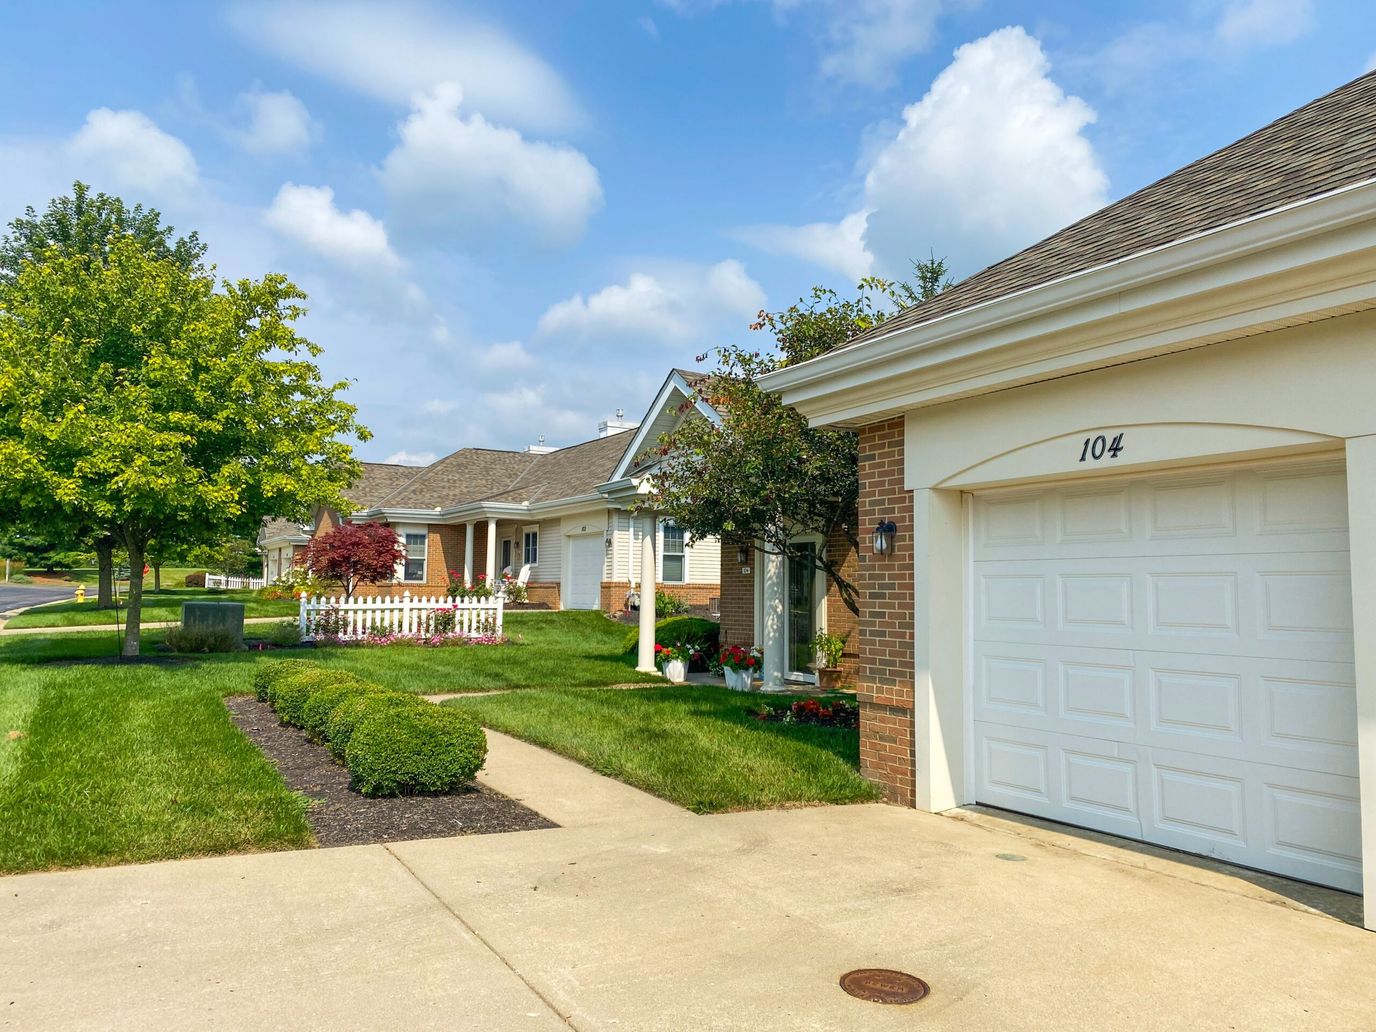


The Knolls of Oxford is an idyllic retreat peacefully nestled in the tree-laden neighborhood of Contreras Road, Oxford, OH, that provides assisted living, independent living, and skilled nursing. Here, residents receive the highest quality of care and assistance from a compassionate and well-trained team attending to their unique needs 24/7. Residents with memory-related needs also receive memory support to enhance their cognition and quality of life. The community also strives to keep residents comfortable and safe, promoting a nurturing and welcoming environment.
With its affiliation to Miami University, residents gain access to various university programs and diverse opportunities, ensuring enjoyment and wellness. Indulge in delicious and healthy meals served to meet dietary needs and preferences. Medication management, long- and short-term care, incontinence care, and health monitoring are provided to meet residents’ healthcare needs. Make every moment of your golden years memorable amidst the community’s 85 acres of serene and scenic backdrop.
| Staff type | Hours / Day / Resident | vs state avg |
|---|---|---|
|
Registered Nurse (RN)
| 36m per day | ▼ 5% State avg: 38m per day · National avg: 41m per day |
|
LPN / LVN
| 1h 9m per day | ▲ 20% State avg: 58m per day · National avg: 52m per day |
|
Nurse Aide
| 2h 3m per day | ▼ 3% State avg: 2h 7m per day · National avg: 2h 20m per day |
|
Weekend Total Nursing
| 3h 29m per day | ▲ 5% State avg: 3h 20m per day · National avg: 3h 27m per day |
|
Physical Therapist
| 2m per day | ▼ 46% State avg: 3m per day · National avg: 4m per day |
|
Weekend RN
| 22m per day | ▼ 13% State avg: 25m per day · National avg: 29m per day |
In Ohio, the Department of Health, Bureau of Survey and Certification conducts unannounced onsite inspections to evaluate the quality of care and environment in all licensed facilities.
Citations
| This Facility | OH Average | vs. OH Avg |
|---|---|---|---|
|
Total citations
| 4 | 2 | This facility has 100% more total citations than a typical Ohio nursing home (4 vs. OH avg 2).↑ 100% worse |
Every two years, the Ohio Department of Aging and the Office of the State Long-Term Care Ombudsman organizations conduct a satisfaction survey among residents in long-term care facilities to assess their quality of care and life.
Ohio average: 86 / 100
Ohio average: 89 / 100
Ohio average: 95 / 100
Ohio average: 82 / 100
Ohio average: 86 / 100
Ohio average: 89 / 100
Ohio average: 80 / 100
Ohio average: 81 / 100
Based on the RCF Resident Satisfaction Survey 2022-23, Final Results
Have you gotten or are you getting physical therapy, occupational therapy or speech therapy, while living at this care facility?
This facility33/100
Ohio average46/100
Did (Do) the therapists help you set goals?
This facility100/100
Ohio average89/100
Did (Does) the therapy help you meet your goals?
This facility100/100
Ohio average88/100
Did (Do) you know who to speak to about your therapy progress?
This facility100/100
Ohio average85/100
Can you decide how to spend your day?
This facility100/100
Ohio average94/100
Scores represent percent of positive resident responses for each item, excluding "don't know" and "not applicable" responses and instances where the question was skipped.
Based on the RCF Resident Satisfaction Survey 2022-23, Final Results
Are your personal items safe here?
This facility77/100
Ohio average92/100
Do you feel safe here?
This facility100/100
Ohio average98/100
Do you feel you have enough privacy?
This facility100/100
Ohio average95/100
Can you enjoy the outdoors if you want to?
This facility100/100
Ohio average91/100
Are you able to get around the building if you want to?
This facility100/100
Ohio average95/100
Is it easy for you to get around in your room (or apartment)?
This facility100/100
Ohio average96/100
Is it very clean here?
This facility100/100
Ohio average96/100
Can you find a place to be alone if you want to be alone?
This facility100/100
Ohio average96/100
Scores represent percent of positive resident responses for each item, excluding "don't know" and "not applicable" responses and instances where the question was skipped.
Based on the RCF Resident Satisfaction Survey 2022-23, Final Results
Did you receive a thorough orientation to KNOLLS OF OXFORD THE?
This facility63/100
Ohio average70/100
Were you given enough information to learn how things work here?
This facility71/100
Ohio average82/100
Did you feel warmly welcomed as a new resident?
This facility100/100
Ohio average93/100
Scores represent percent of positive resident responses for each item, excluding "don't know" and "not applicable" responses and instances where the question was skipped.
Based on the RCF Resident Satisfaction Survey 2022-23, Final Results
Are you friends with anyone who lives here?
This facility62/100
Ohio average81/100
Are your concerns taken care of in a timely way?
This facility83/100
Ohio average86/100
Do the people who work here tell you when rules, policies, and procedures change?
This facility89/100
Ohio average78/100
Would you highly recommend KNOLLS OF OXFORD THE to someone who needs this type of care?
This facility92/100
Ohio average89/100
Overall, are you satisfied with the care you receive here?
This facility100/100
Ohio average94/100
Are you encouraged to speak up about things you don’t like here?
This facility100/100
Ohio average81/100
Are you as involved in decisions about your care as you want to be?
This facility100/100
Ohio average85/100
Do the people who work here seem happy to work here?
This facility100/100
Ohio average92/100
Do the people who work here go above and beyond to give you a good life?
This facility100/100
Ohio average87/100
Do the people who work here help you with technology, if needed?
This facility100/100
Ohio average89/100
Scores represent percent of positive resident responses for each item, excluding "don't know" and "not applicable" responses and instances where the question was skipped.
Based on the RCF Resident Satisfaction Survey 2022-23, Final Results
Do the same people take care of you most of the time?
This facility75/100
Ohio average84/100
Do the people who work here check on you often enough to see if you need anything?
This facility85/100
Ohio average81/100
Are the people who work here knowledgeable about your medical conditions and treatments?
This facility90/100
Ohio average90/100
Do the people who care for you explain your care and services to you?
This facility92/100
Ohio average85/100
Do the people who work here ever get angry at you?
This facility100/100
Ohio average88/100
Do the people who work here do things the way you want them done?
This facility100/100
Ohio average88/100
Do the people who work here make sure you are comfortable when they provide care or services?
This facility100/100
Ohio average95/100
Do the people who work here do everything they can to protect you from getting sick?
This facility100/100
Ohio average94/100
Do the people who work here support you to do as much for yourself as you are able to do?
This facility100/100
Ohio average96/100
Do you have opportunities to maintain your health and wellness, if you want?
This facility100/100
Ohio average92/100
Do you feel confident the people who work here would come quickly anytime you needed help?
This facility100/100
Ohio average85/100
Scores represent percent of positive resident responses for each item, excluding "don't know" and "not applicable" responses and instances where the question was skipped.
Based on the RCF Resident Satisfaction Survey 2022-23, Final Results
Are there enjoyable things to do on the weekends, if you want?
This facility75/100
Ohio average63/100
Do you have plenty of opportunities to do things that are meaningful to you?
This facility82/100
Ohio average83/100
Do you usually enjoy how you spend your time?
This facility83/100
Ohio average87/100
Are you as connected to the community as you want to be?
This facility83/100
Ohio average71/100
Do you like the activities here?
This facility91/100
Ohio average83/100
Do you feel included in life here?
This facility92/100
Ohio average89/100
Do you have something to look forward to most days?
This facility92/100
Ohio average77/100
Do you have enough opportunities to go on outings and special events?
This facility92/100
Ohio average73/100
Are you able to do the activities offered here, if you want?
This facility92/100
Ohio average93/100
Scores represent percent of positive resident responses for each item, excluding "don't know" and "not applicable" responses and instances where the question was skipped.
Based on the RCF Resident Satisfaction Survey 2022-23, Final Results
Do you have input on the food that is served?
This facility69/100
Ohio average68/100
Does the menu change often enough?
This facility92/100
Ohio average77/100
Do you like the food here?
This facility92/100
Ohio average81/100
Do you get enough to eat here?
This facility100/100
Ohio average95/100
Do you get enough fresh food options here?
This facility100/100
Ohio average81/100
Do you look forward to mealtimes?
This facility100/100
Ohio average80/100
Scores represent percent of positive resident responses for each item, excluding "don't know" and "not applicable" responses and instances where the question was skipped.
State average 6.7
Last Health inspection on Dec 2023
State average 30.9
State average 4.59
Health citations are formal notices following inspections when they fail to comply with safety and care standards.
3 of 4 citations resulted from standard inspections; and 1 of 4 resulted from complaint investigations.
State average: 0.3
State average: 0.9
Reporting period: October 1 – December 31, 2025 (Q4 2025). Source: CMS Payroll-Based Journal report.
Manages medical care and health needs.
Assists with medical care and medications.
Helps with daily care and mobility.
Total hours from contractors
1,812 contractor hours this quarter
| Certified Nursing Assistant | 33 | 0 | 33 | 8,773 | 92 | 100% | 8.4 |
| Licensed Practical Nurse | 15 | 0 | 15 | 4,923 | 92 | 100% | 8.1 |
| Registered Nurse | 5 | 0 | 5 | 1,409 | 85 | 92% | 9.2 |
| Dietitian | 4 | 0 | 4 | 1,343 | 89 | 97% | 7.2 |
| Clinical Nurse Specialist | 2 | 0 | 2 | 720 | 63 | 68% | 6 |
| Mental Health Service Worker | 2 | 0 | 2 | 546 | 63 | 68% | 4.8 |
| Administrator | 1 | 0 | 1 | 488 | 61 | 66% | 8 |
| Qualified Social Worker | 0 | 2 | 2 | 463 | 57 | 62% | 8.1 |
| Nurse Practitioner | 1 | 0 | 1 | 448 | 56 | 61% | 8 |
| Speech Language Pathologist | 0 | 4 | 4 | 402 | 63 | 68% | 5.7 |
| Physical Therapy Aide | 0 | 2 | 2 | 337 | 61 | 66% | 5.5 |
| Occupational Therapy Aide | 0 | 1 | 1 | 227 | 38 | 41% | 6 |
| Physical Therapy Assistant | 0 | 2 | 2 | 209 | 55 | 60% | 3.8 |
| Respiratory Therapy Technician | 0 | 2 | 2 | 123 | 28 | 30% | 3.7 |
| Medical Director | 0 | 1 | 1 | 33 | 13 | 14% | 2.5 |
| Occupational Therapy Assistant | 0 | 1 | 1 | 18 | 3 | 3% | 6 |
Federal penalties imposed by CMS for regulatory violations, including civil money penalties (fines) and denials of payment for new Medicare/Medicaid admissions.
Source: CMS Penalties Database
No penalties in the past 3 years
No civil money penalties or payment denials were reported in the last 3 years.
These measures show how residents usually do over time at this home, based on health outcomes and preventive care.
Ohio average: 5.8
Ohio average: 12.7
Ohio average: 6.8%
Ohio average: 8.9%
Ohio average: 22.0%
Ohio average: 3.4%
Ohio average: 3.9%
Ohio average: 0.5%
Ohio average: 6.2%
Ohio average: 24.0%
Ohio average: 8.4%
Ohio average: 92.4%
Ohio average: 94.5%
Ohio average: 78.0%
Ohio average: 1.3%
Ohio average: 75.6%
Quality measures are calculated from Minimum Data Set (MDS) assessments. For most measures, lower percentages indicate better care quality.
33% of new residents, usually for short-term rehab.
63% of new residents, often for short stays.
4% of new residents, often for long-term daily care.
Source: CMS Long-Term Care Facility Characteristics (Data as of Jan 2026)
Residents meet regularly to discuss policies, care quality, and activities
Part of a Continuing Care Retirement Community offering multiple care levels
Organized group of residents that meets regularly to discuss facility policies, quality of life, and activities.
Data sourced from CMS Long-Term Care Facility Characteristics quarterly report. Payer mix reflects the current resident census by primary payment source.
Historical financial and operational data for The Knolls of Oxford from 2012–2023, based on CMS SNF Cost Reports.
Key figures below are for fiscal year ending in 12/2023.
Based on CMS SNF Cost Report for fiscal year ending in 12/2023.
Pets Allowed
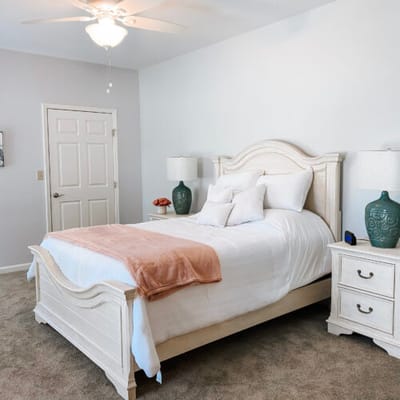
Room Sizes: 1,783 - 2,603 sq. ft
Housing Options: Private / 1 Bed / 2 Bed / 3 Bed Rooms
Building Type: Single-story
Beauty Services
Transportation Services
Housekeeping Services
Recreational Activities

Parking Available
Residents typically stay for brief periods, with frequent admissions and discharges throughout the year.
Most new residents arrive under private pay (63% of admissions), and a typical private pay stay runs around 4 - 5 months.
Coverage residents most often arrive under.
Coverage residents most often leave under.
![]() 2.0 miles from city center
2.0 miles from city center
![]() Estimated distance in miles from Oxford's city center to The Knolls of Oxford's address, calculated via Google Maps.
Estimated distance in miles from Oxford's city center to The Knolls of Oxford's address, calculated via Google Maps.
Add your location
The information below is reported by the Ohio Department of Health, Bureau of Survey and Certification.
| Brookdale Westlake Village | NH AL IL MC SNF | Westlake | 60
Facility
60
OH AVG
75
Rank
#177 / 309 |
96.7%
Facility
96.7%
OH AVG
81.7
Rank
#4 / 138 | +18% | 4.38
Facility
4.38
OH AVG
3.54
Rank
#25 / 199 | +18% | +24% | $0
Facility
$0
OH AVG
$74.0k
Rank
#1 / 200 | 5
Facility
5
OH AVG
30.9
Rank
#10 / 199 | 1.3
Facility
1.3
OH AVG
4.6
Rank
#2 / 199 | - | 58 | A+ |
25
Facility
25
OH AVG
40
Rank
#500 / 704 | Labeed Diab | $20.1MFiscal year ending 12/2023
Facility
$20.1MFiscal year ending 12/2023
OH AVG
$10.1M
Rank
#74 / 199 | $10.2MFiscal year ending 12/2023
Facility
$10.2MFiscal year ending 12/2023
OH AVG
$3.9M
Rank
#14 / 199 | 50.8%Fiscal year ending 12/2023
Facility
50.8%Fiscal year ending 12/2023
OH AVG
40.2%
Rank
#6 / 199 | 366373 | ||||
| The Knolls of Oxford | NH AL IL MC SNF | Oxford | 50
Facility
50
OH AVG
75
Rank
#214 / 309 |
92.8%
Facility
92.8%
OH AVG
81.7
Rank
#25 / 138 | +14% | 4.09
Facility
4.09
OH AVG
3.54
Rank
#42 / 199 | -31% | +15% | $0
Facility
$0
OH AVG
$74.0k
Rank
#1 / 200 | 4
Facility
4
OH AVG
30.9
Rank
#4 / 199 | 2.0
Facility
2.0
OH AVG
4.6
Rank
#11 / 199 | - | 46 | - |
0
Facility
0
OH AVG
40
Rank
#686 / 704 | Ronald Beymer | $6.2MFiscal year ending 12/2023
Facility
$6.2MFiscal year ending 12/2023
OH AVG
$10.1M
Rank
#157 / 199 | $4.3MFiscal year ending 12/2023
Facility
$4.3MFiscal year ending 12/2023
OH AVG
$3.9M
Rank
#130 / 199 | 69.5%Fiscal year ending 12/2023
Facility
69.5%Fiscal year ending 12/2023
OH AVG
40.2%
Rank
#22 / 199 | 366282 | ||||
| Elizabeth Scott Community | NH AL MC SNF | Maumee | 60
Facility
60
OH AVG
75
Rank
#177 / 309 |
86.7%
Facility
86.7%
OH AVG
81.7
Rank
#68 / 138 | +6% | 3.52
Facility
3.52
OH AVG
3.54
Rank
#95 / 199 | -64% | -1% | $0
Facility
$0
OH AVG
$74.0k
Rank
#1 / 200 | 9
Facility
9
OH AVG
30.9
Rank
#22 / 199 | 2.3
Facility
2.3
OH AVG
4.6
Rank
#17 / 199 | - | 52 | A+ |
0
Facility
0
OH AVG
40
Rank
#686 / 704 | Elizabeth Scott, Inc | $6.7MFiscal year ending 12/2023
Facility
$6.7MFiscal year ending 12/2023
OH AVG
$10.1M
Rank
#140 / 199 | $3.2MFiscal year ending 12/2023
Facility
$3.2MFiscal year ending 12/2023
OH AVG
$3.9M
Rank
#129 / 199 | 48%Fiscal year ending 12/2023
Facility
48%Fiscal year ending 12/2023
OH AVG
40.2%
Rank
#58 / 199 | 366184 | ||||
| Locust Ridge | NH MC RC SNF | Williamsburg | 61
Facility
61
OH AVG
75
Rank
#174 / 309 |
90.2%
Facility
90.2%
OH AVG
81.7
Rank
#42 / 138 | +10% | 4.46
Facility
4.46
OH AVG
3.54
Rank
#21 / 199 | +35% | +26% | $0
Facility
$0
OH AVG
$74.0k
Rank
#1 / 200 | 18
Facility
18
OH AVG
30.9
Rank
#51 / 199 | 4.5
Facility
4.5
OH AVG
4.6
Rank
#117 / 199 | - | 55 | A+ |
0
Facility
0
OH AVG
40
Rank
#686 / 704 | Gary Vannostrand | $5.9MFiscal year ending 12/2023
Facility
$5.9MFiscal year ending 12/2023
OH AVG
$10.1M
Rank
#168 / 199 | $2.7MFiscal year ending 12/2023
Facility
$2.7MFiscal year ending 12/2023
OH AVG
$3.9M
Rank
#161 / 199 | 45.2%Fiscal year ending 12/2023
Facility
45.2%Fiscal year ending 12/2023
OH AVG
40.2%
Rank
#40 / 199 | 365336 | ||||
| Otterbein SeniorLife | NH AL HC HOS IL MC SNF | Lebanon | 154
Facility
154
OH AVG
75
Rank
#10 / 309 |
90.5%
Facility
90.5%
OH AVG
81.7
Rank
#40 / 138 | +11% | 3.84
Facility
3.84
OH AVG
3.54
Rank
#59 / 199 | -1% | +8% | $0
Facility
$0
OH AVG
$74.0k
Rank
#1 / 200 | 25
Facility
25
OH AVG
30.9
Rank
#89 / 199 | 5.0
Facility
5.0
OH AVG
4.6
Rank
#140 / 199 | 1 | 139 | - |
0
Facility
0
OH AVG
40
Rank
#686 / 704 | Otterbein Homes | $19.8MFiscal year ending 12/2023
Facility
$19.8MFiscal year ending 12/2023
OH AVG
$10.1M
Rank
#8 / 199 | $10.3MFiscal year ending 12/2023
Facility
$10.3MFiscal year ending 12/2023
OH AVG
$3.9M
Rank
#11 / 199 | 52%Fiscal year ending 12/2023
Facility
52%Fiscal year ending 12/2023
OH AVG
40.2%
Rank
#191 / 199 | 365346 |
The Knolls of Oxford's occupancy is 80.1%.
Yes, The Knolls of Oxford allows residents to bring their pets.
The team at The Knolls of Oxford can be reached at TMCGOWAN@MKCOMMUNITIES.ORG.
The Knolls of Oxford is registered as a for-profit in OH.
The Knolls of Oxford has had 4 reported citations according to records from Ohio Department of Aging (ODA).
Yes — there are 7 photos of The Knolls of Oxford in the photo gallery on this page.
The Knolls of Oxford is located at 6727 Contreras Rd, Oxford, OH 45056.
Care Cost Calculator: See Prices in Your Area
Nursing Home Data Explorer
Don’t Wait Too Long: 7 Red Flag Signs Your Parent Needs Assisted Living Now
The True Cost of Assisted Living in 2025 – And How Families Are Paying For It
Understanding Senior Living Costs: Pricing Models, Discounts & Financial Assistance


