The Normandy | Senior & Assisted Living with Memory Care & Skilled Care
Nursing Home, Assisted Living, Independent Living, Memory Care & Respite Care · Rocky River, OH
CMS overall rating Info CMS (the Centers for Medicare & Medicaid Services) is the federal agency that rates nursing home quality. Its Overall Rating runs from 1 to 5 stars, combining health inspections, staffing, and quality measures, with inspections weighted most heavily.

The Normandy | Senior & Assisted Living with Memory Care & Skilled Care

Nursing Home, Assisted Living, Independent Living, Memory Care & Respite Care · Rocky River, OH
CMS overall rating Info CMS (the Centers for Medicare & Medicaid Services) is the federal agency that rates nursing home quality. Its Overall Rating runs from 1 to 5 stars, combining health inspections, staffing, and quality measures, with inspections weighted most heavily.
Calculator: See prices in your area
The Normandy | Senior & Assisted Living with Memory Care & Skilled Care accepts Medicare, Medicaid, and private pay.

Overview of The Normandy | Senior & Assisted Living with Memory Care & Skilled Care

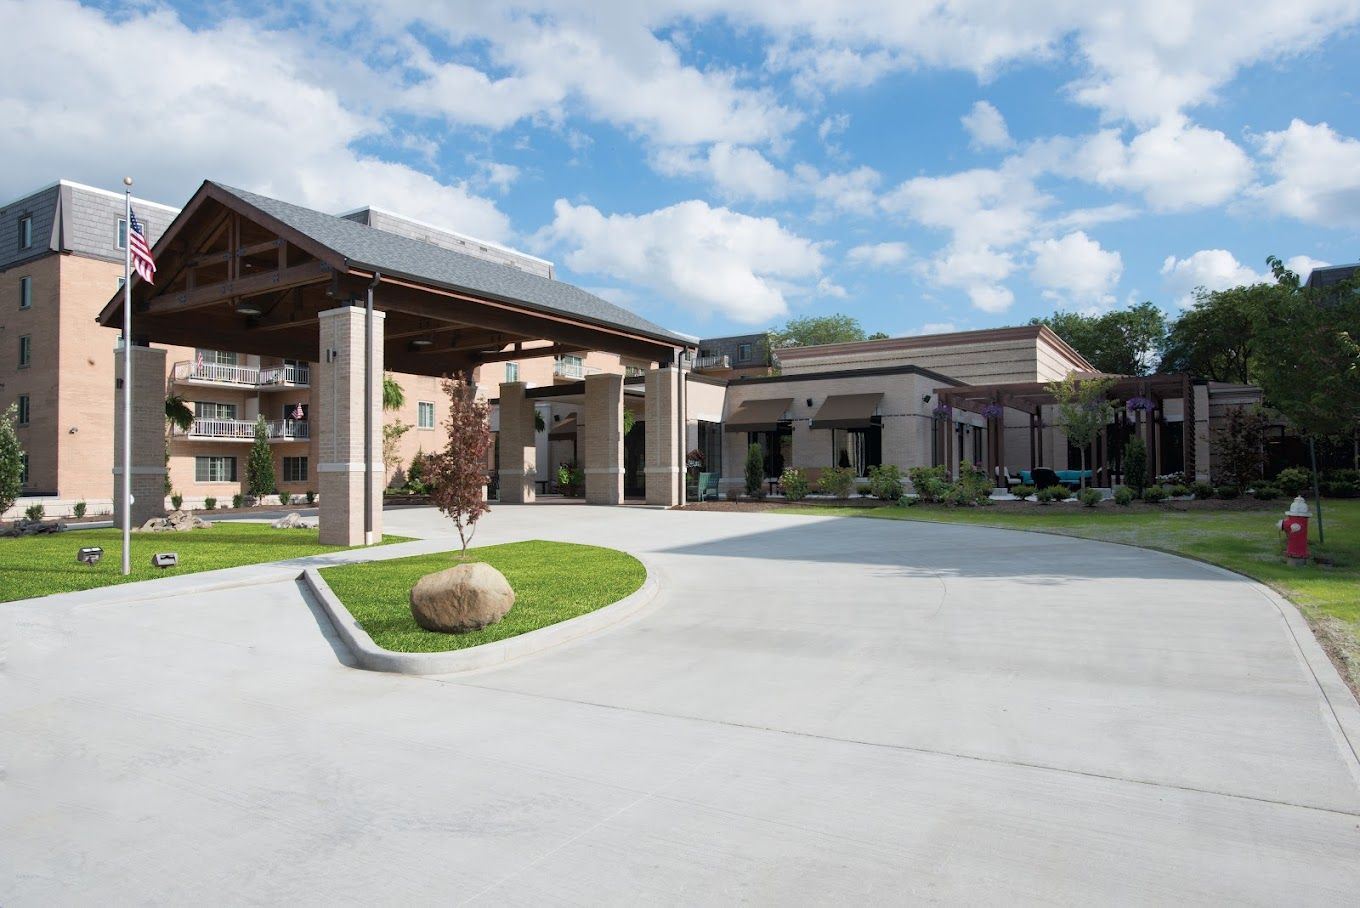
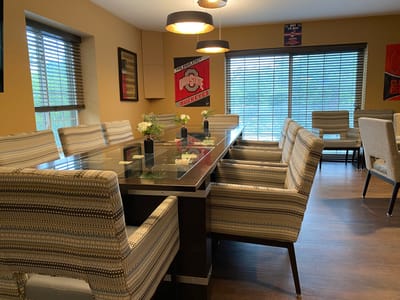
Tucked away in Summit County, Rocky River, OH, The Normandy Senior Living is an excellent senior living community that offers independent living, assisted living, or skilled care. Nestled on more than 30 acres of beautifully landscaped and wooded grounds in the vibrant Rocky River, the community offers a perfect balance of proximity to city life and nature. Residents can rest easy in spacious, well-appointed senior apartments and enjoy a maintenance-free lifestyle and 24/7 safety and support provided by a dedicated team.

With most of the tedious tasks handled, residents can prioritize living their retirement life to the fullest with a broad range of engaging activities, live entertainment, and social events right outside their doors. Residents also enjoy three chef-prepared meals a day, without the hassle of grocery shopping, dishes, and cleanup, providing them further convenience and comfort. With a continuum of care and access to an array of vibrant activities and amenities, residents are guaranteed to successfully age in place.

Quality ratings

Measured by Centers for Medicare & Medicaid Services (CMS)

Overall rating Info The Overall CMS Rating combines results from health inspections, staffing levels and quality measures. Health inspections carry the most weight. Staffing and quality scores can increase or decrease the final rating based on performance compared to state and national standards.
Health Inspection Info Based on the results of the facility's three most recent standard inspections and any complaint investigations. CMS reviews the number, scope, and severity of deficiencies, with more recent findings weighted more heavily.
Staffing Info Measures average nursing staff hours per resident per day, including Registered Nurses (RNs) and total nursing staff. Ratings are adjusted based on the level of care residents require and are compared to state and national benchmarks.
Quality Measures Info Based on clinical and physical health indicators reported to CMS, such as hospital readmissions, falls, pressure ulcers, and improvements in mobility. These measures reflect how well residents' health needs are being managed.

Staffing hours breakdown

Info Daily nursing hours per resident by staff type, reported to CMS. Higher is generally better — compare this facility to state and national averages to see where staffing stands.

Hours per resident per day — compared to state averages

Total nursing care / resident Info Total adjusted nursing hours per resident per day, combining RN, LPN, and aide time. CMS adjusts this for case-mix so facilities can be fairly compared.
3h 40m per day
Rank #72 / 210Nurse hours — State benchmarkedThis home is ranked 72nd out of 210 homes in Ohio. Shows adjusted nurse hours per resident per day benchmarked to the Ohio average, with a ranking across 210 Ohio facilities. More hours mean more direct care. The national average is about 3.5 hrs; below 3.0 is a red flag.Rankings are based only on facilities in Ohio that report data for that category. Facilities without available data are excluded from the ranking.Click the rank badge to see the full State ranking.Click here to see the full State ranking.
vs avg
Staff typeHours / Day / Residentvs state avg
Registered Nurse (RN) Info RNs hold the highest nursing license and can assess residents, interpret test results, and direct care plans. More RN hours per day often signals stronger clinical oversight and faster response to health changes. 24m per day
LPN / LVN Info Licensed Practical Nurses (LPNs) or Licensed Vocational Nurses (LVNs) deliver routine hands-on care — medication administration, wound dressing, and monitoring vital signs. They work under RN supervision and make up a large share of daily bedside care. 44m per day
Nurse Aide Info Certified Nurse Aides (CNAs) provide the most direct day-to-day assistance: bathing, dressing, feeding, and mobility. Nurse aide hours are typically the largest staffing category and directly affect residents' quality of life. 1h 57m per day
Weekend Total Nursing Info Combined nursing hours (RN + LPN + Nurse Aide) per resident per day on weekends. Staffing often drops on weekends — this figure reveals whether the facility maintains adequate coverage outside of weekday hours. 2h 44m per day
Physical Therapist Info Hours per resident per day provided by licensed Physical Therapists (PTs) or PT Assistants. PT services help residents recover mobility after injury or illness and are especially important for post-acute (short-stay) rehabilitation. 2m per day
Weekend RN Info Registered nurse hours specifically on weekends. Facilities sometimes reduce RN presence on Saturdays and Sundays — a low weekend RN figure compared to weekday hours can indicate reduced clinical oversight when most administrative staff are absent. 14m per day

Capacity and availability

This home usually has availability

Lower occupancy than the state average
Occupancy rate
81.8% Rank #124 / 211Occupancy rate — State benchmarkedThis home is ranked 124th out of 211 homes in Ohio. Shows this facility's occupancy rate versus the Ohio average, with its Statewide rank out of 211. Higher occupancy signals strong local demand and financial stability.Rankings are based only on facilities in Ohio that report data for that category. Facilities without available data are excluded from the ranking.Click the rank badge to see the full State ranking.Click here to see the full State ranking.
Avg. Length of Stay
89 days
Bed community size
150-bed community Rank #15 / 323Bed count — State benchmarkedThis home is ranked 15th out of 323 homes in Ohio. Shows this facility's certified or reported bed count compared to other Ohio facilities. Larger communities may offer more amenities, programs, and on-site services for residents and families.Rankings are based only on facilities in Ohio that report data for that category. Facilities without available data are excluded from the ranking.Click the rank badge to see the full State ranking.Click here to see the full State ranking.
A larger shared setting that may offer more common spaces and organized community services.
Walk Score
Walk Score: 12 / 100 Rank #606 / 705Walk Score — State benchmarkedThis home is ranked 606th out of 705 homes in Ohio. Shows how walkable this facility's neighborhood is compared to the average Walk Score across Ohio facilities. Higher scores benefit residents, families, and staff.Rankings are based only on facilities in Ohio that report data for that category. Facilities without available data are excluded from the ranking.Click the rank badge to see the full State ranking.Click here to see the full State ranking.
Car-dependent. Most errands require a car, with limited nearby walkable options.

Therapy & Rehabilitation

2 services
Rehabilitation Services
Respite Care

Staffing & Medical

1 service
24-Hour Staffing

Amenities & Lifestyle

Activities
Religious Services

Contact The Normandy | Senior & Assisted Living with Memory Care & Skilled Care

Staffing Data

Reporting period: October 1 – December 31, 2025 (Q4 2025). Source: CMS Payroll-Based Journal report.

Total staff 207
Employees 179
Contractors 28
Staff to resident ratio 1.64 : 1
0% compared with State average

State average ratio: 0 : 0

Avg staff/day 60
Average shift 8.2 hours
0% compared with State average

State average: 0 hours

Total staff hours (quarter) 45,253

Nursing staff breakdown

Q4 2025 · Oct 1 – Dec 31 More info This data comes from the CMS Payroll-Based Journal report covering October 1 – December 31, 2025.
Registered Nurse

Manages medical care and health needs.

RN Staff Info All 18 RN Staff are full-time employees. No contractors work on this role. 18
Average shift length Info Average shift length. Calculated as total hours divided by days worked and average staff per day. 9.5 hours
Licensed Practical Nurse

Assists with medical care and medications.

LPN Staff Info All 38 LPN Staff are full-time employees. No contractors work on this role. 38
Average shift length Info Average shift length. Calculated as total hours divided by days worked and average staff per day. 8.8 hours
Certified Nursing Assistant

Helps with daily care and mobility.

CNA Staff Info All 99 CNA Staff are full-time employees. No contractors work on this role. 99
Average shift length Info Average shift length. Calculated as total hours divided by days worked and average staff per day. 8.3 hours

Contractor staffing

Q4 2025 · Oct 1 – Dec 31 More info This data comes from the CMS Payroll-Based Journal report covering October 1 – December 31, 2025.

Total hours from contractors

7.1%

3,225 contractor hours this quarter

Physical Therapy Aide: 7 Qualified Social Worker: 6 Speech Language Pathologist: 6 Respiratory Therapy Technician: 3 Physical Therapy Assistant: 2 Medical Director: 2 Clinical Nurse Specialist: 1 Occupational Therapy Assistant: 1

Staff by category

Q4 2025 · Oct 1 – Dec 31 More info This data comes from the CMS Payroll-Based Journal report covering October 1 – December 31, 2025.
Certified Nursing Assistant9909923,2608289%8.3
Licensed Practical Nurse380388,2388289%8.8
Dietitian140143,4379098%7.4
Registered Nurse180183,2478188%9.5
Clinical Nurse Specialist4151,1576065%7.9
Mental Health Service Worker2029646874%7.8
Qualified Social Worker0669017076%6.7
Physical Therapy Aide0776537480%6.6
Speech Language Pathologist0665866166%7.2
Physical Therapy Assistant0225236470%7.2
Administrator1015126470%8
RN Director of Nursing1015006368%7.9
Respiratory Therapy Technician0334556874%6.7
Nurse Practitioner1014385560%8
Occupational Therapy Aide1013073639%8.5
Occupational Therapy Assistant0114478%6.3
Medical Director022321617%2
99 Certified Nursing Assistant
% of Days 89%
38 Licensed Practical Nurse
% of Days 89%
14 Dietitian
% of Days 98%
18 Registered Nurse
% of Days 88%
5 Clinical Nurse Specialist
% of Days 65%
2 Mental Health Service Worker
% of Days 74%
6 Qualified Social Worker
% of Days 76%
7 Physical Therapy Aide
% of Days 80%
6 Speech Language Pathologist
% of Days 66%
2 Physical Therapy Assistant
% of Days 70%
1 Administrator
% of Days 70%
1 RN Director of Nursing
% of Days 68%
3 Respiratory Therapy Technician
% of Days 74%
1 Nurse Practitioner
% of Days 60%
1 Occupational Therapy Aide
% of Days 39%
1 Occupational Therapy Assistant
% of Days 8%
2 Medical Director
% of Days 17%

Penalties and fines

Federal penalties imposed by CMS for regulatory violations, including civil money penalties (fines) and denials of payment for new Medicare/Medicaid admissions.

Source: CMS Penalties Database

No penalties in the past 3 years

No civil money penalties or payment denials were reported in the last 3 years.

Quality of care over time

These measures show how residents usually do over time at this home, based on health outcomes and preventive care.

High-risk clinical events score Info A composite score based on pressure ulcers, falls with injury, weight loss, walking ability decline, and activities of daily living decline. 4.9
17% better than State average

State average: 5.8

Functional decline score Info A composite score based on activities of daily living decline, walking ability decline, and incontinence. 12.2
In line with State average

State average: 12.7

Long-stay resident measures
Need for Help with Daily Activities Increased Info Percent of long-stay residents whose need for help with daily activities has increased 2.9%
57% better than State average

State average: 6.8%

Walking Ability Worsened Info Percent of long-stay residents whose ability to move independently worsened 5.1%
43% better than State average

State average: 8.9%

Low Risk Residents with Bowel/Bladder Incontinence Info Percent of low risk long-stay residents who lose control of their bowels or bladder 28.4%
29% worse than State average

State average: 22.0%

Falls with Major Injury Info Percent of long-stay residents experiencing one or more falls with major injury 5.2%
53% worse than State average

State average: 3.4%

High Risk Residents with Pressure Ulcers Info Percent of long-stay high risk residents with pressure ulcers 3.0%
24% better than State average

State average: 3.9%

Urinary Tract Infection Info Percent of long-stay residents with a urinary tract infection 0.0%
100% better than State average

State average: 0.5%

Lost Too Much Weight Info Percent of long-stay residents who lose too much weight 8.1%
30% worse than State average

State average: 6.2%

Depressive Symptoms Info Percent of long-stay residents who have depressive symptoms 0.5%
98% better than State average

State average: 24.0%

Antipsychotic Use Info Percent of long-stay residents who received an antipsychotic medication 11.4%
36% worse than State average

State average: 8.4%

Pneumococcal Vaccine Info Percent of long-stay residents assessed and appropriately given the pneumococcal vaccine 95.4%
In line with State average

State average: 92.4%

Influenza Vaccine Info Percent of long-stay residents assessed and appropriately given the seasonal influenza vaccine 98.4%
In line with State average

State average: 94.5%

Short-stay resident measures
Pneumococcal Vaccine Info Percent of short-stay residents assessed and appropriately given the pneumococcal vaccine 80.9%
In line with State average

State average: 78.0%

Antipsychotic medication increase Info Percent of short-stay residents who newly received an antipsychotic medication 0.0%
100% better than State average

State average: 1.3%

Influenza Vaccine Info Percent of short-stay residents assessed and appropriately given the seasonal influenza vaccine 88.4%
17% better than State average

State average: 75.6%

Breakdown by payment type

Medicare

14% of new residents, usually for short-term rehab.

Typical stay 26 days

Private pay

54% of new residents, often for short stays.

Typical stay 1 - 2 months

Medicaid

32% of new residents, often for long-term daily care.

Typical stay 5 - 6 months

Facility Characteristics

Source: CMS Long-Term Care Facility Characteristics (Data as of Jan 2026)

Total residents 126
Medicare
5
4% of residents
Medicaid
69
54.8% of residents
Private pay or other
52
41.3% of residents
Programs & Services
Residents Group

Residents meet regularly to discuss policies, care quality, and activities

Active Resident Council

Organized group of residents that meets regularly to discuss facility policies, quality of life, and activities.

Finances and operations

Based on CMS SNF Cost Report for fiscal year ending in 12/2023.

For-profit
Operated by a single business entity.
Net patient revenue Info Net patient revenue — what the home actually collects for resident care, after contractual allowances, bad debt and discounts are subtracted from its gross charges (CMS cost report, Worksheet G-3). It covers resident care only; money the home earns from other sources is shown separately as "Other income."
$12.4M
Net patient income Info Net patient income: net patient revenue minus the home's total operating expenses. A positive figure means it earns more from resident care than it spends to deliver it; a negative figure means the opposite. It excludes non-operating "other income."
-$3.7M
For-profit Operated by a single business entity.
Net patient revenue Info Net patient revenue — what the home actually collects for resident care, after contractual allowances, bad debt and discounts are subtracted from its gross charges (CMS cost report, Worksheet G-3). It covers resident care only; money the home earns from other sources is shown separately as "Other income."
$12.4M Rank #30 / 210Revenue — State benchmarkedThis home is ranked 30th out of 210 homes in Ohio. Shows this facility's annual revenue compared to the Ohio average. Higher revenue generally means more resources for staffing and capital — read alongside Payroll %.Rankings are based only on facilities in Ohio that report data for that category. Facilities without available data are excluded from the ranking.Click the rank badge to see the full State ranking.Click here to see the full State ranking.
Net patient income Info Net patient income: net patient revenue minus the home's total operating expenses. A positive figure means it earns more from resident care than it spends to deliver it; a negative figure means the opposite. It excludes non-operating "other income."
-$3.7M
Other income Info Money the home earns outside of resident care — such as investments, grants, rentals and other non-operating sources (CMS cost report, Worksheet G-3). It is tracked separately from net patient revenue: it is not part of that figure, and it is not included in net patient income.
$2.0M
Payroll costs Info Staff salaries plus wage-related costs — benefits such as payroll taxes, health insurance and retirement — from the home's own accounting records (CMS cost report, Worksheet A). Contract or agency labor is counted separately, under other operating costs. Rank #41 / 210Payroll — State benchmarkedThis home is ranked 41st out of 210 homes in Ohio. Shows total annual staff payroll benchmarked to the Ohio average. Higher payroll investment relative to peers often signals better staffing and less reliance on cheaper contract labor.Rankings are based only on facilities in Ohio that report data for that category. Facilities without available data are excluded from the ranking.Click the rank badge to see the full State ranking.Click here to see the full State ranking.
$7.9M 63.5% of net patient revenue Info Payroll as a share of revenue: staff salaries and wage-related benefits divided by net patient revenue. A higher figure means more of each revenue dollar goes to staff pay. Rank #151 / 210Payroll % — State benchmarkedThis home is ranked 151st out of 210 homes in Ohio. Shows payroll as a percentage of revenue versus the Ohio average. Well-run Ohio facilities typically land around 54–64% — the top third Statewide. Below 25% may signal understaffing or heavy agency use — read with Staffing ratings.Rankings are based only on facilities in Ohio that report data for that category. Facilities without available data are excluded from the ranking.Click the rank badge to see the full State ranking.Click here to see the full State ranking.
Other operating costs Info Everything it costs to run the home apart from payroll — food, utilities, supplies, maintenance, contract labor and administration. Calculated as total operating expense minus payroll (staff salaries and wage-related benefits).
$8.2M
Total costs Info The home's total operating expense for the year — all the costs of running it, salaries included (CMS cost report, Worksheet G-3).
$16.1M

What does this home offer?

Minimum age icon
Minimum age icon

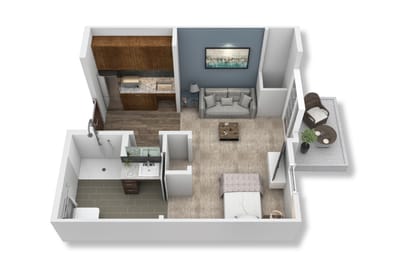
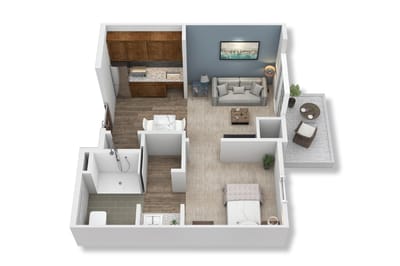
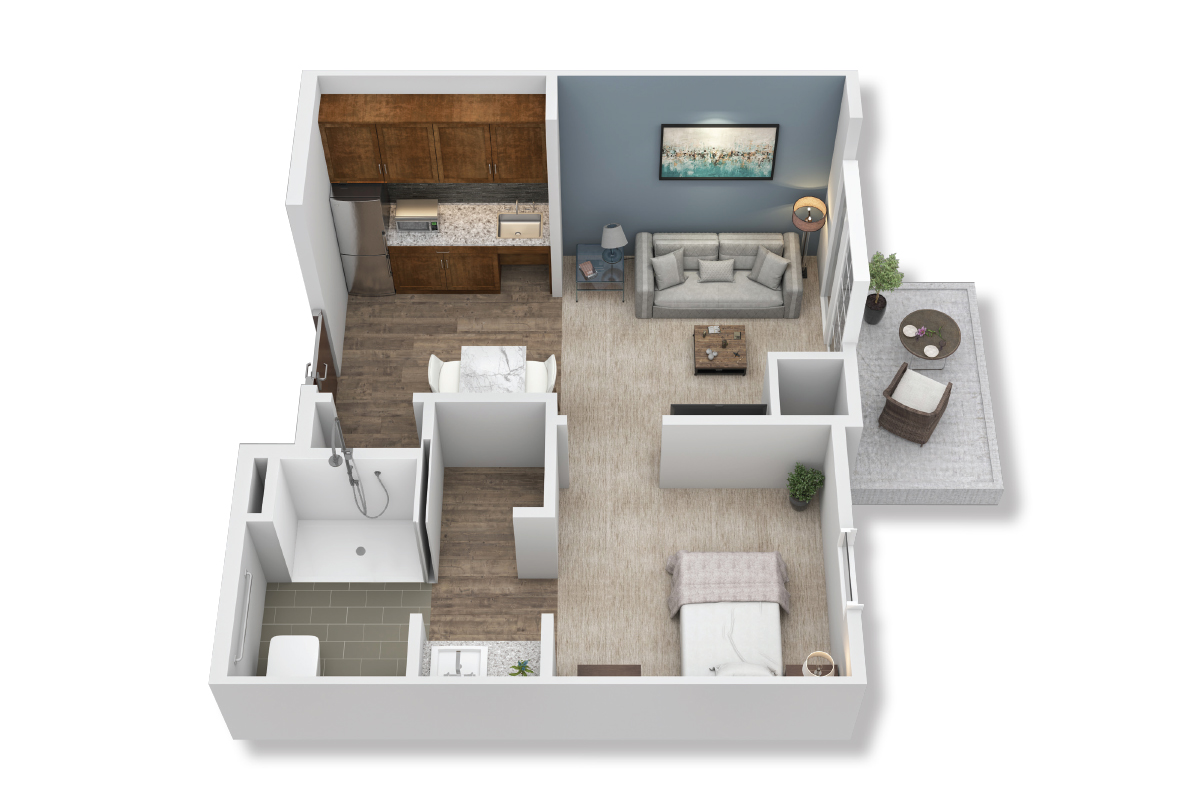
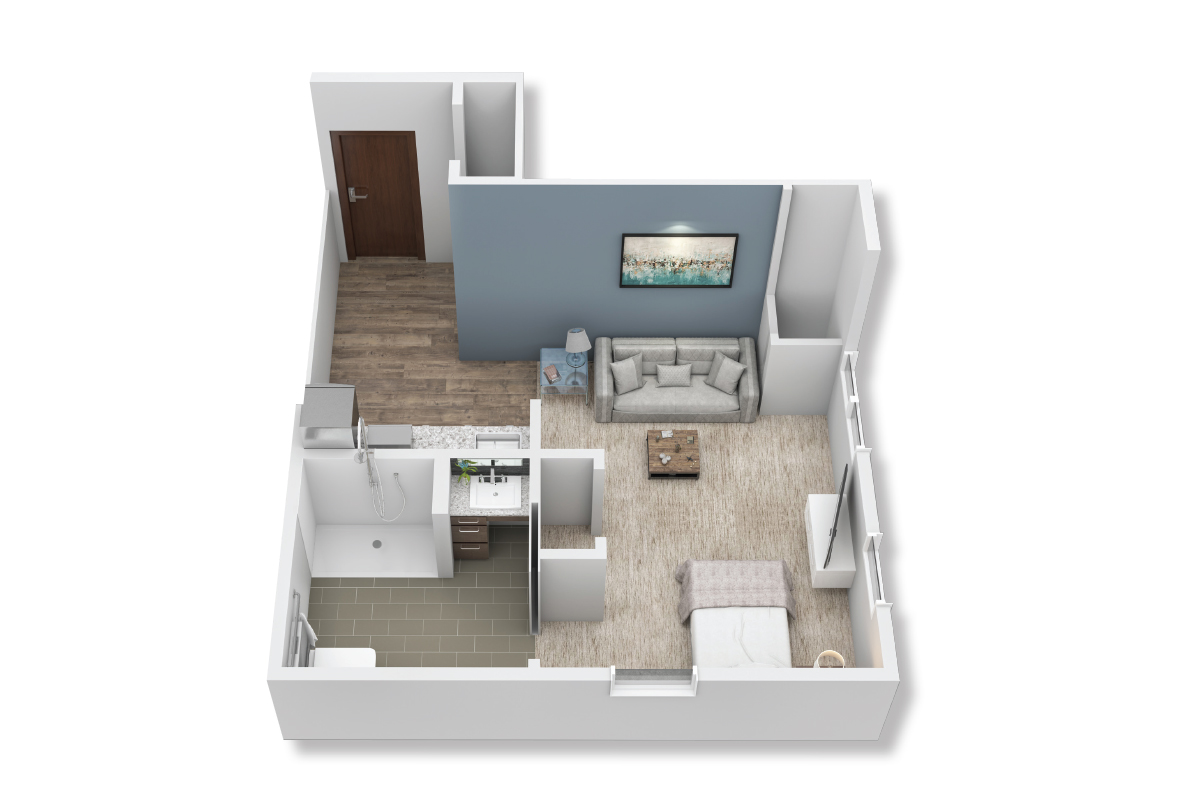
Minimum Age: 55 Years Old

Room sizes icon
Room sizes icon

Room Sizes: 346 / 402 / 431

Housing options icon

Housing Options: Studio / 1 Bed / 2 Bed

Transportation services icon

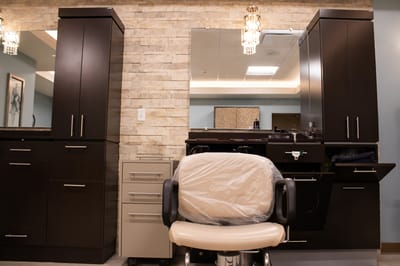
Transportation Services

Fitness and recreation icon

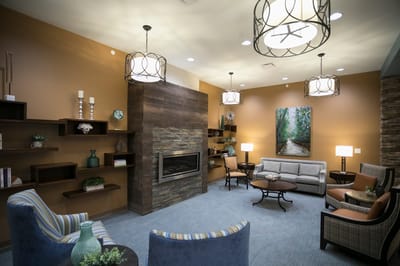
Fitness and Recreation

Who this home usually serves

TYPE OF STAY

Mix of rehab and long-term care

This home supports both short-term rehab and long-term care, with residents staying for a wide range of durations.

Most new residents arrive under private pay (54% of admissions), and a typical private pay stay runs around 1 - 2 months.

Admissions
504 total

Coverage residents most often arrive under.

Medicare 14%
Private pay 54%
Medicaid 32%
Discharges
503 total

Coverage residents most often leave under.

Medicare 15%
Private pay 57%
Medicaid 28%

Living Spaces & Floor Plans for The Normandy | Senior & Assisted Living with Memory Care & Skilled Care

Places of interest near The Normandy | Senior & Assisted Living with Memory Care & Skilled Care

Address 1.7 miles from city center Info Estimated distance in miles from Rocky River's city center to The Normandy | Senior & Assisted Living with Memory Care & Skilled Care's address, calculated via Google Maps.

Calculate Travel Distance to The Normandy | Senior & Assisted Living with Memory Care & Skilled Care

Add your location

Address

Compare Nursing Homes around the area

The information below is reported by the Ohio Department of Health, Bureau of Survey and Certification.

The Normandy | Senior & Assisted Living with Memory Care & Skilled Care
NH
AL
IL
MC
RC
Rocky River -150 - 12 Studio / 1 Bed / 2 Bed
Beachwood Commons by New Perspective
NH
AL
IL
MC
Beachwood -120 A+ 15 Studio / 1 Bed
Brookdale Westlake Village
NH
AL
IL
MC
Westlake -60 A+ 25 1 Bed / 2 Bed
Elizabeth Scott Community
NH
AL
MC
Maumee -60 A+ 0 Studio / 1 Bed
Genoa Retirement Village
NH
AL
IL
MC
Genoa -68 A+ 17 Studio / 1 Bed / 2 Bed

Frequently Asked Questions about The Normandy | Senior & Assisted Living with Memory Care & Skilled Care

What neighborhood is The Normandy | Senior & Assisted Living with Memory Care & Skilled Care in?

The Normandy | Senior & Assisted Living with Memory Care & Skilled Care is in the Rocky River neighborhood.

Is The Normandy | Senior & Assisted Living with Memory Care & Skilled Care in a walkable area?

The Normandy | Senior & Assisted Living with Memory Care & Skilled Care has a walk score of 12. Car-dependent. Most errands require a car, with limited nearby walkable options.

What is the occupancy rate at The Normandy | Senior & Assisted Living with Memory Care & Skilled Care?

The Normandy | Senior & Assisted Living with Memory Care & Skilled Care's occupancy is 81.8%.

Does The Normandy | Senior & Assisted Living with Memory Care & Skilled Care have different floorplan options?

Yes — see the floorplan options available at The Normandy | Senior & Assisted Living with Memory Care & Skilled Care on this page.

Does The Normandy | Senior & Assisted Living with Memory Care & Skilled Care operate as a for-profit or non-profit?

The Normandy | Senior & Assisted Living with Memory Care & Skilled Care is registered as a for-profit.

Are there photos of The Normandy | Senior & Assisted Living with Memory Care & Skilled Care?

Yes — there are 15 photos of The Normandy | Senior & Assisted Living with Memory Care & Skilled Care in the photo gallery on this page.

What is the address of The Normandy | Senior & Assisted Living with Memory Care & Skilled Care?

The Normandy | Senior & Assisted Living with Memory Care & Skilled Care is located at 22701 Lake Rd, Rocky River, OH 44116.

Guides for Better Senior Living

Care Cost Calculator: See Prices in Your Area

Nursing Home Data Explorer

Don’t Wait Too Long: 7 Red Flag Signs Your Parent Needs Assisted Living Now

The True Cost of Assisted Living in 2025 – And How Families Are Paying For It

Understanding Senior Living Costs: Pricing Models, Discounts & Financial Assistance