


Total staff
299
Employees
140
Contractors
159
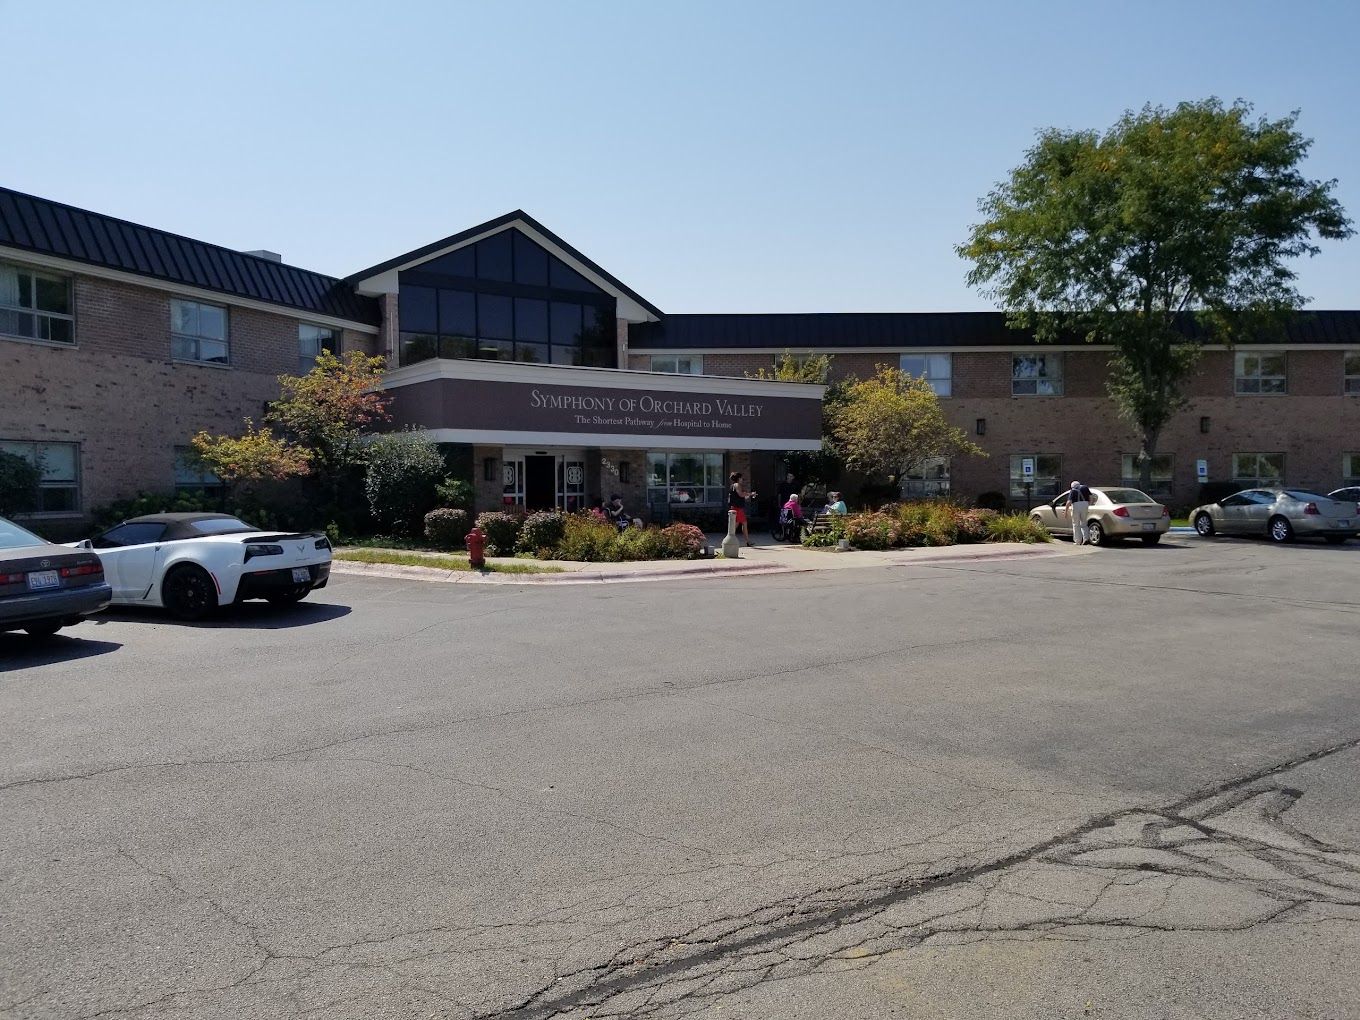
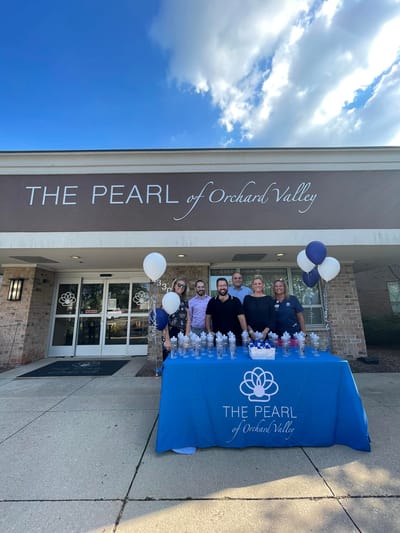
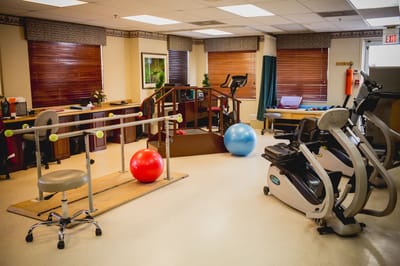

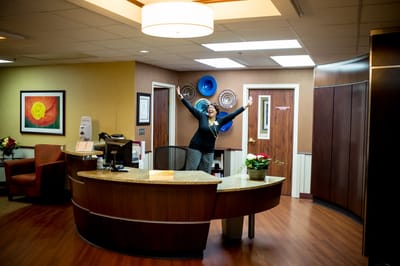
The Pearl of Orchard Valley is a nursing home in Aurora, IL, that offers comprehensive care options, including long-term care, memory care, rehabilitation, and in-house dialysis. The community also ensures older adults are well-cared for with its supportive and welcoming environment. Therapy services, respite care, and 24-hour support are among the exceptional services provided to meet residents’ needs and preferences. Focusing on residents’ welfare, the community seamlessly combines compassionate care and clinical excellence.
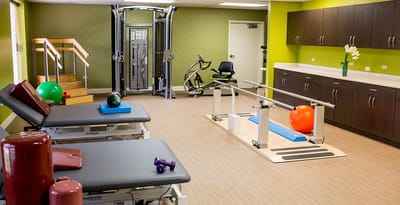
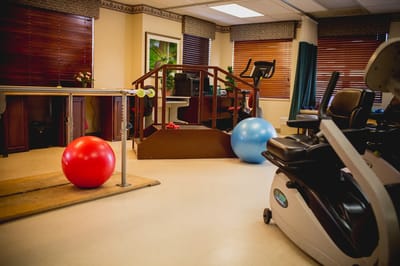
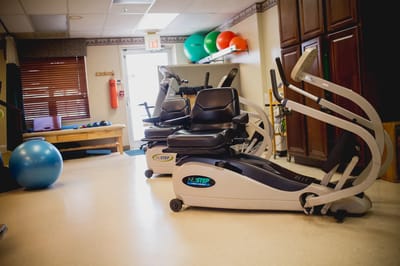
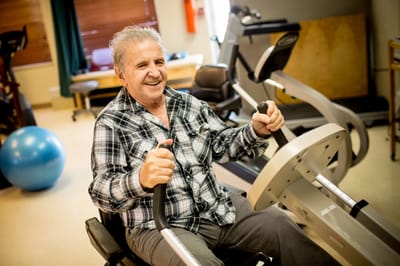
Chess, light exercises, and fun gatherings provide residents with more opportunities to interact with friends and live actively. State-of-the-art rehabilitation equipment and spacious gathering areas are also available for residents’ relaxation and wellness. Restaurants, a bank, shops, bus stops, and green spaces also surround the area, ensuring a laid-back and convenient lifestyle. This nursing home has high standards of care, making it a great choice for senior living in Illinois.
| Staff type | Hours / Day / Resident | vs state avg |
|---|---|---|
|
Registered Nurse (RN)
| 46m per day | ▲ 4% State avg: 44m per day · National avg: 41m per day |
|
LPN / LVN
| 35m per day | ▼ 8% State avg: 38m per day · National avg: 52m per day |
|
Nurse Aide
| 1h 51m per day | ▼ 13% State avg: 2h 8m per day · National avg: 2h 21m per day |
|
Weekend Total Nursing
| 2h 46m per day | ▼ 10% State avg: 3h 5m per day · National avg: 3h 26m per day |
|
Physical Therapist
| 2m per day | ▼ 21% State avg: 3m per day · National avg: 4m per day |
|
Weekend RN
| 32m per day | ▼ 5% State avg: 34m per day · National avg: 29m per day |
Reporting period: October 1 – December 31, 2025 (Q4 2025). Source: CMS Payroll-Based Journal report.
Manages medical care and health needs.
Assists with medical care and medications.
Helps with daily care and mobility.
Total hours from contractors
5,982 contractor hours this quarter
| Certified Nursing Assistant | 84 | 43 | 127 | 22,538 | 92 | 100% | 7.9 |
| Registered Nurse | 21 | 69 | 90 | 7,886 | 92 | 100% | 8.1 |
| Licensed Practical Nurse | 20 | 27 | 47 | 7,292 | 92 | 100% | 8.2 |
| Clinical Nurse Specialist | 3 | 2 | 5 | 1,307 | 66 | 72% | 6.7 |
| Other Dietary Services Staff | 2 | 0 | 2 | 967 | 91 | 99% | 7.8 |
| Speech Language Pathologist | 0 | 2 | 2 | 871 | 65 | 71% | 7.9 |
| Medication Aide/Technician | 0 | 7 | 7 | 805 | 40 | 43% | 10.1 |
| Physical Therapy Assistant | 0 | 5 | 5 | 620 | 66 | 72% | 6.8 |
| Respiratory Therapy Technician | 0 | 2 | 2 | 498 | 76 | 83% | 6 |
| Mental Health Service Worker | 2 | 0 | 2 | 468 | 62 | 67% | 7.4 |
| Qualified Social Worker | 0 | 1 | 1 | 446 | 64 | 70% | 7 |
| Dietitian | 1 | 0 | 1 | 443 | 59 | 64% | 7.5 |
| Nurse Practitioner | 2 | 0 | 2 | 398 | 53 | 58% | 7.5 |
| Administrator | 2 | 0 | 2 | 383 | 53 | 58% | 7.2 |
| Qualified Activities Professional | 2 | 0 | 2 | 383 | 39 | 42% | 7.5 |
| Physical Therapy Aide | 0 | 1 | 1 | 24 | 3 | 3% | 8 |
| RN Director of Nursing | 1 | 0 | 1 | 0 | 3 | 3% | 0.1 |
Includes penalties issued in 2024-2025
Federal penalties imposed by CMS for regulatory violations, including civil money penalties (fines) and denials of payment for new Medicare/Medicaid admissions.
Source: CMS Penalties Database (Data as of Jan 2026)
Illinois average: $143K
Illinois average: 3.0
Illinois average: 1.1
Penalties are imposed by CMS for violations of federal nursing home regulations.
4 penalties in the past 3 years
Multiple penalties were reported in the last 3 years.
Last updated: Jan 2026
These measures show how residents usually do over time at this home, based on health outcomes and preventive care.
Illinois average: 9.7
Illinois average: 18.6
Illinois average: 15.5%
Illinois average: 18.4%
Illinois average: 21.6%
Illinois average: 3.4%
Illinois average: 5.3%
Illinois average: 1.8%
Illinois average: 6.5%
Illinois average: 48.1%
Illinois average: 20.2%
Illinois average: 89.2%
Illinois average: 91.6%
Illinois average: 2.05
Illinois average: 2.25
Illinois average: 68.3%
Illinois average: 2.3%
Illinois average: 63.0%
Illinois average: 26.2%
Illinois average: 14.0%
Illinois average: 0.8%
Illinois average: 53.7%
Illinois average: 50.6%
Quality measures are calculated from Minimum Data Set (MDS) assessments. For most measures, lower percentages indicate better care quality.
21% of new residents, usually for short-term rehab.
9% of new residents, often for short stays.
70% of new residents, often for long-term daily care.
Source: CMS Long-Term Care Facility Characteristics (Data as of Jan 2026)
Residents meet regularly to discuss policies, care quality, and activities
Organized group of residents that meets regularly to discuss facility policies, quality of life, and activities.
Data sourced from CMS Long-Term Care Facility Characteristics quarterly report. Payer mix reflects the current resident census by primary payment source.
Historical financial and operational data for The Pearl of Orchard Valley from 2011–2023, based on CMS SNF Cost Reports.
Key figures below are for fiscal year ending in 12/2023.
Based on CMS SNF Cost Report for fiscal year ending in 12/2023.
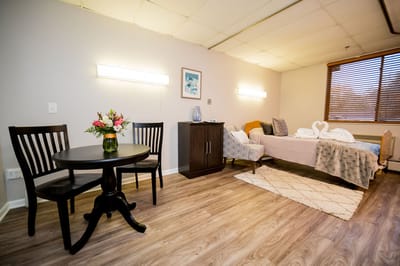
No pets allowed
Housing Options: Private / Semi-Private Rooms
Building Type: 2-story
Most residents stay for extended periods and receive ongoing daily care.
Most new residents arrive under Medicaid (70% of admissions), and a typical Medicaid stay runs around 5 - 6 months.
Coverage residents most often arrive under.
Coverage residents most often leave under.
![]() 2.8 miles from city center
2.8 miles from city center
![]() Estimated distance in miles from Aurora's city center to The Pearl of Orchard Valley's address, calculated via Google Maps.
Estimated distance in miles from Aurora's city center to The Pearl of Orchard Valley's address, calculated via Google Maps.
Add your location
Info below is compiled from CMS reports & the IL Dept. of Public Health (IDPH), senior community websites & trusted data sources such as Walk Score & BBB.
Communities are listed from highest to lowest based on our ranking methodology.
| Thrive of Fox Valley | NH MC SNF | Aurora | 68
Facility
68
IL AVG
85
Rank
#214 / 419 |
98.8%
Facility
98.8%
IL AVG
73
Rank
#3 / 157 | +35% | 3.09
Facility
3.09
IL AVG
3.10
Rank
#64 / 155 | +82% | 0% | $0
Facility
$0
IL AVG
$151.3k
Rank
#1 / 155 | 23
Facility
23
IL AVG
36.8
Rank
#50 / 155 | 2.1
Facility
2.1
IL AVG
3.7
Rank
#12 / 155 | - | 67 | - |
79
Facility
79
IL AVG
51
Rank
#109 / 648 | Ih Fox Valley LLC | $13.5MFiscal year ending 12/2023
Facility
$13.5MFiscal year ending 12/2023
IL AVG
$12.2M
Rank
#54 / 154 | $6.7MFiscal year ending 12/2023
Facility
$6.7MFiscal year ending 12/2023
IL AVG
$4.8M
Rank
#91 / 154 | 49.4%Fiscal year ending 12/2023
Facility
49.4%Fiscal year ending 12/2023
IL AVG
44.3%
Rank
#141 / 154 | 146194 | ||||
| Alden Courts of Waterford | NH AL MC RC SNF | Aurora | 60
Facility
60
IL AVG
85
Rank
#249 / 419 |
90.0%
Facility
90.0%
IL AVG
73
Rank
#30 / 157 | +23% | 3.60
Facility
3.60
IL AVG
3.10
Rank
#51 / 155 | +38% | +16% | $0
Facility
$0
IL AVG
$151.3k
Rank
#1 / 155 | 20
Facility
20
IL AVG
36.8
Rank
#38 / 155 | 3.3
Facility
3.3
IL AVG
3.7
Rank
#59 / 155 | - | 54 | A+ |
58
Facility
58
IL AVG
51
Rank
#253 / 648 | Steven Kroll | $6.8MFiscal year ending 12/2023
Facility
$6.8MFiscal year ending 12/2023
IL AVG
$12.2M
Rank
#142 / 154 | $3.8MFiscal year ending 12/2023
Facility
$3.8MFiscal year ending 12/2023
IL AVG
$4.8M
Rank
#144 / 154 | 56.2%Fiscal year ending 12/2023
Facility
56.2%Fiscal year ending 12/2023
IL AVG
44.3%
Rank
#41 / 154 | 146182 | ||||
| The Grove Fox Valley | NH MC SNF | Farnsworth Aurora (North Farnsworth Avenue) | 158
Facility
158
IL AVG
85
Rank
#41 / 419 |
80.3%
Facility
80.3%
IL AVG
73
Rank
#68 / 157 | +10% | 2.50
Facility
2.50
IL AVG
3.10
Rank
#122 / 155 | -1% | -19% | $0
Facility
$0
IL AVG
$151.3k
Rank
#1 / 155 | 25
Facility
25
IL AVG
36.8
Rank
#56 / 155 | 4.2
Facility
4.2
IL AVG
3.7
Rank
#115 / 155 | 1 | 127 | A+ |
49
Facility
49
IL AVG
51
Rank
#344 / 648 | Doros Generation Trust U/A/D 1/3/12 | $13.7MFiscal year ending 12/2023
Facility
$13.7MFiscal year ending 12/2023
IL AVG
$12.2M
Rank
#53 / 154 | $8.0MFiscal year ending 12/2023
Facility
$8.0MFiscal year ending 12/2023
IL AVG
$4.8M
Rank
#60 / 154 | 58%Fiscal year ending 12/2023
Facility
58%Fiscal year ending 12/2023
IL AVG
44.3%
Rank
#101 / 154 | 145006 | ||||
| Jennings Terrace | NH HOS RC SNF | Aurora | 60
Facility
60
IL AVG
85
Rank
#249 / 419 |
80.0%
Facility
80.0%
IL AVG
73
Rank
#70 / 157 | +10% | 2.93
Facility
2.93
IL AVG
3.10
Rank
#79 / 155 | +27% | -5% | $0
Facility
$0
IL AVG
$151.3k
Rank
#1 / 155 | 21
Facility
21
IL AVG
36.8
Rank
#41 / 155 | 5.3
Facility
5.3
IL AVG
3.7
Rank
#138 / 155 | - | 48 | - |
80
Facility
80
IL AVG
51
Rank
#104 / 648 | Jomarie Silver | $5.6MFiscal year ending 06/2024
Facility
$5.6MFiscal year ending 06/2024
IL AVG
$12.2M
Rank
#140 / 154 | $3.5MFiscal year ending 06/2024
Facility
$3.5MFiscal year ending 06/2024
IL AVG
$4.8M
Rank
#142 / 154 | 62.6%Fiscal year ending 06/2024
Facility
62.6%Fiscal year ending 06/2024
IL AVG
44.3%
Rank
#60 / 154 | 146197 | ||||
| The Pearl of Orchard Valley | NH MC RC SNF | Aurora (West Galena Boulevard) | 203
Facility
203
IL AVG
85
Rank
#25 / 419 |
67.3%
Facility
67.3%
IL AVG
73
Rank
#109 / 157 | -8% | 2.80
Facility
2.80
IL AVG
3.10
Rank
#89 / 155 | +112% | -10% | $542.4k
Facility
$542.4k
IL AVG
$151.3k
Rank
#155 / 155 | 60
Facility
60
IL AVG
36.8
Rank
#130 / 155 | 4.0
Facility
4.0
IL AVG
3.7
Rank
#105 / 155 | 7 | 137 | - |
61
Facility
61
IL AVG
51
Rank
#223 / 648 | Brittany Herwig | $10.8MFiscal year ending 12/2023
Facility
$10.8MFiscal year ending 12/2023
IL AVG
$12.2M
Rank
#120 / 154 | $5.6MFiscal year ending 12/2023
Facility
$5.6MFiscal year ending 12/2023
IL AVG
$4.8M
Rank
#97 / 154 | 52%Fiscal year ending 12/2023
Facility
52%Fiscal year ending 12/2023
IL AVG
44.3%
Rank
#27 / 154 | 145473 |
The Pearl of Orchard Valley is located in Aurora, Illinois.
Here are the financial assistance programs available to residents in Illinois.
The Pearl of Orchard Valley is in the West Galena Boulevard neighborhood.
The Pearl of Orchard Valley has a walk score of 61. Moderately walkable. Some errands can be accomplished on foot, with a mix of nearby amenities.
The Pearl of Orchard Valley's occupancy is 51.8%.
No, The Pearl of Orchard Valley has a no-pet policy.
The Pearl of Orchard Valley is registered as a for-profit.
Yes — there are 13 photos of The Pearl of Orchard Valley in the photo gallery on this page.
The Pearl of Orchard Valley is located at 2330 W Galena Blvd, Aurora, IL 60506.
Care Cost Calculator: See Prices in Your Area
Nursing Home Data Explorer
Don’t Wait Too Long: 7 Red Flag Signs Your Parent Needs Assisted Living Now
The True Cost of Assisted Living in 2025 – And How Families Are Paying For It
Understanding Senior Living Costs: Pricing Models, Discounts & Financial Assistance


