


Gray Manor Assisted Living, LLC III
Gray Manor Assisted Living, LLC III
Live your golden years free from stress and worries with Gray Manor Assisted Living, LLC III, a reliable community in Baltimore, MD designed for assisted living. Residents feel safe and comfortable with a team of kind and reliable caregivers available 24 hours a day, 7 days a week. By offering compassionate assistance with daily living activities like personal care and medication management, the community allows residents to focus on their well-being and happiness.
Dedicated to fostering a vibrant living environment, the community provides an intimate setting that allows for meaningful interactions. Through proper personalized care and focused attention, residents here are able to maintain their independence and continue living the lifestyle they want. Here, everyone experiences an improved quality of life amidst a safe and secure living environment.
5-bed community Rank #436 / 697Bed count — State benchmarkedThis home is ranked 436th out of 697 homes in Maryland. Shows this facility's certified or reported bed count compared to other Maryland facilities. Larger communities may offer more amenities, programs, and on-site services for residents and families.Rankings are based only on facilities in Maryland that report data for that category. Facilities without available data are excluded from the ranking.Click the rank badge to see the full State ranking.Click here to see the full State ranking.
A smaller, more intimate setting that may offer a quieter environment and closer staff-resident interactions.
Walk Score: 75 / 100 Rank #131 / 985Walk Score — State benchmarkedThis home is ranked 131st out of 985 homes in Maryland. Shows how walkable this facility's neighborhood is compared to the average Walk Score across Maryland facilities. Higher scores benefit residents, families, and staff.Rankings are based only on facilities in Maryland that report data for that category. Facilities without available data are excluded from the ranking.Click the rank badge to see the full State ranking.Click here to see the full State ranking.
Very walkable. Most errands can be accomplished on foot, and many essentials are within a short walk.
About this community
CountyBaltimore City
Inspection History
In Maryland, the Department of Health, Office of Health Care Quality is the state agency that conducts unannounced inspections and issues reports for all assisted living and nursing facilities.
Inspection Scorecard
 This scorecard compares key inspection, citation, and complaint metrics at this facility against the Maryland state average. Metrics rated ≥15% worse than average are highlighted in red; those ≥15% better are highlighted in green.
Overall vs. MD average
0 Worse
No metrics in this bucket.
0 Better
No metrics in this bucket.
Citations
| This Facility | MD Average | vs. MD Avg |
|---|---|---|---|
|
Total citations
| 7 | — | — |
What does this home offer?
Housing Options: Private / Shared Rooms
Building Type: 2-story
Recreational Activities
Places of interest near Gray Manor Assisted Living, LLC III
![]() 4.7 miles from city center
4.7 miles from city center
![]() Estimated distance in miles from Baltimore's city center to Gray Manor Assisted Living, LLC III's address, calculated via Google Maps.
Estimated distance in miles from Baltimore's city center to Gray Manor Assisted Living, LLC III's address, calculated via Google Maps.
Calculate Travel Distance to Gray Manor Assisted Living, LLC III
Add your location
Compare Assisted Living around Baltimore
The information below is reported by the Maryland Department of Health, Office of Health Care Quality.
| Sunrise of Annapolis | AL MC | Annapolis | 106
Facility
106
MD AVG
43
Rank
#105 / 697 | Yes |
38
Facility
38
MD AVG
43
Rank
#542 / 985 | Studio / 1 Bed / 2 Bed | 30
Facility
30
MD AVG
21
Rank
#44 / 208 | - |
31% Male Residents — State Benchmarked 31% of residents are male, compared to the Maryland average of 31%. This facility caters to a majority female resident pool (69% female), consistent with the broader assisted living trend where women significantly outnumber men. |
69% Female Residents — State Benchmarked 69% of residents are female, compared to the Maryland average of 69%. Women comprise the large majority, consistent with national assisted living demographics where women live longer and enter care facilities at higher rates. |
90% White Residents — State Benchmarked 90% of residents are reported as White, compared to the Maryland average of 81%. A higher White share than is typical for assisted living in Maryland in this dataset — compare with peer facilities for local context. |
6% African American Residents — State Benchmarked 6% of residents are reported as African American or Black, compared to the Maryland average of 13%. In line with the Maryland average for African American residents among facilities reporting this breakdown. |
4% Other Ethnicity Residents — State Benchmarked 4% of residents fall into categories other than White or African American (combined), compared to the Maryland average of 6%. This column aggregates Hispanic, Asian, multiracial, and any other labeled groups that are not classified as White or African American. Reported subgroups in this total: American Indian (1%), Hawaiian/Pacific Islander (1%), Hispanic (1%). |
12% Residents Age 65–74 — State Benchmarked 12% of residents are 65–74, compared to the Maryland average of 13%. In line with the statewide profile for this youngest senior bracket in assisted living. |
22% Residents Age 75–84 — State Benchmarked 22% of residents are 75–84, compared to the Maryland average of 31%. Below the state norm — the resident mix may skew either younger or older than this typical middle bracket. |
65% Residents Age 85–94 — State Benchmarked 65% of residents are 85–94, compared to the Maryland average of 44%. A high concentration of very elderly residents signals a higher-acuity facility with experience caring for advanced age-related needs. | - |
| Brightview Towson | AL MC | Towson (Loch Raven) | 100
Facility
100
MD AVG
43
Rank
#117 / 697 | No |
92
Facility
92
MD AVG
43
Rank
#17 / 985 | Studio / 1 Bed / 2 Bed | 14
Facility
14
MD AVG
21
Rank
#138 / 208 | - |
28% Male Residents — State Benchmarked 28% of residents are male, compared to the Maryland average of 31%. This facility caters to a majority female resident pool (72% female), consistent with the broader assisted living trend where women significantly outnumber men. |
72% Female Residents — State Benchmarked 72% of residents are female, compared to the Maryland average of 69%. Women comprise the large majority, consistent with national assisted living demographics where women live longer and enter care facilities at higher rates. |
0% White Residents — State Benchmarked 0% of residents are reported as White, compared to the Maryland average of 81%. A lower White share than the Maryland average — the community may draw a more diverse resident mix relative to other facilities in Maryland. |
0% African American Residents — State Benchmarked 0% of residents are reported as African American or Black, compared to the Maryland average of 13%. A lower African American share than is typical in Maryland; local markets still vary widely. |
100% Other Ethnicity Residents — State Benchmarked 100% of residents fall into categories other than White or African American (combined), compared to the Maryland average of 6%. This column aggregates Hispanic, Asian, multiracial, and any other labeled groups that are not classified as White or African American. Reported subgroups in this total: Other (100%). | - | - | - | - |
| Brightview Mays Chapel Ridge | AL IL MC | Timonium (Dixon Hill) | 89
Facility
89
MD AVG
43
Rank
#160 / 697 | No |
52
Facility
52
MD AVG
43
Rank
#402 / 985 | Studio / 1 Bed / 2 Bed | 50
Facility
50
MD AVG
21
Rank
#1 / 208 | A+ |
13% Male Residents — State Benchmarked 13% of residents are male, compared to the Maryland average of 31%. This facility caters to a majority female resident pool (87% female), consistent with the broader assisted living trend where women significantly outnumber men. |
87% Female Residents — State Benchmarked 87% of residents are female, compared to the Maryland average of 69%. Women comprise the large majority, consistent with national assisted living demographics where women live longer and enter care facilities at higher rates. |
99% White Residents — State Benchmarked 99% of residents are reported as White, compared to the Maryland average of 81%. A higher White share than is typical for assisted living in Maryland in this dataset — compare with peer facilities for local context. |
0% African American Residents — State Benchmarked 0% of residents are reported as African American or Black, compared to the Maryland average of 13%. A lower African American share than is typical in Maryland; local markets still vary widely. |
1% Other Ethnicity Residents — State Benchmarked 1% of residents fall into categories other than White or African American (combined), compared to the Maryland average of 6%. This column aggregates Hispanic, Asian, multiracial, and any other labeled groups that are not classified as White or African American. Reported subgroups in this total: Asian (1%). |
3% Residents Age 65–74 — State Benchmarked 3% of residents are 65–74, compared to the Maryland average of 13%. Fewer younger seniors suggests the resident population skews older, likely requiring higher acuity care and more hands-on support. |
30% Residents Age 75–84 — State Benchmarked 30% of residents are 75–84, compared to the Maryland average of 31%. This is the second most common age bracket in assisted living, representing residents with moderate care needs. |
48% Residents Age 85–94 — State Benchmarked 48% of residents are 85–94, compared to the Maryland average of 44%. This is typically the most common age bracket in assisted living — this facility is in line with the statewide norm. |
18% Residents Age 95+ — State Benchmarked 18% of residents are 95 or older, compared to the Maryland average of 16%. In line with the statewide profile for the oldest resident bracket. |
| Caritas House Assisted Living | AL NH HOS PC | Baltimore (Violetville) | 60
Facility
60
MD AVG
43
Rank
#209 / 697 | No |
50
Facility
50
MD AVG
43
Rank
#419 / 985 | Studio | 23
Facility
23
MD AVG
21
Rank
#100 / 208 | A |
31% Male Residents — State Benchmarked 31% of residents are male, compared to the Maryland average of 31%. This facility caters to a majority female resident pool (69% female), consistent with the broader assisted living trend where women significantly outnumber men. |
69% Female Residents — State Benchmarked 69% of residents are female, compared to the Maryland average of 69%. Women comprise the large majority, consistent with national assisted living demographics where women live longer and enter care facilities at higher rates. |
93% White Residents — State Benchmarked 93% of residents are reported as White, compared to the Maryland average of 81%. A higher White share than is typical for assisted living in Maryland in this dataset — compare with peer facilities for local context. |
5% African American Residents — State Benchmarked 5% of residents are reported as African American or Black, compared to the Maryland average of 13%. In line with the Maryland average for African American residents among facilities reporting this breakdown. |
2% Other Ethnicity Residents — State Benchmarked 2% of residents fall into categories other than White or African American (combined), compared to the Maryland average of 6%. This column aggregates Hispanic, Asian, multiracial, and any other labeled groups that are not classified as White or African American. Reported subgroups in this total: Hispanic (2%). |
12% Residents Age 65–74 — State Benchmarked 12% of residents are 65–74, compared to the Maryland average of 13%. In line with the statewide profile for this youngest senior bracket in assisted living. |
38% Residents Age 75–84 — State Benchmarked 38% of residents are 75–84, compared to the Maryland average of 31%. A high concentration in this mid-range bracket, where residents typically need moderate support with daily activities. |
41% Residents Age 85–94 — State Benchmarked 41% of residents are 85–94, compared to the Maryland average of 44%. This is typically the most common age bracket in assisted living — this facility is in line with the statewide norm. |
9% Residents Age 95+ — State Benchmarked 9% of residents are 95 or older, compared to the Maryland average of 16%. Most residents here have not yet reached the oldest-old bracket, suggesting a younger overall community. |
| Gray Manor Assisted Living, LLC III | AL | Baltimore (Dolfield) | 5
Facility
5
MD AVG
43
Rank
#436 / 697 | No |
75
Facility
75
MD AVG
43
Rank
#131 / 985 | Private / Shared Rooms | - | - |
0% Male Residents — State Benchmarked 0% of residents are male, compared to the Maryland average of 31%. This facility caters to a majority female resident pool (100% female), consistent with the broader assisted living trend where women significantly outnumber men. |
0% Female Residents — State Benchmarked 0% of residents are female, compared to the Maryland average of 69%. An unusually low female share — most assisted living facilities have 65–75% female residents. | - | - | - | - | - | - | - |
Financial Assistance for
Assisted Living in Maryland
Gray Manor Assisted Living, LLC III is located in Baltimore, Maryland.
Here are the financial assistance programs available to residents in Maryland.
Frequently Asked Questions about Gray Manor Assisted Living, LLC III
What neighborhood is Gray Manor Assisted Living, LLC III in?
Gray Manor Assisted Living, LLC III is in the Dolfield neighborhood of MD 21215.
Is Gray Manor Assisted Living, LLC III in a walkable area?
Gray Manor Assisted Living, LLC III has a walk score of 75. Very walkable. Most errands can be accomplished on foot, and many essentials are within a short walk.
How many beds does Gray Manor Assisted Living, LLC III have?
Gray Manor Assisted Living, LLC III has 5 beds.
Has Gray Manor Assisted Living, LLC III had any recent citations?
Gray Manor Assisted Living, LLC III has had 7 recently reported citations.
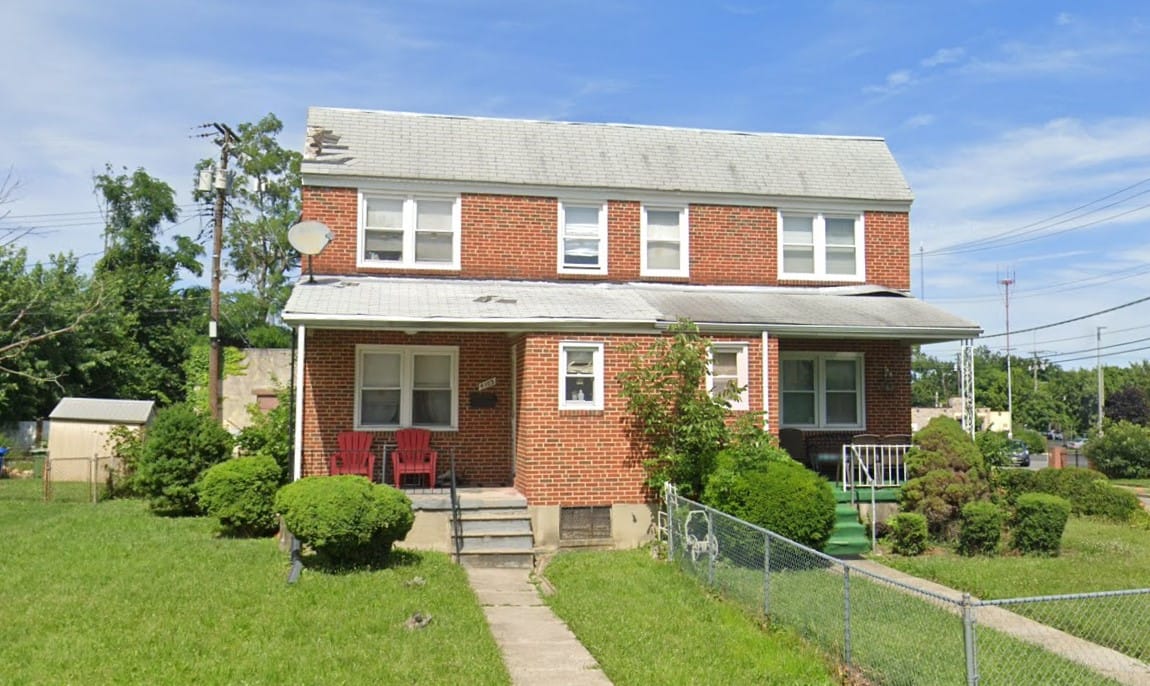
Are there photos of Gray Manor Assisted Living, LLC III?
Yes — there is 1 photo of Gray Manor Assisted Living, LLC III in the photo gallery on this page.
What is the address of Gray Manor Assisted Living, LLC III?
Gray Manor Assisted Living, LLC III is located at 4103 Callaway Ave, Baltimore, MD 21215.
What is the phone number of Gray Manor Assisted Living, LLC III?
(410) 466-9859 will put you in contact with the team at Gray Manor Assisted Living, LLC III.
Guides for Better Senior Living
Care Cost Calculator: See Prices in Your Area
Assisted Living Explorer
Don’t Wait Too Long: 7 Red Flag Signs Your Parent Needs Assisted Living Now
The True Cost of Assisted Living in 2025 – And How Families Are Paying For It
Understanding Senior Living Costs: Pricing Models, Discounts & Financial Assistance
Updated on
