Brightview Towson
Assisted Living & Memory Care · Towson, MD

Brightview Towson

Assisted Living & Memory Care · Towson, MD

Overview of Brightview Towson

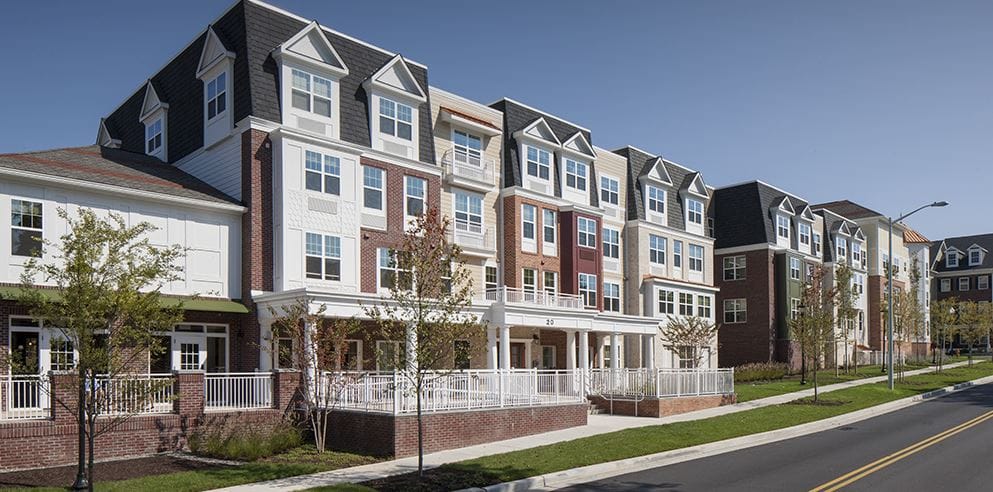
Led by Community Executive Director Katie A., Brightview Towson is an assisted living community in Towson, Maryland, that offers personal care, memory care, and respite care. Serving older adults for 14 years, the community offers studio, one-bedroom, and two-bedroom apartments with kitchenettes and accessible bathrooms. Located near the city center in a highly walkable neighborhood, the community also provides convenient access to shopping, dining, banking, and other everyday services.

A personalized care plan is developed with a dedicated Health Services Director, while licensed nurses and certified nursing assistants provide around-the-clock support. Furthermore, secure memory care spaces and the Bright Minds Program are available to encourage cognitive, social, and emotional well-being for individuals at different stages of memory loss.

Freshly prepared meals are also tailored to individual preferences and dietary requirements, and resort-style amenities promote an active lifestyle. For seven consecutive years, the community has also been recognized by FORTUNE Magazine as a Best Workplace in Aging Services.

By The Numbers

Community insights.

Bed count Info A larger shared setting that may offer more common spaces and organized community services. 100 Rank #108 / 684Bed count — State benchmarkedThis home is ranked 108th out of 684 homes we track in Maryland for bed count. Shows this facility's certified or reported bed count compared to other Maryland facilities. Larger communities may offer more amenities, programs, and on-site services for residents and families.Communities with the same value for a metric share the same rank. Rankings cover every community we track in Maryland that reports data for that category. Communities without available data are excluded, so the pool size varies from metric to metric.Click the rank badge to see the full State ranking.Click here to see the full State ranking.

Medium-capacity home · Offers a balance of services and community atmosphere.

Years of operating Info A community with a solid operating history and experience delivering ongoing care. Rank #140 / 210Years in operation — State benchmarkedThis home is ranked 140th out of 210 homes we track in Maryland for years in operation. Shows how long this facility has been in operation compared to other Maryland facilities. Longer operating histories may benefit residents, families, and staff.Communities with the same value for a metric share the same rank. Rankings cover every community we track in Maryland that reports data for that category. Communities without available data are excluded, so the pool size varies from metric to metric.Click the rank badge to see the full State ranking.Click here to see the full State ranking.
14 years
Walk Score Info Walker's paradise. Daily errands do not require a car, with many shops and services nearby. Rank #17 / 953Walk Score — State benchmarkedThis home is ranked 17th out of 953 homes we track in Maryland for walk score. Shows how walkable this facility's neighborhood is compared to the average walk score across Maryland facilities. Higher scores benefit residents, families, and staff.Communities with the same value for a metric share the same rank. Rankings cover every community we track in Maryland that reports data for that category. Communities without available data are excluded, so the pool size varies from metric to metric.Click the rank badge to see the full State ranking.Click here to see the full State ranking.
92 / 100

About this community

Awards

Best Workplace in Aging Services
Ranked by FORTUNE Magazine for seven consecutive years (2019 - 2025)

License Details

Facility TypeAssisted Living
CountyBaltimore

Room costs

Private Room $250 - $350 per day
Semi-Private Room $200 - $225 per day

Safety & Compliance

Safety FeaturesSafety and security with enhanced infection control measures

Hospice Affiliations

Gilchrist Hospice Care
Stella Maris

Therapy & Rehabilitation

1 service
Respite Care

Staffing & Medical

1 service
Licensed Nurses/CNAs

Memory & Specialized Care

4 services
Dedicated Alzheimer's Unit
Mild Alzheimer's Level
Moderate Alzheimer's Level
Severe Alzheimer's Level

Additional Services

1 service
Enhanced Care

Amenities & Lifestyle

Resort-Style Service And Amenities
Activities
Branded ProgramsBright Minds Program

Contact Brightview Towson

Demographics

Resident demographic information for this facility.

Gender

  • Female 72.2%
  • Male 27.9%

What does this home offer?

Pets allowed icon
Pets allowed icon

Pets Allowed

Housing options icon

Housing Options: Studio / 1 Bed / 2 Bed

Building type icon
Building type icon

Building Type: Mid-rise

Transportation services icon

Transportation Services

Fitness and recreation icon

Fitness and Recreation

Managed by Katie A

Community Executive Director

Over 10 years of experience

Katie A. is the Community Executive Director at Brightview Towson. She joined Brightview over 10 years ago, starting as a concierge and progressing through several community director roles. Katie now leads the community with extensive experience and a deep understanding of senior living operations.

Places of interest near Brightview Towson

Address 0.3 miles from city center Info Estimated distance in miles from Towson's city center to Brightview Towson's address, calculated via Google Maps.

Calculate Travel Distance to Brightview Towson

Add your location

Address

Compare Assisted Living around Baltimore

Info below is compiled from the MD Dept. of Health (OHCQ), senior community websites & trusted data sources such as Walk Score & BBB.

Communities are listed from highest to lowest based on our ranking methodology.

Care Types in This Table AL (Assisted Living): Housing with help for daily activities like bathing, dressing, and medication, without 24-hour skilled nursing. MC (Memory Care): Secured, specialized care for people living with Alzheimer's or dementia. RC (Respite Care): Short-term temporary care that gives family caregivers a break. IL (Independent Living): Community living with dining, activities, and transportation for active seniors who need little personal care. HOS (Hospice Care): Comfort-focused care for those with a terminal illness, prioritizing quality of life over treatment. PC (Palliative Care): Comfort-focused care for serious illness at any stage, including alongside curative treatment.
City and state of the facility. Used for mapping and state-average comparisons.
Licensed bed capacity (maximum allowed). Not the same as how many beds are currently filled.
Indicates whether residents are allowed to have pets in the facility.
Third-party neighborhood walkability score (0–100). Convenience/context metric, not a healthcare quality measure.
Description of bed or unit types offered (e.g. assisted living, memory care), as reported in state or facility disclosures.
Number of years the company has been in operation.
Better Business Bureau grade for the operating company. Reflects complaint handling and business practices, not clinical care quality.
Percentage of residents reported as male in state demographics, shown as a whole-number percent.
Percentage of residents reported as female in state demographics, shown as a whole-number percent.
Share of residents reported as White in the state-published race/ethnicity breakdown for this facility, shown as a whole-number percent. Parsed from the same source as the profile demographics section.
Share of residents reported as African American or Black in the state breakdown, shown as a whole-number percent. Labels in the raw data are normalized to this bucket for compare.
Combined share of all race/ethnicity groups that are not classified as White or African American (e.g. Hispanic, Asian, multiracial, and other labeled categories), summed to a single whole-number percent.
Share of residents aged 65–74 in reported demographics, as a whole-number percentage of residents.
Share of residents aged 75–84 in reported demographics, as a whole-number percentage of residents.
Share of residents aged 85–94 in reported demographics, as a whole-number percentage of residents.
Share of residents aged 95 or older in reported demographics, as a whole-number percentage of residents.
Morningside House At Satyr Hill
AL
HOS
MC
RC
Parkville (Woodcroft)
125
Facility 125
MD AVG 42
Rank #67 / 684
Yes
72
Facility 72
MD AVG 45
Rank #160 / 953
Private Rooms / Semi-Private Rooms
28
Facility 28
MD AVG 21
Rank #53 / 210
A+
34%

Male Residents — State Benchmarked 34% of residents are male, compared to the Maryland average of 31%. This facility caters to a majority female resident pool (66% female), consistent with the broader assisted living trend where women significantly outnumber men.

66%

Female Residents — State Benchmarked 66% of residents are female, compared to the Maryland average of 69%. Women comprise the large majority, consistent with national assisted living demographics where women live longer and enter care facilities at higher rates.

98%

White Residents — State Benchmarked 98% of residents are reported as White, compared to the Maryland average of 81%. A higher White share than is typical for assisted living in Maryland in this dataset — compare with peer facilities for local context.

2%

African American Residents — State Benchmarked 2% of residents are reported as African American or Black, compared to the Maryland average of 13%. A lower African American share than is typical in Maryland; local markets still vary widely.

0%

Other Ethnicity Residents — State Benchmarked 0% of residents fall into categories other than White or African American (combined), compared to the Maryland average of 6%. This column aggregates Hispanic, Asian, multiracial, and any other labeled groups that are not classified as White or African American.

13%

Residents Age 65–74 — State Benchmarked 13% of residents are 65–74, compared to the Maryland average of 13%. In line with the statewide profile for this youngest senior bracket in assisted living.

40%

Residents Age 75–84 — State Benchmarked 40% of residents are 75–84, compared to the Maryland average of 31%. A high concentration in this mid-range bracket, where residents typically need moderate support with daily activities.

29%

Residents Age 85–94 — State Benchmarked 29% of residents are 85–94, compared to the Maryland average of 44%. The population here skews younger than the statewide norm, which may indicate a more active, lower-acuity community.

16%

Residents Age 95+ — State Benchmarked 16% of residents are 95 or older, compared to the Maryland average of 16%. In line with the statewide profile for the oldest resident bracket.

Morningside House of Friendship
AL
HOS
MC
RC
Hanover
103
Facility 103
MD AVG 42
Rank #102 / 684
Yes
36
Facility 36
MD AVG 45
Rank #563 / 953
Studio / 1 Bed / 2 Bed
33
Facility 33
MD AVG 21
Rank #25 / 210
-
23%

Male Residents — State Benchmarked 23% of residents are male, compared to the Maryland average of 31%. This facility caters to a majority female resident pool (77% female), consistent with the broader assisted living trend where women significantly outnumber men.

77%

Female Residents — State Benchmarked 77% of residents are female, compared to the Maryland average of 69%. Women comprise the large majority, consistent with national assisted living demographics where women live longer and enter care facilities at higher rates.

86%

White Residents — State Benchmarked 86% of residents are reported as White, compared to the Maryland average of 81%. Close to the average for this category among assisted living facilities in Maryland with reported race/ethnicity data.

13%

African American Residents — State Benchmarked 13% of residents are reported as African American or Black, compared to the Maryland average of 13%. In line with the Maryland average for African American residents among facilities reporting this breakdown.

1%

Other Ethnicity Residents — State Benchmarked 1% of residents fall into categories other than White or African American (combined), compared to the Maryland average of 6%. This column aggregates Hispanic, Asian, multiracial, and any other labeled groups that are not classified as White or African American. Reported subgroups in this total: Asian (1%).

8%

Residents Age 65–74 — State Benchmarked 8% of residents are 65–74, compared to the Maryland average of 13%. Fewer younger seniors suggests the resident population skews older, likely requiring higher acuity care and more hands-on support.

35%

Residents Age 75–84 — State Benchmarked 35% of residents are 75–84, compared to the Maryland average of 31%. This is the second most common age bracket in assisted living, representing residents with moderate care needs.

41%

Residents Age 85–94 — State Benchmarked 41% of residents are 85–94, compared to the Maryland average of 44%. This is typically the most common age bracket in assisted living — this facility is in line with the statewide norm.

16%

Residents Age 95+ — State Benchmarked 16% of residents are 95 or older, compared to the Maryland average of 16%. In line with the statewide profile for the oldest resident bracket.

Brightview Towson
AL
MC
Towson (Loch Raven)
100
Facility 100
MD AVG 42
Rank #108 / 684
Yes
92
Facility 92
MD AVG 45
Rank #17 / 953
Studio / 1 Bed / 2 Bed
14
Facility 14
MD AVG 21
Rank #140 / 210
-
28%

Male Residents — State Benchmarked 28% of residents are male, compared to the Maryland average of 31%. This facility caters to a majority female resident pool (72% female), consistent with the broader assisted living trend where women significantly outnumber men.

72%

Female Residents — State Benchmarked 72% of residents are female, compared to the Maryland average of 69%. Women comprise the large majority, consistent with national assisted living demographics where women live longer and enter care facilities at higher rates.

0%

White Residents — State Benchmarked 0% of residents are reported as White, compared to the Maryland average of 81%. A lower White share than the Maryland average — the community may draw a more diverse resident mix relative to other facilities in Maryland.

0%

African American Residents — State Benchmarked 0% of residents are reported as African American or Black, compared to the Maryland average of 13%. A lower African American share than is typical in Maryland; local markets still vary widely.

100%

Other Ethnicity Residents — State Benchmarked 100% of residents fall into categories other than White or African American (combined), compared to the Maryland average of 6%. This column aggregates Hispanic, Asian, multiracial, and any other labeled groups that are not classified as White or African American. Reported subgroups in this total: Other (100%).

----
Brightview Mays Chapel Ridge
AL
IL
MC
Timonium (Dixon Hill)
89
Facility 89
MD AVG 42
Rank #149 / 684
Yes
52
Facility 52
MD AVG 45
Rank #400 / 953
Studio / 1 Bed / 2 Bed
50
Facility 50
MD AVG 21
Rank #1 / 210
A+
13%

Male Residents — State Benchmarked 13% of residents are male, compared to the Maryland average of 31%. This facility caters to a majority female resident pool (87% female), consistent with the broader assisted living trend where women significantly outnumber men.

87%

Female Residents — State Benchmarked 87% of residents are female, compared to the Maryland average of 69%. Women comprise the large majority, consistent with national assisted living demographics where women live longer and enter care facilities at higher rates.

99%

White Residents — State Benchmarked 99% of residents are reported as White, compared to the Maryland average of 81%. A higher White share than is typical for assisted living in Maryland in this dataset — compare with peer facilities for local context.

0%

African American Residents — State Benchmarked 0% of residents are reported as African American or Black, compared to the Maryland average of 13%. A lower African American share than is typical in Maryland; local markets still vary widely.

1%

Other Ethnicity Residents — State Benchmarked 1% of residents fall into categories other than White or African American (combined), compared to the Maryland average of 6%. This column aggregates Hispanic, Asian, multiracial, and any other labeled groups that are not classified as White or African American. Reported subgroups in this total: Asian (1%).

3%

Residents Age 65–74 — State Benchmarked 3% of residents are 65–74, compared to the Maryland average of 13%. Fewer younger seniors suggests the resident population skews older, likely requiring higher acuity care and more hands-on support.

30%

Residents Age 75–84 — State Benchmarked 30% of residents are 75–84, compared to the Maryland average of 31%. This is the second most common age bracket in assisted living, representing residents with moderate care needs.

48%

Residents Age 85–94 — State Benchmarked 48% of residents are 85–94, compared to the Maryland average of 44%. This is typically the most common age bracket in assisted living — this facility is in line with the statewide norm.

18%

Residents Age 95+ — State Benchmarked 18% of residents are 95 or older, compared to the Maryland average of 16%. In line with the statewide profile for the oldest resident bracket.

Caritas House Assisted Living
AL
HOS
PC
Baltimore (Violetville)
60
Facility 60
MD AVG 42
Rank #196 / 684
No
50
Facility 50
MD AVG 45
Rank #417 / 953
Studio
23
Facility 23
MD AVG 21
Rank #101 / 210
A
31%

Male Residents — State Benchmarked 31% of residents are male, compared to the Maryland average of 31%. This facility caters to a majority female resident pool (69% female), consistent with the broader assisted living trend where women significantly outnumber men.

69%

Female Residents — State Benchmarked 69% of residents are female, compared to the Maryland average of 69%. Women comprise the large majority, consistent with national assisted living demographics where women live longer and enter care facilities at higher rates.

93%

White Residents — State Benchmarked 93% of residents are reported as White, compared to the Maryland average of 81%. A higher White share than is typical for assisted living in Maryland in this dataset — compare with peer facilities for local context.

5%

African American Residents — State Benchmarked 5% of residents are reported as African American or Black, compared to the Maryland average of 13%. In line with the Maryland average for African American residents among facilities reporting this breakdown.

2%

Other Ethnicity Residents — State Benchmarked 2% of residents fall into categories other than White or African American (combined), compared to the Maryland average of 6%. This column aggregates Hispanic, Asian, multiracial, and any other labeled groups that are not classified as White or African American. Reported subgroups in this total: Hispanic (2%).

12%

Residents Age 65–74 — State Benchmarked 12% of residents are 65–74, compared to the Maryland average of 13%. In line with the statewide profile for this youngest senior bracket in assisted living.

38%

Residents Age 75–84 — State Benchmarked 38% of residents are 75–84, compared to the Maryland average of 31%. A high concentration in this mid-range bracket, where residents typically need moderate support with daily activities.

41%

Residents Age 85–94 — State Benchmarked 41% of residents are 85–94, compared to the Maryland average of 44%. This is typically the most common age bracket in assisted living — this facility is in line with the statewide norm.

9%

Residents Age 95+ — State Benchmarked 9% of residents are 95 or older, compared to the Maryland average of 16%. Most residents here have not yet reached the oldest-old bracket, suggesting a younger overall community.

Financial Assistance for
Assisted Living in Maryland

Brightview Towson is located in Towson, Maryland.
Here are the financial assistance programs available to residents in Maryland.

Get Financial aid guidance

Community Options Waiver

Maryland Medicaid Community Options Waiver

Age 65+ or disabled
General Maryland resident, Medicaid- eligible, nursing home-level care need.
Income Limits (2025) ~$2,829/month 300% FBR, individual
Asset Limits $2,000 (individual), $3,000 (couple) (excludes home, car).
MD

High urban demand; rural outreach efforts.

Benefits
Personal care (5-7 hours/day, e.g., bathing, dressing) Respite care (up to 240 hours/year) Adult day care ($70/day) Home modifications ($1,500 avg.)

Senior Care Program

Maryland Senior Care

Age 65+
General Maryland resident, at risk of nursing home placement.
Income Limits ~$2,000/month individual, varies by county
Asset Limits $11,000 individual
MD

Limited funding; waitlists common in high-demand areas.

Benefits
In-home care (3-5 hours/week) Respite care (up to 10 days/year) Meals (~$6/meal) Transportation (~5 trips/month) Case management

Maryland Nursing Home Medicaid

Maryland Medical Assistance (Medicaid) Nursing Home Program

Age 65+
General Maryland resident, Medicaid-eligible, requires nursing home-level care.
Income Limits (2025) $943/month (individual); most income applied to care costs.
Asset Limits $2,500 (individual), $3,000 (couple); spousal protections up to $155,356.
MD

Home equity limit $636,000; estate recovery applies post-55.

Benefits
24/7 nursing care Meals Therapy Medications (unlimited per medical need)

Senior Assisted Living Subsidy Program

Maryland Senior Assisted Living Group Home Subsidy

Age 62+
General Maryland resident, in or moving to approved assisted living, low/moderate income.
Income Limits (2025) ~$34,000/year individual, varies by county
Asset Limits Not strict; prioritizes low-income.
MD

Not available statewide; facility must be licensed by MDH.

Benefits
Personal care Meals 24-hour supervision (up to $1,500/month subsidy typical)

Veterans Aid and Attendance (A&A) Benefit

Maryland VA Aid and Attendance

Age
General Wartime veteran/spouse, age 65+ or disabled, needs ADL help, Maryland resident.
Income Limits (2025) Net income minus medical expenses < $1,984/month individual with A&A
Asset Limits $155,356 net worth limit
MD

High veteran population in suburban/rural areas.

Benefits
Cash benefit ($1,478-$2,471/month, varies by status) for care costs

Senior Prescription Drug Assistance Program (SPDAP)

Maryland Senior Prescription Drug Assistance Program

Age 65+
General Maryland resident (6+ months), Medicare Part D enrolled.
Income Limits (2025) $48,560/year individual, 300% FPL
Asset Limits None specified.
MD

Supplements Medicare Part D; annual enrollment required.

Benefits
Up to $40/month premium subsidy Reducing drug costs

Medicare Savings Programs (MSP)

Maryland Medicare Savings Programs

Age 65+
General Maryland resident, Medicare Part A/B enrollee.
Income Limits (2025) $2,014/month (QMB), $2,706/month (SLMB/QI, individual).
Asset Limits $9,090 (individual), $13,630 (couple).
MD

Includes QMB, SLMB, QI categories.

Benefits
Covers premiums (up to $174.70/month Part B) Co-pays Deductibles

Community Personal Assistance Services (CPAS)

Maryland Medicaid Community Personal Assistance Services

Age 65+
General Maryland resident, Medicaid-eligible, needs ADL assistance.
Income Limits (2025) $943/month (individual); spend-down available.
Asset Limits $2,500 (individual), $3,000 (couple).
MD

Consumer-directed option allows hiring family caregivers.

Benefits
Personal care (hours vary, typically 20-30/week) Chores Nurse supervision

Frequently Asked Questions about Brightview Towson

What neighborhood is Brightview Towson in?

Brightview Towson is in the Loch Raven neighborhood of Towson.

Is Brightview Towson in a walkable area?

Brightview Towson has a walk score of 92. Walker's paradise. Daily errands do not require a car, with many shops and services nearby.

How long has Brightview Towson been in business?

Brightview Towson has been operating for approximately 14 years, based on available licensing and registration records.

Are pets allowed at Brightview Towson?

Yes, Brightview Towson allows residents to bring their pets.

How many beds does Brightview Towson have?

Brightview Towson has 100 beds.

Are there photos of Brightview Towson?

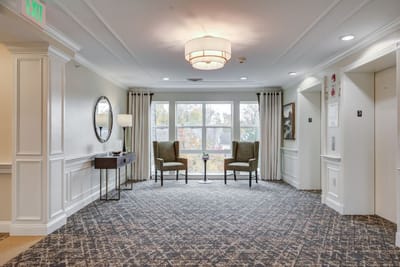
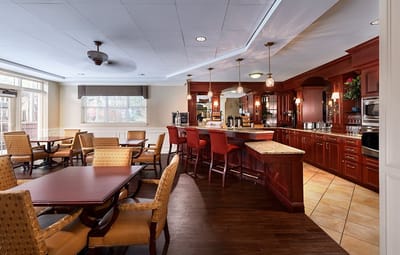
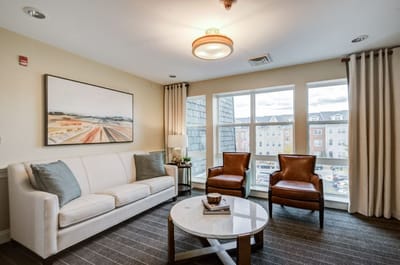
Yes — there are 4 photos of Brightview Towson in the photo gallery on this page.

What is the address of Brightview Towson?

Brightview Towson is located at 20 Burke Ave East, Towson, MD 21286.

Guides for Better Senior Living

Care Cost Calculator: See Prices in Your Area

Assisted Living Explorer

Don’t Wait Too Long: 7 Red Flag Signs Your Parent Needs Assisted Living Now

The True Cost of Assisted Living in 2025 – And How Families Are Paying For It

Understanding Senior Living Costs: Pricing Models, Discounts & Financial Assistance