


Total staff
153
Employees
129
Contractors
24
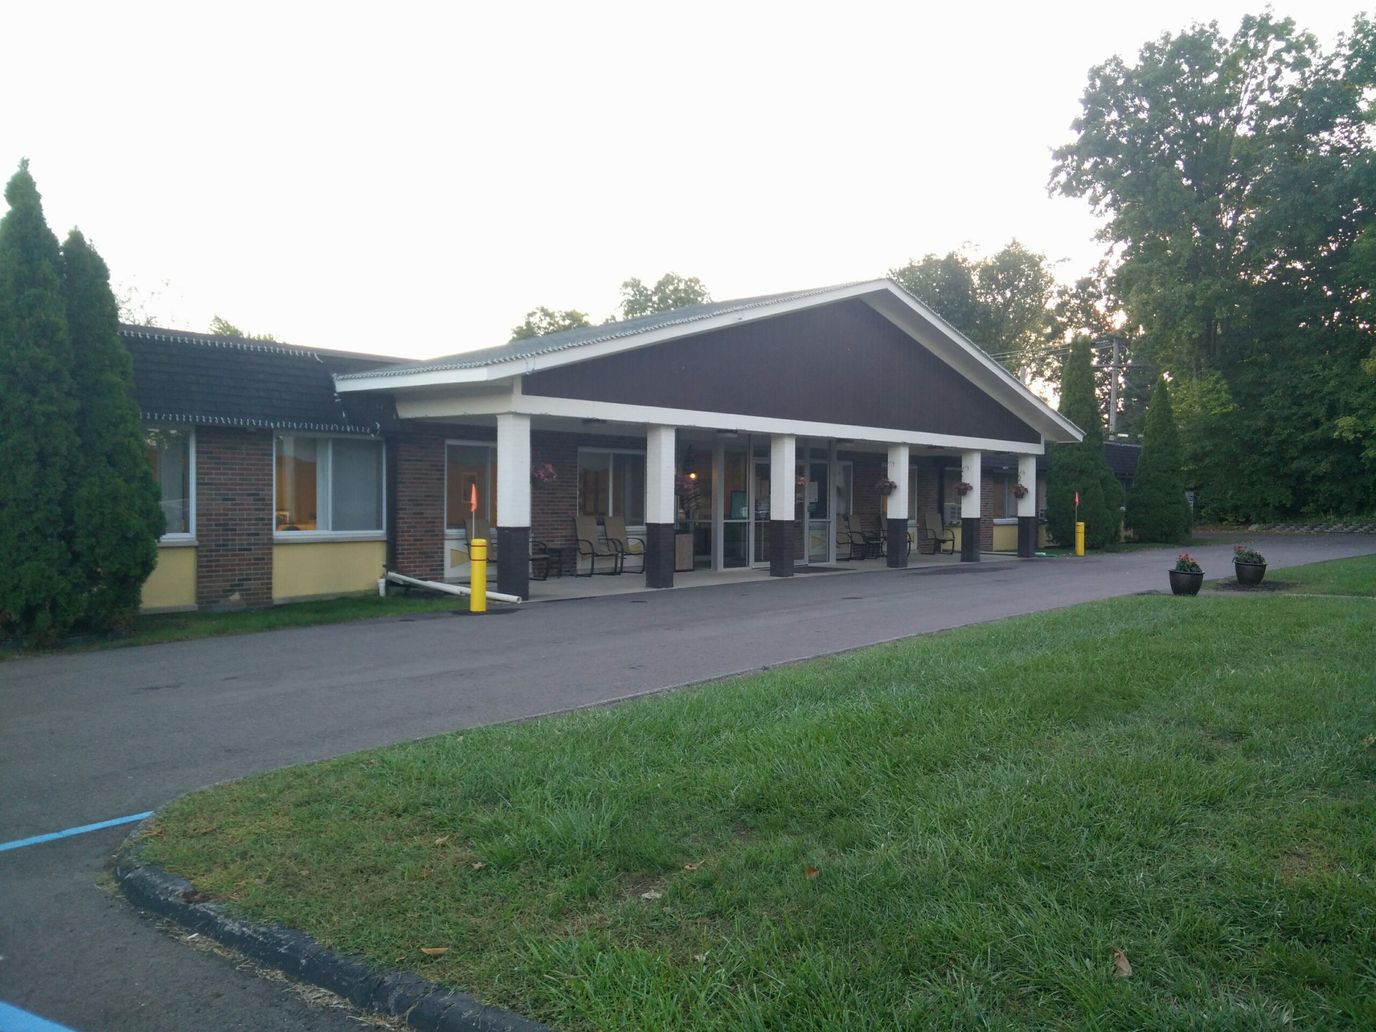
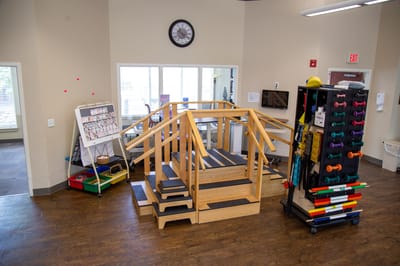
Maintain your independence and full potential in Four Chaplains Nursing Care Center, a reliable community in Westland, MI, offering short-term rehabilitation and long-term care. Their team of compassionate caregivers is available 24/7 to support residents with their daily tasks and oversee their tailored care plans. With access to physical, speech, and occupational therapy services, residents have the tools they need to maintain their functional independence or recover their skills and strength.
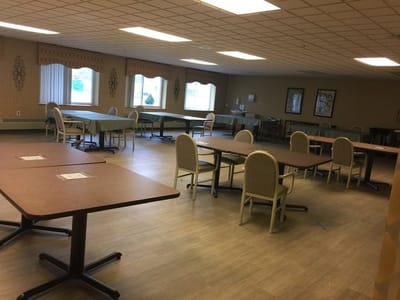
Residents will never run out of fun and enriching things to do with fun and engaging activities curated based on their abilities and interests. The community also provides residents access to restaurant-style dining with fresh and healthy meals that cater to special diets and preferences. From comprehensive care to fun recreational opportunities and thoughtful amenities, Four Chaplains Nursing Care Center provides all the comforts and conveniences residents need to thrive.
| Staff type | Hours / Day / Resident | vs state avg |
|---|---|---|
|
Registered Nurse (RN)
| 38m per day | ▼ 18% State avg: 46m per day · National avg: 41m per day |
|
LPN / LVN
| 46m per day | ▼ 14% State avg: 53m per day · National avg: 52m per day |
|
Nurse Aide
| 2h 12m per day | ▼ 7% State avg: 2h 23m per day · National avg: 2h 21m per day |
|
Weekend Total Nursing
| 3h 18m per day | ▼ 6% State avg: 3h 31m per day · National avg: 3h 26m per day |
|
Physical Therapist
| 4m per day | ▲ 12% State avg: 4m per day · National avg: 4m per day |
|
Weekend RN
| 27m per day | ▼ 8% State avg: 29m per day · National avg: 29m per day |
Reporting period: October 1 – December 31, 2025 (Q4 2025). Source: CMS Payroll-Based Journal report.
Manages medical care and health needs.
Assists with medical care and medications.
Helps with daily care and mobility.
Total hours from contractors
2,865 contractor hours this quarter
| Certified Nursing Assistant | 73 | 0 | 73 | 18,136 | 92 | 100% | 6.5 |
| Licensed Practical Nurse | 25 | 0 | 25 | 6,254 | 92 | 100% | 7.2 |
| Registered Nurse | 15 | 0 | 15 | 4,063 | 92 | 100% | 7.5 |
| Other Dietary Services Staff | 7 | 0 | 7 | 1,360 | 90 | 98% | 7.4 |
| Occupational Therapy Aide | 2 | 0 | 2 | 960 | 63 | 68% | 8 |
| Physical Therapy Assistant | 0 | 6 | 6 | 706 | 71 | 77% | 6.4 |
| Physical Therapy Aide | 0 | 5 | 5 | 622 | 72 | 78% | 7.5 |
| Respiratory Therapy Technician | 0 | 3 | 3 | 612 | 72 | 78% | 6.8 |
| Clinical Nurse Specialist | 3 | 0 | 3 | 612 | 60 | 65% | 7.2 |
| Speech Language Pathologist | 0 | 4 | 4 | 561 | 69 | 75% | 6.9 |
| Administrator | 1 | 0 | 1 | 504 | 63 | 68% | 8 |
| Nurse Practitioner | 1 | 0 | 1 | 495 | 62 | 67% | 8 |
| Dietitian | 1 | 0 | 1 | 472 | 59 | 64% | 8 |
| Qualified Social Worker | 0 | 5 | 5 | 267 | 50 | 54% | 5.3 |
| Mental Health Service Worker | 1 | 0 | 1 | 240 | 30 | 33% | 8 |
| Medical Director | 0 | 1 | 1 | 98 | 55 | 60% | 1.8 |
Includes penalties issued in 2024
Federal penalties imposed by CMS for regulatory violations, including civil money penalties (fines) and denials of payment for new Medicare/Medicaid admissions.
Source: CMS Penalties Database (Data as of Jan 2026)
Michigan average: $76K
Michigan average: 2.0
Michigan average: 0.8
Penalties are imposed by CMS for violations of federal nursing home regulations.
1 penalty in the past 3 years
Jan 9, 2024 · $45K
Last updated: Jan 2026
These measures show how residents usually do over time at this home, based on health outcomes and preventive care.
Michigan average: 8.4
Michigan average: 16.3
Michigan average: 12.5%
Michigan average: 15.3%
Michigan average: 21.0%
Michigan average: 3.2%
Michigan average: 5.7%
Michigan average: 1.7%
Michigan average: 5.7%
Michigan average: 3.9%
Michigan average: 15.0%
Michigan average: 94.9%
Michigan average: 95.0%
Michigan average: 1.74
Michigan average: 1.54
Michigan average: 82.5%
Michigan average: 1.4%
Michigan average: 79.5%
Michigan average: 24.2%
Michigan average: 11.5%
Michigan average: 0.8%
Michigan average: 53.7%
Michigan average: 50.6%
Quality measures are calculated from Minimum Data Set (MDS) assessments. For most measures, lower percentages indicate better care quality.
25% of new residents, usually for short-term rehab.
49% of new residents, often for short stays.
26% of new residents, often for long-term daily care.
Source: CMS Long-Term Care Facility Characteristics (Data as of Jan 2026)
Residents meet regularly to discuss policies, care quality, and activities
Organized group of residents that meets regularly to discuss facility policies, quality of life, and activities.
Data sourced from CMS Long-Term Care Facility Characteristics quarterly report. Payer mix reflects the current resident census by primary payment source.
Historical financial and operational data for Four Chaplains Nursing Care Center from 2011–2023, based on CMS SNF Cost Reports.
Key figures below are for fiscal year ending in 12/2023.
Based on CMS SNF Cost Report for fiscal year ending in 12/2023.
No pets allowed
Housing Options: Private Suites
Building Type: Single-story
Beauty Services
Recreational Activities

Health Programs
This home supports both short-term rehab and long-term care, with residents staying for a wide range of durations.
New residents most often arrive under private pay (49% of admissions), and a typical private pay stay runs around 1 months.
Coverage residents most often arrive under.
Coverage residents most often leave under.
![]() 4.5 miles from city center
4.5 miles from city center
![]() Estimated distance in miles from Westland's city center to Four Chaplains Nursing Care Center's address, calculated via Google Maps.
Estimated distance in miles from Westland's city center to Four Chaplains Nursing Care Center's address, calculated via Google Maps.
Add your location
The information below is reported by the Michigan Department of Licensing and Regulatory Affairs (LARA).
| Maple Manor of Wayne | NH SNF | Wayne | 59
Facility
59
MI AVG
74
Rank
#245 / 431 |
61.4%
Facility
61.4%
MI AVG
73.9
Rank
#93 / 126 | -17% | 5.62
Facility
5.62
MI AVG
4.30
Rank
#13 / 140 | -49% | +31% | $0
Facility
$0
MI AVG
$87.6k
Rank
#1 / 143 | 20
Facility
20
MI AVG
33.5
Rank
#40 / 142 | 5.0
Facility
5.0
MI AVG
5.2
Rank
#71 / 142 | - | 36 | - |
40
Facility
40
MI AVG
39
Rank
#320 / 703 | Marcus Evangelista | $4.9MFiscal year ending 12/2023
Facility
$4.9MFiscal year ending 12/2023
MI AVG
$15.8M
Rank
#129 / 141 | $3.3MFiscal year ending 12/2023
Facility
$3.3MFiscal year ending 12/2023
MI AVG
$5.6M
Rank
#133 / 141 | 67.5%Fiscal year ending 12/2023
Facility
67.5%Fiscal year ending 12/2023
MI AVG
39%
Rank
#87 / 141 | 235613 | ||||
| Four Chaplains Nursing Care Center | NH SNF | Westland | 96
Facility
96
MI AVG
74
Rank
#139 / 431 |
93.0%
Facility
93.0%
MI AVG
73.9
Rank
#27 / 126 | +26% | 3.95
Facility
3.95
MI AVG
4.30
Rank
#77 / 140 | -4% | -8% | $45.1k
Facility
$45.1k
MI AVG
$87.6k
Rank
#107 / 143 | 23
Facility
23
MI AVG
33.5
Rank
#55 / 142 | 2.9
Facility
2.9
MI AVG
5.2
Rank
#14 / 142 | 4 | 89 | - |
66
Facility
66
MI AVG
39
Rank
#97 / 703 | Deborah Mallet | $9.4MFiscal year ending 12/2023
Facility
$9.4MFiscal year ending 12/2023
MI AVG
$15.8M
Rank
#87 / 141 | $5.4MFiscal year ending 12/2023
Facility
$5.4MFiscal year ending 12/2023
MI AVG
$5.6M
Rank
#90 / 141 | 58%Fiscal year ending 12/2023
Facility
58%Fiscal year ending 12/2023
MI AVG
39%
Rank
#68 / 141 | 235467 | ||||
| The Orchards at Samaritan | NH HOS MC RC SNF | Wayne County (Conner Creek) | 120
Facility
120
MI AVG
74
Rank
#71 / 431 |
80.5%
Facility
80.5%
MI AVG
73.9
Rank
#64 / 126 | +9% | 3.92
Facility
3.92
MI AVG
4.30
Rank
#77 / 140 | -54% | -9% | $0
Facility
$0
MI AVG
$87.6k
Rank
#1 / 143 | 28
Facility
28
MI AVG
33.5
Rank
#67 / 142 | 4.0
Facility
4.0
MI AVG
5.2
Rank
#42 / 142 | 2 | 97 | - |
32
Facility
32
MI AVG
39
Rank
#417 / 703 | Latresha Davis | $12.6MFiscal year ending 12/2023
Facility
$12.6MFiscal year ending 12/2023
MI AVG
$15.8M
Rank
#98 / 141 | $5.9MFiscal year ending 12/2023
Facility
$5.9MFiscal year ending 12/2023
MI AVG
$5.6M
Rank
#89 / 141 | 46.5%Fiscal year ending 12/2023
Facility
46.5%Fiscal year ending 12/2023
MI AVG
39%
Rank
#51 / 141 | 235632 |
Four Chaplains Nursing Care Center is located in Westland, Michigan.
Here are the financial assistance programs available to residents in Michigan.
Four Chaplains Nursing Care Center has a walk score of 66. Moderately walkable. Some errands can be accomplished on foot, with a mix of nearby amenities.
Four Chaplains Nursing Care Center's occupancy is 83.7%.
Four Chaplains Nursing Care Center is registered as a for-profit in MI.
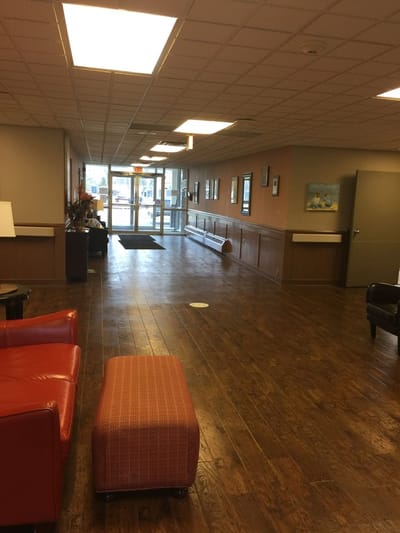
Yes — there are 4 photos of Four Chaplains Nursing Care Center in the photo gallery on this page.
Four Chaplains Nursing Care Center is located at 28349 Joy Road, Westland, MI 48185.
(734) 261-9500 will put you in contact with the team at Four Chaplains Nursing Care Center.
Yes — Four Chaplains Nursing Care Center is a CMS-certified provider of Medicare and Medicaid.
Care Cost Calculator: See Prices in Your Area
Nursing Home Data Explorer
Don’t Wait Too Long: 7 Red Flag Signs Your Parent Needs Assisted Living Now
The True Cost of Assisted Living in 2025 – And How Families Are Paying For It
Understanding Senior Living Costs: Pricing Models, Discounts & Financial Assistance


