

Total health inspections
5
Florida average 4.3
Last Health inspection on Jan 2025

We arrange tours, appointments, and even moving support so you don’t have to
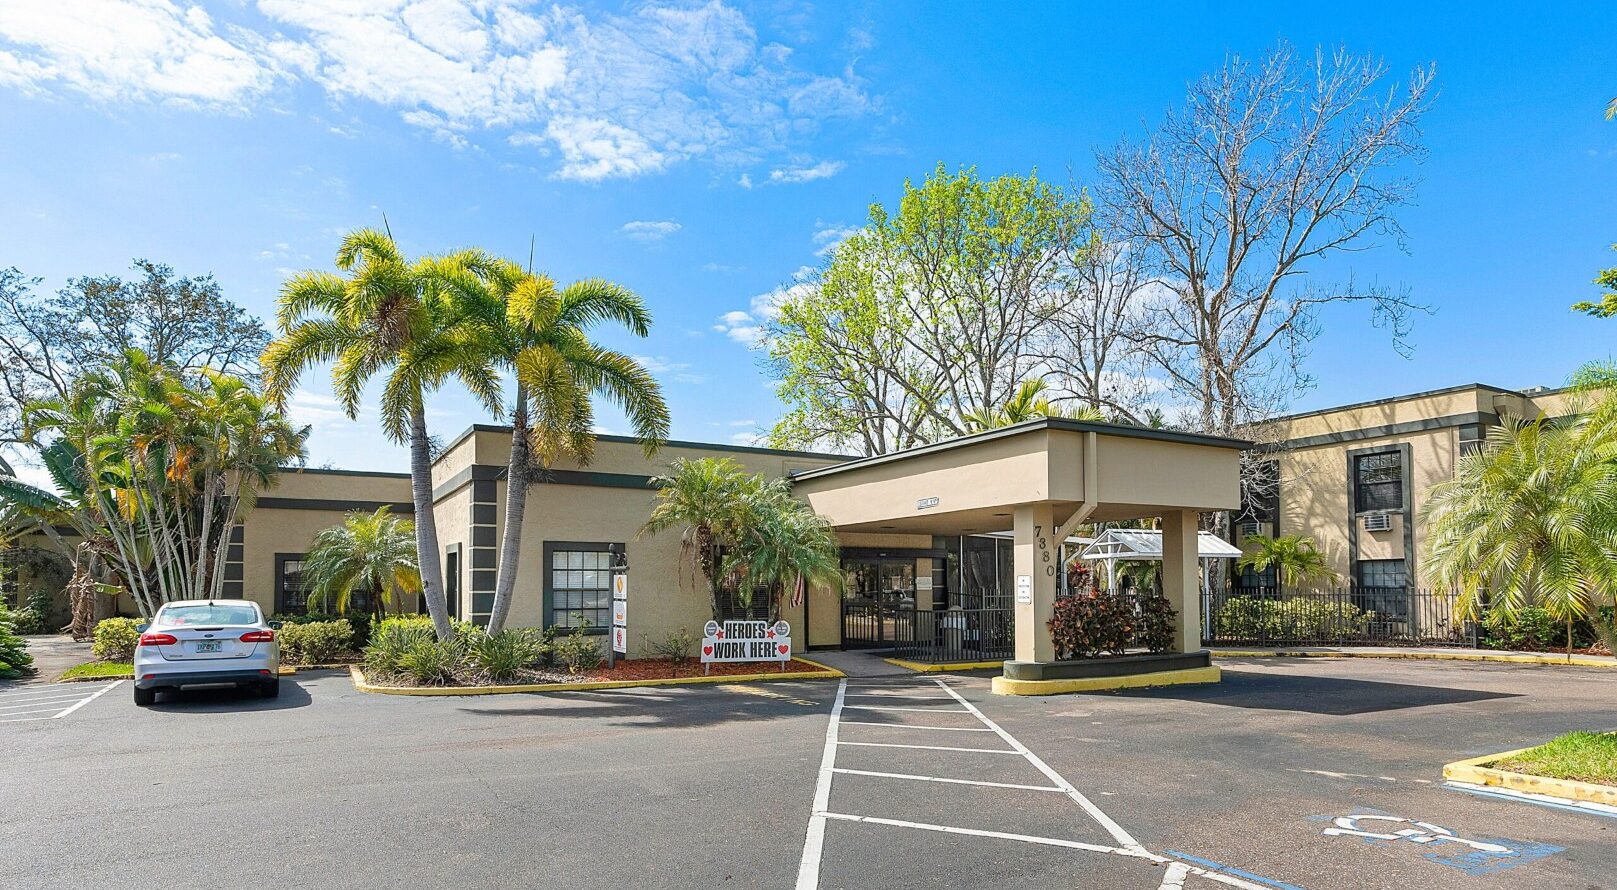
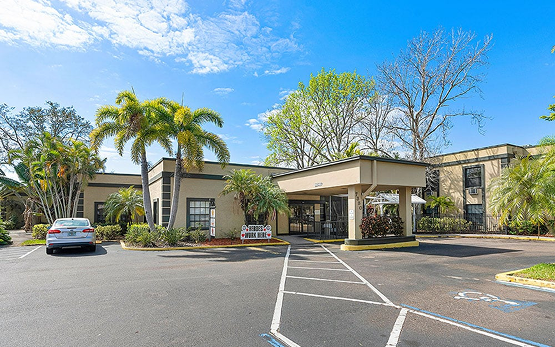
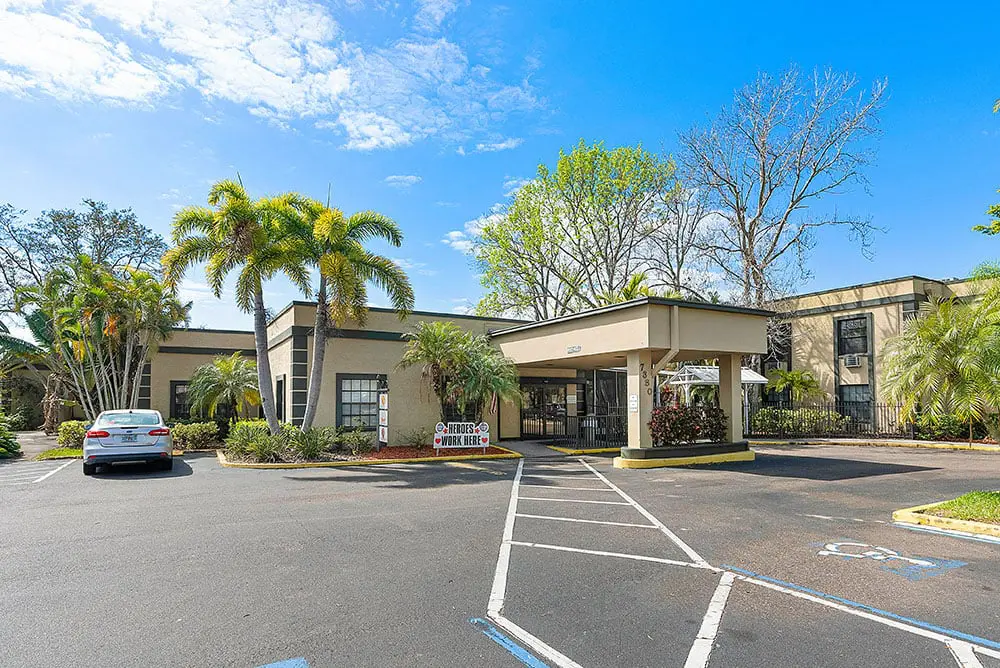
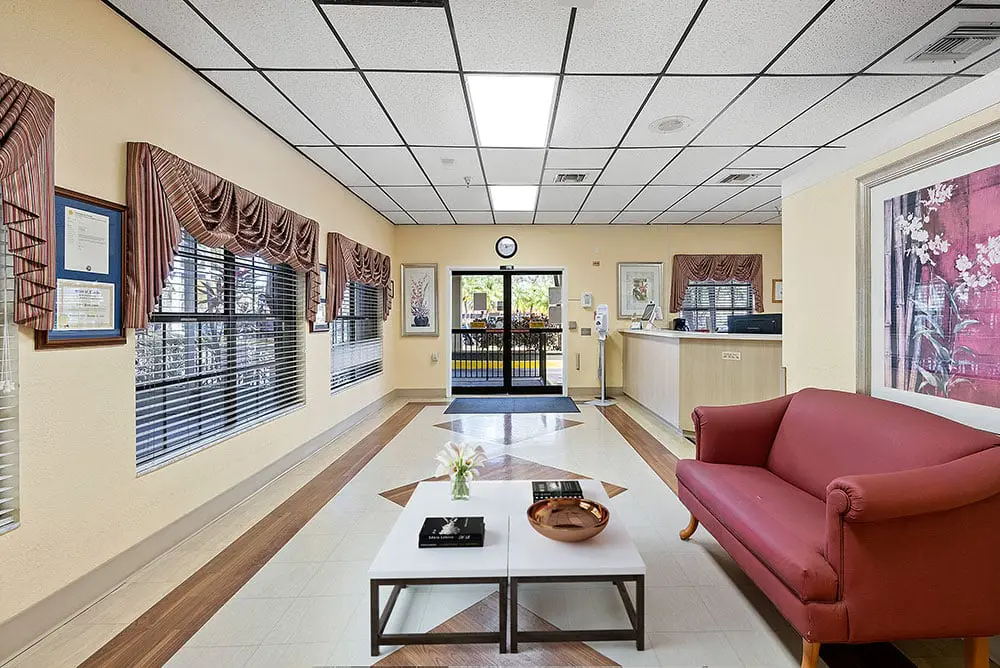

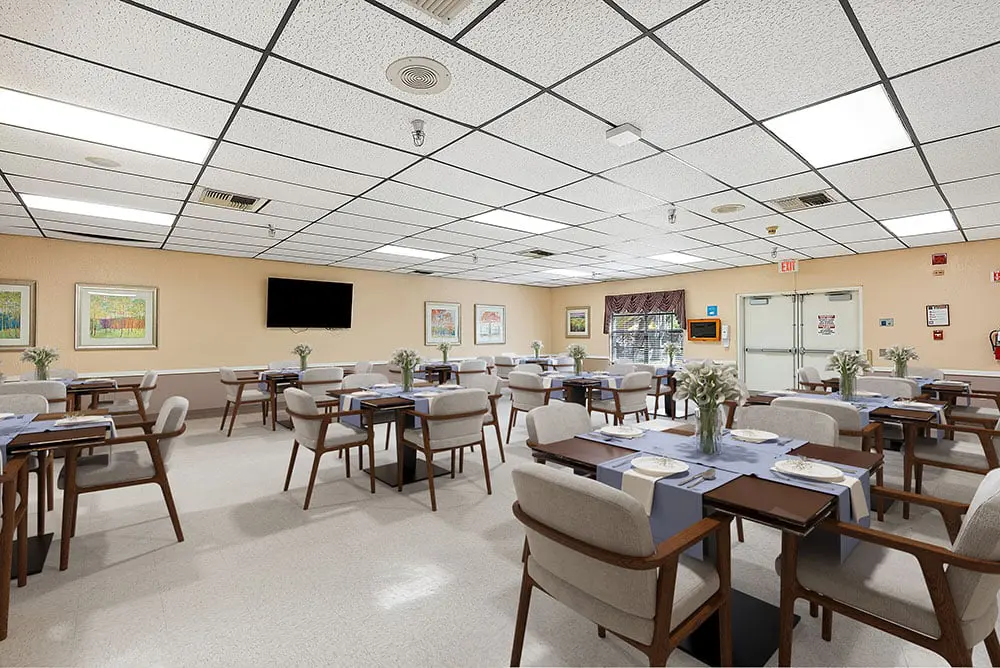


Start your wellness journey with Tierra Pines Center, a trusted community located in the scenic setting of Largo, FL, that offers long-term care, short-term rehabilitation, and specialized care. With top-notch care and assistance provided 24/7, the community strives to meet residents’ special needs to ensure a comfortable lifestyle. Residents can feel at ease with the community’s cozy and welcoming environment.
A jam-packed calendar of fun activities and engaging programs is also conducted for residents to remain socially engaged and active. Prioritizing residents’ health, delightful and nutritious meals are also served to satisfy dietary needs and preferences. The community is dedicated to improving residents’ well-being, providing comprehensive care for the finest retirement experience.
| Staff type | Hours / Day / Resident | vs state avg |
|---|---|---|
|
Registered Nurse (RN)
|
25m per day | ▼ 43% State avg: 44m per day · National avg: 41m per day |
|
LPN / LVN
|
48m per day | ■ Avg State avg: 47m per day · National avg: 52m per day |
|
Nurse Aide
|
2h 2m per day | ▼ 13% State avg: 2h 20m per day · National avg: 2h 21m per day |
|
Weekend Total Nursing
|
3h 4m per day | ▼ 13% State avg: 3h 31m per day · National avg: 3h 26m per day |
|
Physical Therapist
|
7m per day | ▲ 40% State avg: 5m per day · National avg: 4m per day |
|
Weekend RN
|
17m per day | ▼ 47% State avg: 32m per day · National avg: 29m per day |
In Florida, the Agency for Health Care Administration (AHCA) is the primary authority that conducts unannounced inspections and completes official health quality reports for all healthcare facilities.
Limited inspection history. Not enough information to score against the Florida benchmark.
Florida nursing homes benchmark: C+ 77/100
Inspection score not available. Not enough information to score against the Florida benchmark.
Citations
|
This Facility | FL Average | vs. FL Avg |
|---|---|---|---|
|
Total citations
|
26 | 33 | This facility has 21% fewer total citations than a typical Florida nursing home (26 vs. FL avg 33).↓ 21% better |
|
Citations per year
|
5.2 | 6.6 | This facility has 21% fewer citations per year than a typical Florida nursing home (5.2 vs. FL avg 6.6).↓ 21% better |
The most recent inspection on January 30, 2025, found deficiencies related to PASARR screening and care plan incorporation, wound care management, assistance with shaving, and kitchen sanitation monitoring. Earlier inspections showed recurring issues with maintenance of equipment and resident environment, including laundry machines, kitchen cleanliness, damaged wheelchairs, and water damage in resident rooms. Prior reports also cited deficiencies in trauma-informed care, medication administration, infection control, and medication storage. Complaint investigations were not listed in the available reports. The pattern of findings suggests ongoing challenges in both resident care and facility maintenance without a clear trend of improvement or worsening.
Read the full inspection reports for this facility, including detailed findings and corrective actions.
Show Inspection ReportsFlorida average 4.3
Last Health inspection on Jan 2025
Florida average 19.7
Florida average 4.48
Health citations are formal notices following inspections when they fail to comply with safety and care standards.
14 of 20 citations resulted from standard inspections; 4 of 20 resulted from complaint investigations; and 2 of 20 came from combined inspections (standard and complaint).
Florida average: 0.8
Florida average: 0.4
Reporting period: October 1 – December 31, 2025 (Q4 2025). Source: CMS Payroll-Based Journal report.
Manages medical care and health needs.
No contractors work on this role.
Assists with medical care and medications.
No contractors work on this role.
Helps with daily care and mobility.
No contractors work on this role.
Total hours from contractors
680 contractor hours this quarter
| Certified Nursing Assistant | 64 | 0 | 64 | 19,857 | 92 | 100% | 8.4 |
| Licensed Practical Nurse | 28 | 0 | 28 | 7,926 | 92 | 100% | 9.1 |
| Registered Nurse | 13 | 0 | 13 | 3,490 | 92 | 100% | 7.7 |
| Nurse Aide in Training | 8 | 0 | 8 | 1,853 | 91 | 99% | 8 |
| Dietitian | 18 | 0 | 18 | 1,449 | 91 | 99% | 7.6 |
| RN Director of Nursing | 1 | 1 | 2 | 831 | 84 | 91% | 6 |
| Physical Therapy Aide | 4 | 0 | 4 | 818 | 73 | 79% | 6.8 |
| Speech Language Pathologist | 4 | 0 | 4 | 777 | 71 | 77% | 7.1 |
| Respiratory Therapy Technician | 5 | 0 | 5 | 746 | 69 | 75% | 7.6 |
| Dental Services Staff | 1 | 0 | 1 | 525 | 64 | 70% | 8.2 |
| Mental Health Service Worker | 1 | 0 | 1 | 456 | 57 | 62% | 8 |
| Qualified Social Worker | 2 | 0 | 2 | 449 | 63 | 68% | 6.9 |
| Administrator | 1 | 0 | 1 | 448 | 56 | 61% | 8 |
| Nurse Practitioner | 1 | 0 | 1 | 425 | 54 | 59% | 7.9 |
| Clinical Nurse Specialist | 2 | 0 | 2 | 384 | 54 | 59% | 6.5 |
| Physical Therapy Assistant | 3 | 0 | 3 | 345 | 64 | 70% | 5.4 |
| Occupational Therapy Aide | 0 | 1 | 1 | 299 | 40 | 43% | 7.5 |
| Medical Director | 0 | 1 | 1 | 30 | 6 | 7% | 5 |
Includes penalties issued in 2025
Federal penalties imposed by CMS for regulatory violations, including civil money penalties (fines) and denials of payment for new Medicare/Medicaid admissions.
Source: CMS Penalties Database (Data as of Jan 2026)
Florida average: $72K
Florida average: 2.6
Florida average: 0.1
Penalties are imposed by CMS for violations of federal nursing home regulations.
1 penalty in the past 3 years
Jan 30, 2025 · $4K
Last updated: Jan 2026
These measures show how residents usually do over time at this home, based on health outcomes and preventive care.
Florida average: 7.4
Florida average: 12.4
Florida average: 10.5%
Florida average: 12.9%
Florida average: 13.5%
Florida average: 2.6%
Florida average: 5.4%
Florida average: 0.9%
Florida average: 6.0%
Florida average: 3.3%
Florida average: 8.0%
Florida average: 97.7%
Florida average: 99.2%
Florida average: 2.10
Florida average: 1.18
Florida average: 94.0%
Florida average: 1.5%
Florida average: 94.7%
Florida average: 26.2%
Florida average: 9.3%
Florida average: 0.8%
Florida average: 53.7%
Florida average: 50.6%
Quality measures are calculated from Minimum Data Set (MDS) assessments. For most measures, lower percentages indicate better care quality.
30% of new residents, usually for short-term rehab.
35% of new residents, often for short stays.
34% of new residents, often for long-term daily care.
Source: CMS Long-Term Care Facility Characteristics (Data as of Jan 2026)
Residents meet regularly to discuss policies, care quality, and activities
Family members meet regularly to discuss policies, care quality, and activities
Organized group of family members that meets regularly to discuss facility policies, resident care, and activities.
Organized group of residents that meets regularly to discuss facility policies, quality of life, and activities.
Data sourced from CMS Long-Term Care Facility Characteristics quarterly report. Payer mix reflects the current resident census by primary payment source.
Historical financial and operational data for Tierra Pines Center based on CMS SNF Cost Reports.
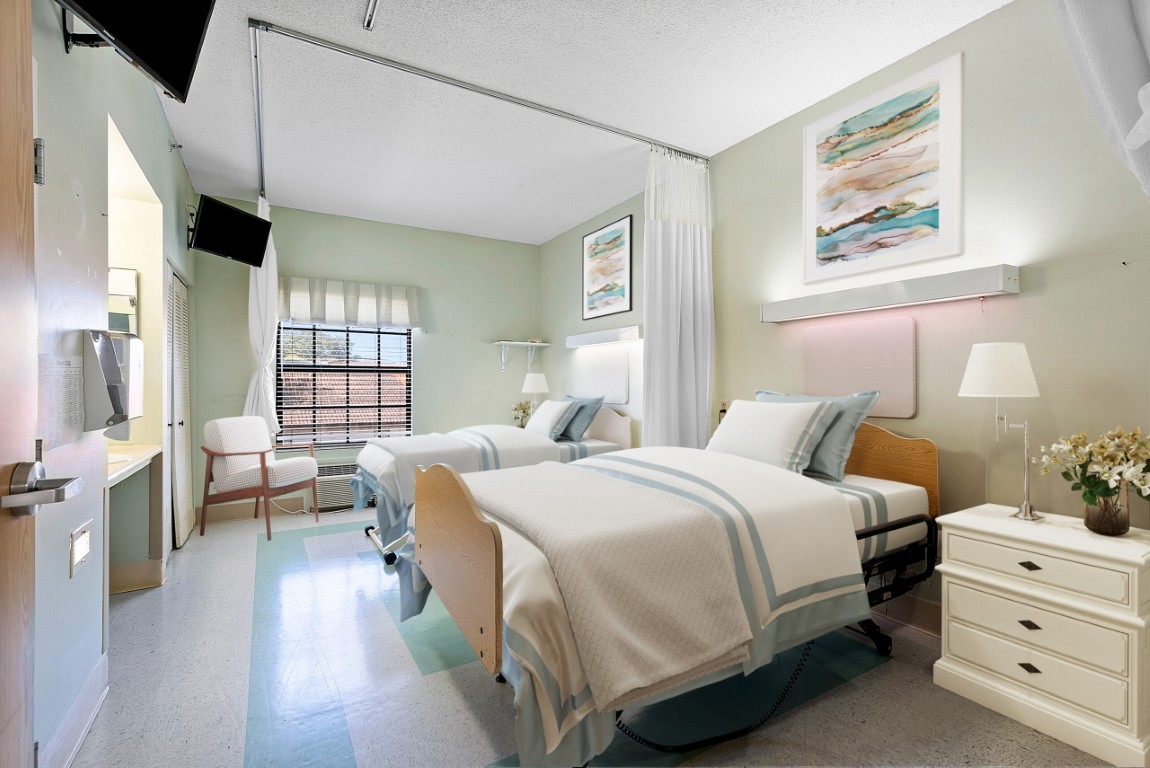
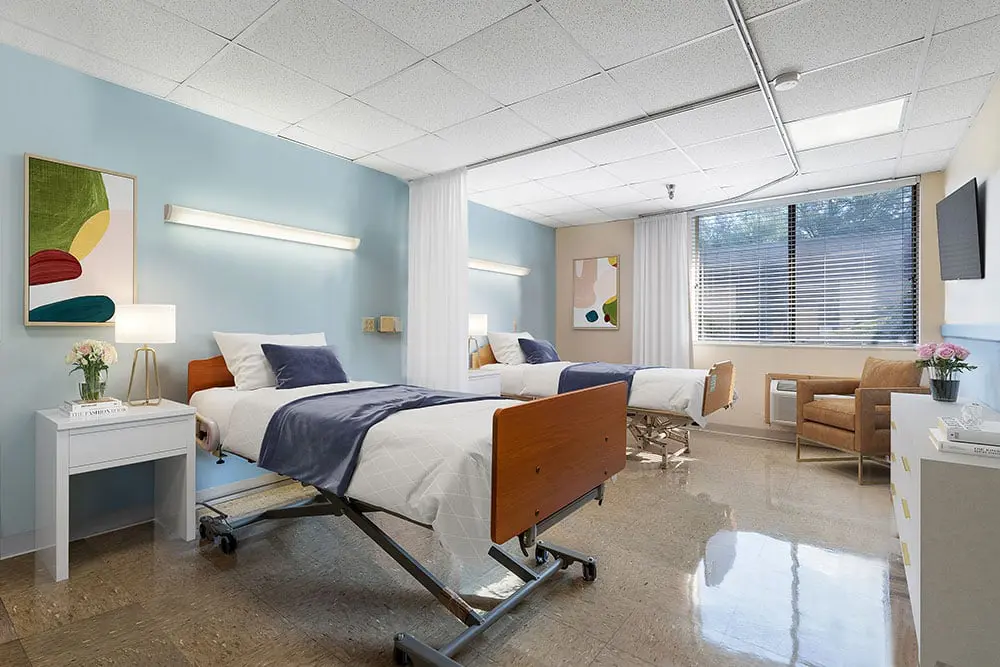
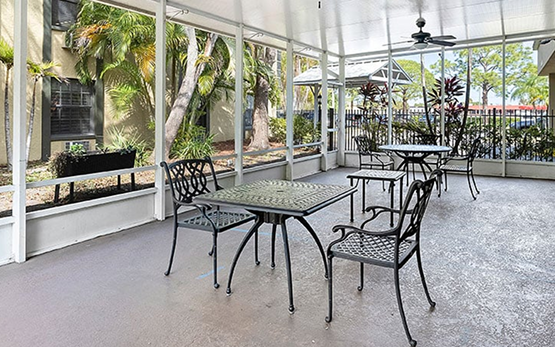
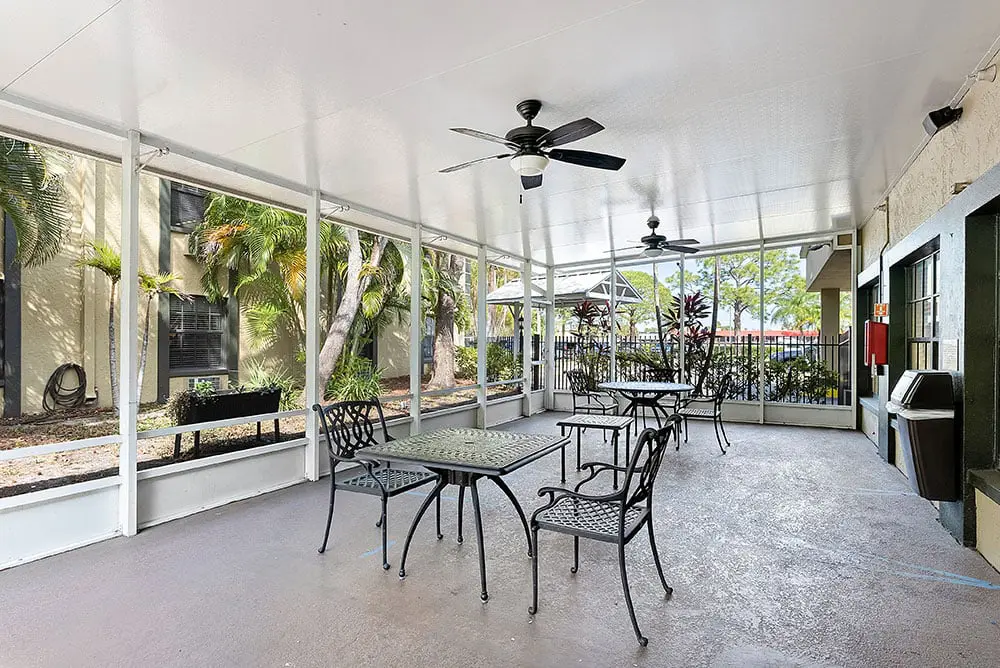
Housing Options: Private / Semi-Private Rooms
Building Type: Single-story
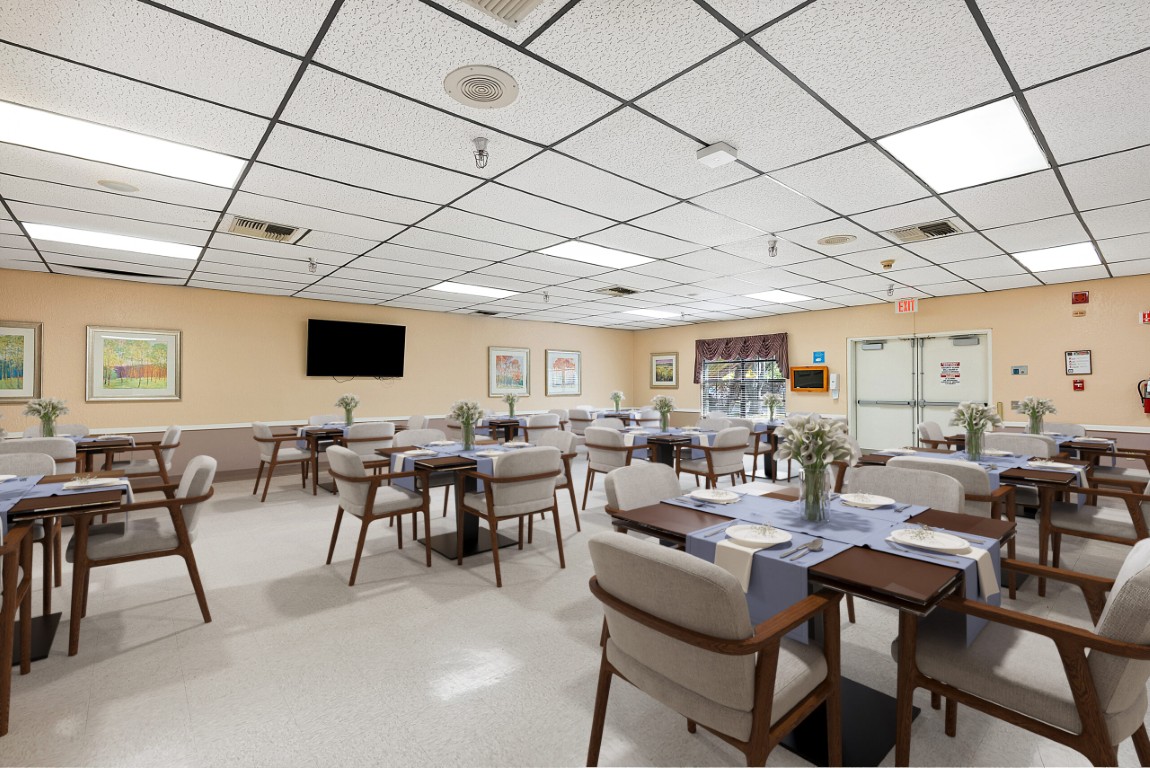
Dining Services
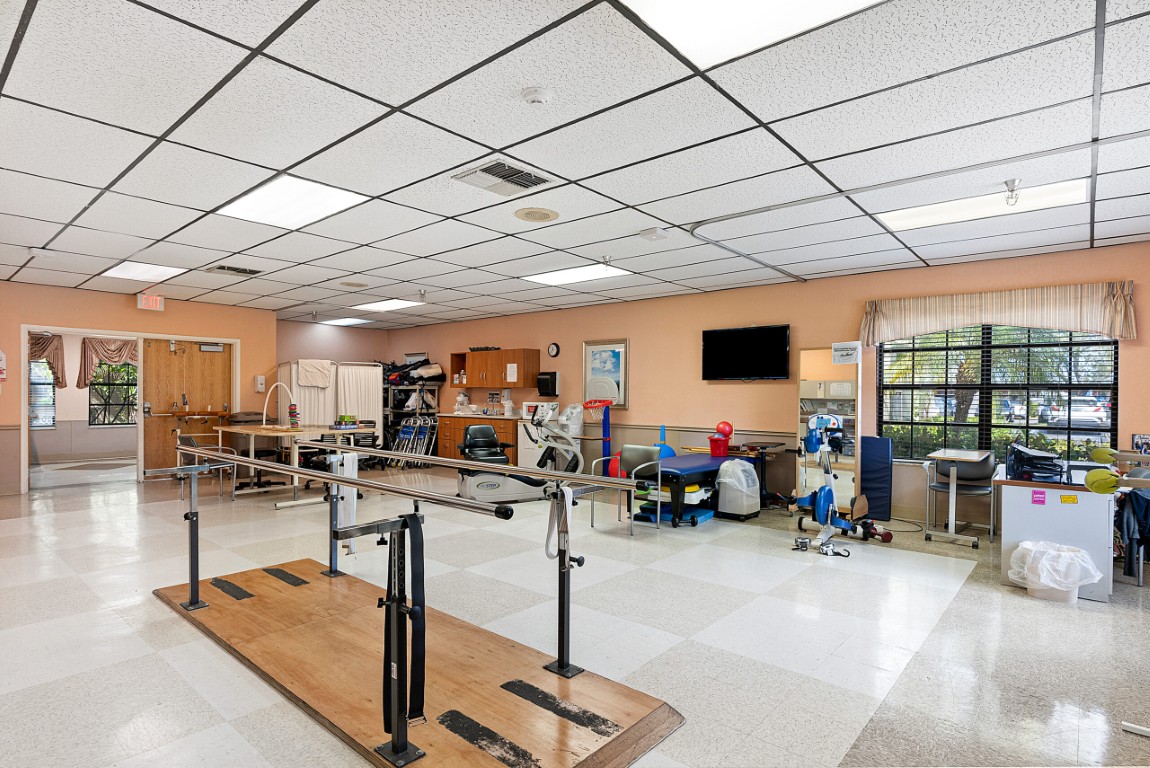
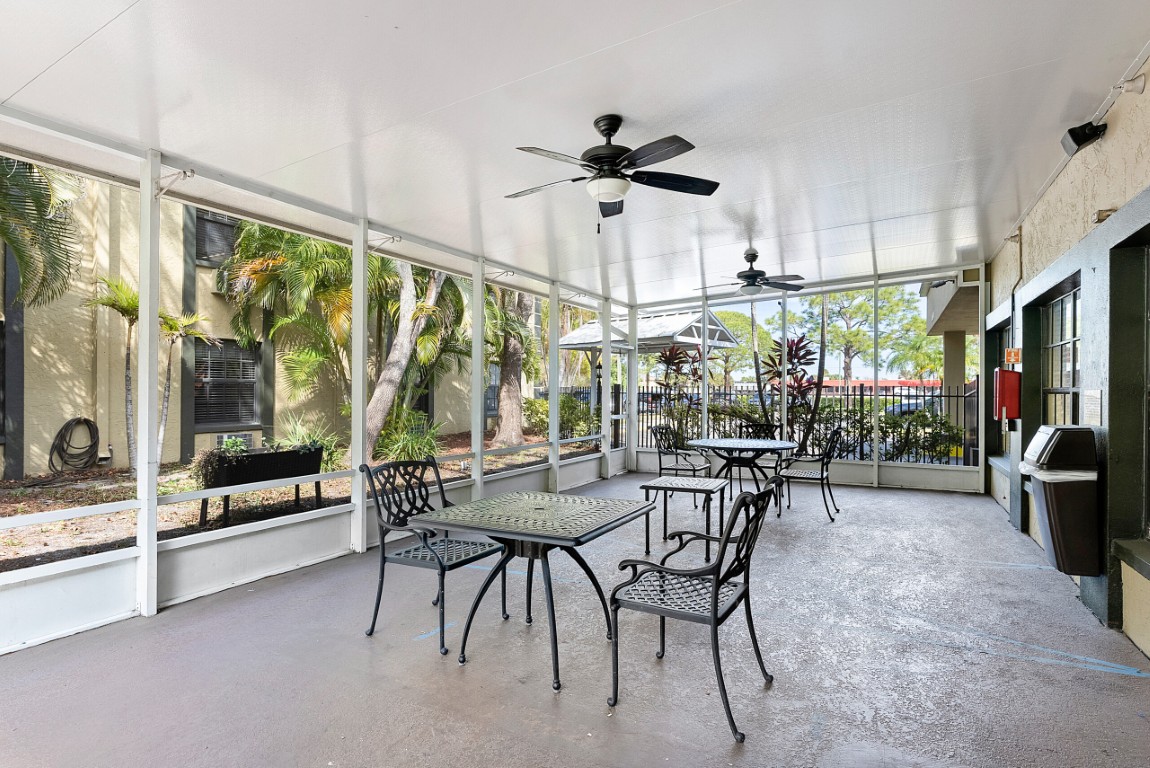
Recreational Activities
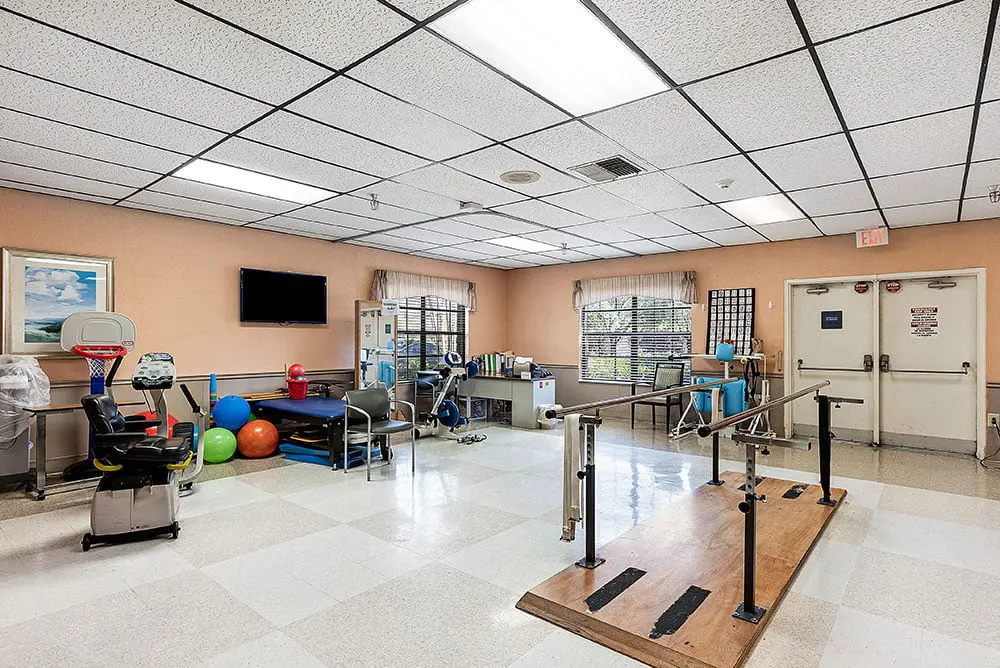
Exercise Programs

Health Programs
This home supports both short-term rehab and long-term care, with residents staying for a wide range of durations.
![]() 4.0 miles from city center
4.0 miles from city center
![]() Estimated distance in miles from Largo's city center to Tierra Pines Center's address, calculated via Google Maps.
Estimated distance in miles from Largo's city center to Tierra Pines Center's address, calculated via Google Maps.
Add your location
Tierra Pines Center is located in Largo, Florida.
Here are the financial assistance programs available to residents in Florida.
The information below is reported by the Florida Agency for Health Care Administration (AHCA).
|
|
|
|
|
|
|
|
|
|
|
|
|
|
|
|
|
|
|
|
|
|
|
|
|
|
|---|---|---|---|---|---|---|---|---|---|---|---|---|---|---|---|---|---|---|---|---|---|---|---|---|
| East Bay Rehabilitation Center |
NH
Nursing Home Licensed facility providing 24/7 skilled nursing care for residents with complex, ongoing medical needs. Staffed by RNs, LPNs, and CNAs. Inspected and star-rated annually by CMS. Accepts Medicare (short-term rehab) and Medicaid (long-term care).
CH
Care Homes |
Clearwater | 120 | 89.3% | +6% | 4.21 | -45% | +4% | $0 | 13 | 3.3 | - | 114 | - | 13 | - | $14.8M | $8.1M | 54.9% | 105697 | ||||
| Gulf Shore Care Center |
NH
Nursing Home Licensed facility providing 24/7 skilled nursing care for residents with complex, ongoing medical needs. Staffed by RNs, LPNs, and CNAs. Inspected and star-rated annually by CMS. Accepts Medicare (short-term rehab) and Medicaid (long-term care). |
Pinellas Park | 120 | 94.2% | +12% | 3.23 | -47% | -20% | $0 | 15 | 5.0 | - | 111 | - | 52 | Gulf Shore Nursing Holdco LLC | $11.6M | $3.1M | 26.7% | 105978 | ||||
| Tierra Pines Center |
NH
Nursing Home Licensed facility providing 24/7 skilled nursing care for residents with complex, ongoing medical needs. Staffed by RNs, LPNs, and CNAs. Inspected and star-rated annually by CMS. Accepts Medicare (short-term rehab) and Medicaid (long-term care). |
Largo (Monterey Lakes Apartments) | 120 | 94.8% | +12% | 3.72 | -32% | -8% | $23.1k | 20 | 4.0 | - | 112 | A+ | 63 | Theresa Felicione | $12.9M | $7.0M | 53.8% | 105398 | ||||
| Pinellas Park Post-Acute and Rehabilitation Center |
NH
Nursing Home Licensed facility providing 24/7 skilled nursing care for residents with complex, ongoing medical needs. Staffed by RNs, LPNs, and CNAs. Inspected and star-rated annually by CMS. Accepts Medicare (short-term rehab) and Medicaid (long-term care).
HC
Home Care Professional care delivered in the person's own home — from companionship and errands to skilled nursing and therapy. Allows seniors to age in place. Medicare covers skilled home health when medically necessary.
MC
Memory Care Secured, specialized care for people living with Alzheimer's or dementia. Staff trained in cognitive impairment, with higher staff-to-resident ratios and an environment designed to reduce confusion and wandering risk. |
Pinellas Park | 120 | 90.4% | +7% | - | - | -40% | - | $19.7k | 21 | 4.2 | 2 | - | - | 74 | David Mcmillon | $16.3M | $7.9M | 48.4% | 105422 | |||
| Gateway Post-Acute Care Center |
NH
Nursing Home Licensed facility providing 24/7 skilled nursing care for residents with complex, ongoing medical needs. Staffed by RNs, LPNs, and CNAs. Inspected and star-rated annually by CMS. Accepts Medicare (short-term rehab) and Medicaid (long-term care).
HC
Home Care Professional care delivered in the person's own home — from companionship and errands to skilled nursing and therapy. Allows seniors to age in place. Medicare covers skilled home health when medically necessary.
MC
Memory Care Secured, specialized care for people living with Alzheimer's or dementia. Staff trained in cognitive impairment, with higher staff-to-resident ratios and an environment designed to reduce confusion and wandering risk. |
Pinellas Park | 120 | 92.7% | +10% | - | -21% | - | $0 | 28 | 4.7 | - | 105 | A+ | 47 | Ivana Kirby | $17.8M | $7.3M | 41.1% | 105486 |
Tierra Pines Center is in the Monterey Lakes Apartments neighborhood of Largo.
Tierra Pines Center has a walk score of 63. Moderately walkable. Some errands can be accomplished on foot, with a mix of nearby amenities.
Tierra Pines Center's occupancy is 94.8%.
Yes — there are 15 photos of Tierra Pines Center in the photo gallery on this page.
Tierra Pines Center is located at 7380 Ulmerton Rd, Largo, FL 33771.
(727) 535-9833 will put you in contact with the team at Tierra Pines Center.
Yes — Tierra Pines Center is a CMS-certified provider of Medicare and Medicaid.
Care Cost Calculator: See Prices in Your Area
Nursing Home Data Explorer
Don’t Wait Too Long: 7 Red Flag Signs Your Parent Needs Assisted Living Now
The True Cost of Assisted Living in 2025 – And How Families Are Paying For It
Understanding Senior Living Costs: Pricing Models, Discounts & Financial Assistance


Thank you for your interest!
Our team will be in touch shortly to help with next steps.
