Tierra Pines Center
Nursing Home, Palliative Care & Respite Care · Pinellas County, FL
CMS overall rating Info CMS (the Centers for Medicare & Medicaid Services) is the federal agency that rates nursing home quality. Its Overall Rating runs from 1 to 5 stars, combining health inspections, staffing, and quality measures, with inspections weighted most heavily.

Tierra Pines Center

Nursing Home, Palliative Care & Respite Care · Pinellas County, FL
CMS overall rating Info CMS (the Centers for Medicare & Medicaid Services) is the federal agency that rates nursing home quality. Its Overall Rating runs from 1 to 5 stars, combining health inspections, staffing, and quality measures, with inspections weighted most heavily.
Calculator: See prices in your area
Tierra Pines Center accepts Medicare, Medicaid, and private pay.

Overview of Tierra Pines Center

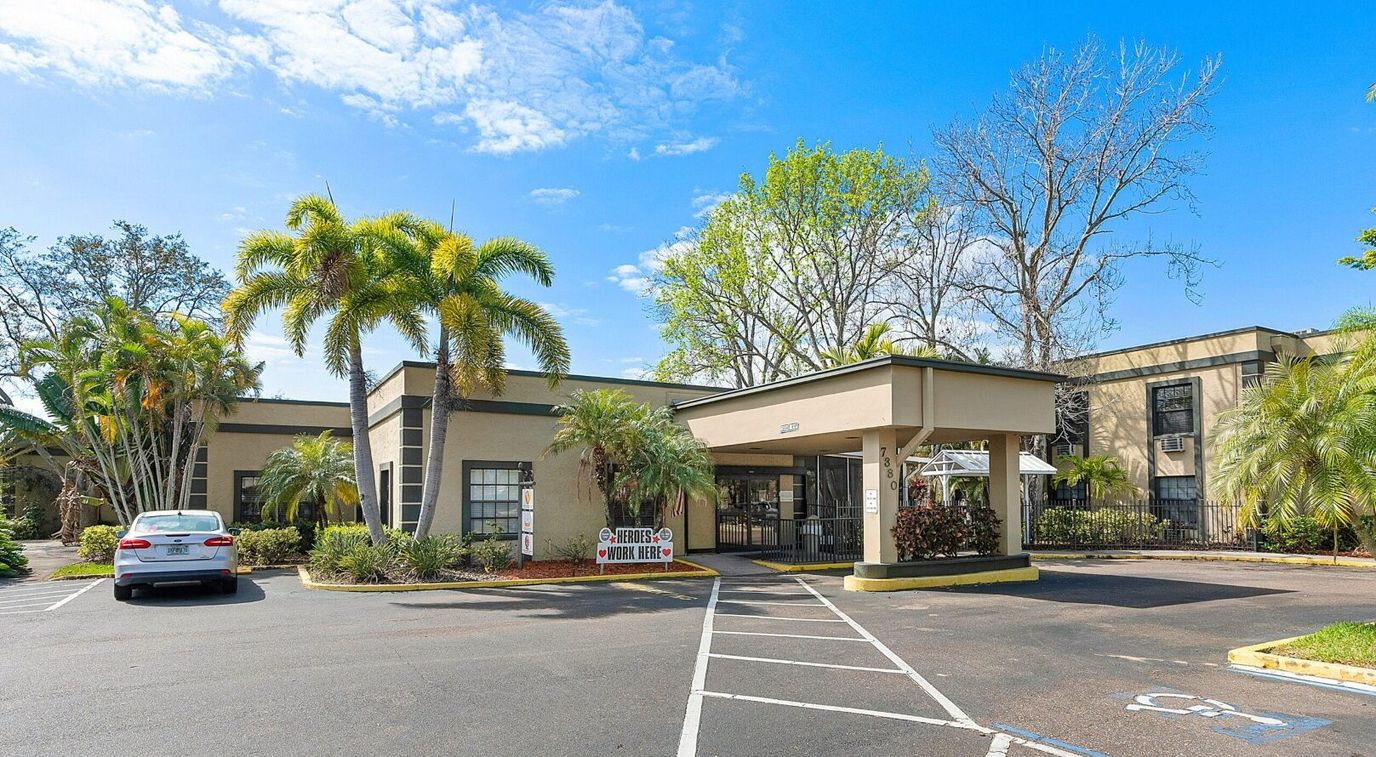
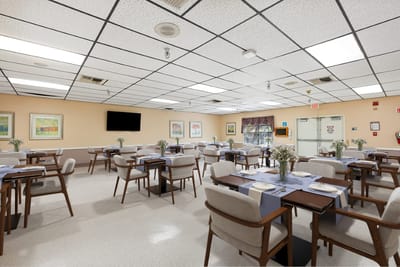
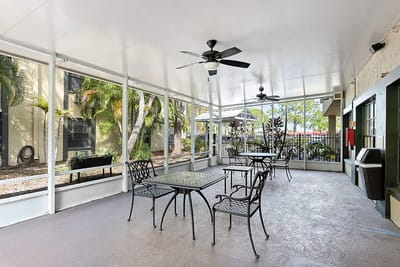
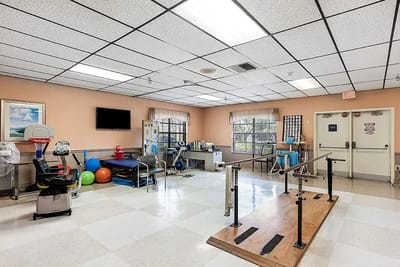
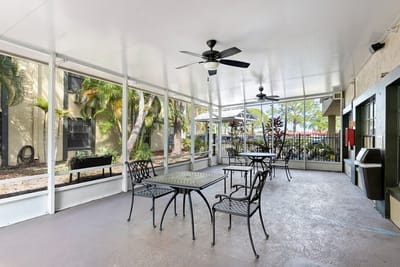
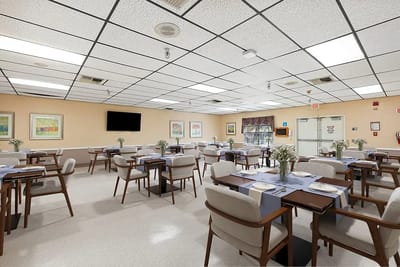
Start your wellness journey with Tierra Pines Center, a trusted community located in the scenic setting of Largo, FL, that offers long-term care, short-term rehabilitation, and specialized care. With top-notch care and assistance provided 24/7, the community strives to meet residents’ special needs to ensure a comfortable lifestyle. Residents can feel at ease with the community’s cozy and welcoming environment.

A jam-packed calendar of fun activities and engaging programs is also conducted for residents to remain socially engaged and active. Prioritizing residents’ health, delightful and nutritious meals are also served to satisfy dietary needs and preferences. The community is dedicated to improving residents’ well-being, providing comprehensive care for the finest retirement experience.

(727) 535-9833

Quality ratings

Measured by Centers for Medicare & Medicaid Services (CMS)

Overall rating Info The Overall CMS Rating combines results from health inspections, staffing levels and quality measures. Health inspections carry the most weight. Staffing and quality scores can increase or decrease the final rating based on performance compared to state and national standards.
▼ 5.5% Below FL avg. ▼ 5.5% Below FL avg.FL average: 3.2Click the badge to see the full State ranking.Click here to see the full State ranking.
Health Inspection Info Based on the results of the facility's three most recent standard inspections and any complaint investigations. CMS reviews the number, scope, and severity of deficiencies, with more recent findings weighted more heavily.
▲ 6.7% Above FL avg. ▲ 6.7% Above FL avg.FL average: 2.8Click the badge to see the full State ranking.Click here to see the full State ranking.
Staffing Info Measures average nursing staff hours per resident per day, including Registered Nurses (RNs) and total nursing staff. Ratings are adjusted based on the level of care residents require and are compared to state and national benchmarks.
▼ 40.9% Below FL avg. ▼ 40.9% Below FL avg.FL average: 3.4Click the badge to see the full State ranking.Click here to see the full State ranking.
Quality Measures Info Based on clinical and physical health indicators reported to CMS, such as hospital readmissions, falls, pressure ulcers, and improvements in mobility. These measures reflect how well residents' health needs are being managed.
▼ 26.1% Below FL avg. ▼ 26.1% Below FL avg.FL average: 4.1Click the badge to see the full State ranking.Click here to see the full State ranking.

Staffing hours breakdown

Info Daily nursing hours per resident by staff type, reported to CMS. Higher is generally better — compare this facility to state and national averages to see where staffing stands.

Hours per resident per day — compared to Florida state averages

Total nursing care / resident Info This home is ranked 175th out of 253 homes in Florida for nurse hours. Total adjusted nursing hours per resident per day, combining RN, LPN, and aide time. CMS adjusts this for case-mix so facilities can be fairly compared.
3h 43m per day
Rank #175 / 253Nurse hours — State benchmarkedThis home is ranked 175th out of 253 homes in Florida. Shows adjusted nurse hours per resident per day benchmarked to the Florida average, with a ranking across 253 Florida facilities. More hours mean more direct care. The national average is about 3.5 hrs; below 3.0 is a red flag.Ranking totals vary by category as each rank only includes facilities that report data for that metric. Homes missing that data point aren't included in the ranking.Click the rank badge to see the full State ranking.Click here to see the full State ranking.
This facility Florida avg (4h 2m per day)
vs Florida avg
-8%

5 of 6 metrics below state avg

Standout metric LPN / LVN is +8% above state avg
Staff typeHours / Day / Residentvs state avg
Registered Nurse (RN) Info RNs hold the highest nursing license and can assess residents, interpret test results, and direct care plans. More RN hours per day often signals stronger clinical oversight and faster response to health changes. 25m per day ▼ 43% State avg: 44m per day · National avg: 41m per day
LPN / LVN Info Licensed Practical Nurses (LPNs) or Licensed Vocational Nurses (LVNs) deliver routine hands-on care — medication administration, wound dressing, and monitoring vital signs. They work under RN supervision and make up a large share of daily bedside care. 51m per day ▲ 8% State avg: 47m per day · National avg: 52m per day
Nurse Aide Info Certified Nurse Aides (CNAs) provide the most direct day-to-day assistance: bathing, dressing, feeding, and mobility. Nurse aide hours are typically the largest staffing category and directly affect residents' quality of life. 2h 6m per day ▼ 10% State avg: 2h 20m per day · National avg: 2h 21m per day
Weekend Total Nursing Info Combined nursing hours (RN + LPN + Nurse Aide) per resident per day on weekends. Staffing often drops on weekends — this figure reveals whether the facility maintains adequate coverage outside of weekday hours. 3h 7m per day ▼ 11% State avg: 3h 31m per day · National avg: 3h 26m per day
Physical Therapist Info Hours per resident per day provided by licensed Physical Therapists (PTs) or PT Assistants. PT services help residents recover mobility after injury or illness and are especially important for post-acute (short-stay) rehabilitation. 4m per day ▼ 14% State avg: 5m per day · National avg: 4m per day
Weekend RN Info Registered nurse hours specifically on weekends. Facilities sometimes reduce RN presence on Saturdays and Sundays — a low weekend RN figure compared to weekday hours can indicate reduced clinical oversight when most administrative staff are absent. 15m per day ▼ 54% State avg: 32m per day · National avg: 29m per day

Capacity and availability

This home usually has limited availability

Higher occupancy than the Florida average: 84.3%
Occupancy rate
94.8% Rank #31 / 258Occupancy rate — State benchmarkedThis home is ranked 31st out of 258 homes in Florida. Shows this facility's occupancy rate versus the Florida average, with its Statewide rank out of 258. Higher occupancy signals strong local demand and financial stability.Ranking totals vary by category as each rank only includes facilities that report data for that metric. Homes missing that data point aren't included in the ranking.Click the rank badge to see the full State ranking.Click here to see the full State ranking.
Avg. Length of Stay
104 days
Bed community size
120-bed community Rank #256 / 1074Bed count — State benchmarkedThis home is ranked 256th out of 1074 homes in Florida. Shows this facility's certified or reported bed count compared to other Florida facilities. Larger communities may offer more amenities, programs, and on-site services for residents and families.Ranking totals vary by category as each rank only includes facilities that report data for that metric. Homes missing that data point aren't included in the ranking.Click the rank badge to see the full State ranking.Click here to see the full State ranking.
A larger shared setting that may offer more common spaces and organized community services.
Years in operation
23 years in operation
A longer operating history, which may indicate experience navigating regulations and delivering ongoing care.
Walk Score
Walk Score: 63 / 100 Rank #309 / 1486Walk Score — State benchmarkedThis home is ranked 309th out of 1486 homes in Florida. Shows how walkable this facility's neighborhood is compared to the average Walk Score across Florida facilities. Higher scores benefit residents, families, and staff.Ranking totals vary by category as each rank only includes facilities that report data for that metric. Homes missing that data point aren't included in the ranking.Click the rank badge to see the full State ranking.Click here to see the full State ranking.
Moderately walkable. Some errands can be accomplished on foot, with a mix of nearby amenities.
BBB Rating
BBB Rating: A+ (Not Accredited)
An independent rating from the Better Business Bureau based on factors such as complaint history, transparency, and business practices.
How BBB ratings work

About this community

License Details

CMS Certification Number105398

Staffing

Key information about the people who lead and staff this community.

Leadership

ContactJohn Masterson, Administrator

Therapy & Rehabilitation

3 services
Rehabilitation Services
Respite Care
Short-Term Rehab

Staffing & Medical

1 service
24-Hour Staffing

Amenities & Lifestyle

Spacious + Welcoming Facility
Telephone + Internet
Transportation To Medical Appointments
Private + Semi-Private Rooms
Social Activities + Recreational Programs
Fine Restaurant Style Dining
Specific ProgramsPost-Surgical Care, Pain Management, Physical, Occupational + Speech Therapy, Cognitive + Adaptive Therapy, ADL Suite + Strength Training, 24/7 Nursing Care, Therapeutic Recreation

Dining & Nutrition

Food DescriptionFine restaurant style dining

Contact Tierra Pines Center

Inspection History

In Florida, the Agency for Health Care Administration (AHCA) is the primary authority that conducts unannounced inspections and completes official health quality reports for all healthcare facilities.

Since 2021 · 5 years of data 26 citations
We don't publish a score for nursing homes with fewer than three inspections on record. This would unfairly reward providers with limited inspection history or those that have not been operating long enough to be cited.

Inspection score unavailable

Not enough inspection history to generate a score.

Average score for Florida nursing homes: B 83/100

Inspection score not available. Not enough inspection history to score against the Florida benchmark.

Inspection Scorecard Info This scorecard compares key inspection, citation, and complaint metrics at this facility against the Florida state average. Metrics rated ≥15% worse than average are highlighted in red; those ≥15% better are highlighted in green.

Since 2021 vs. Florida state average
Overall vs. FL average 0 Worse No metrics in this bucket. 2 Better Metrics better than Florida average:
• Total citations (21% below)
• Citations per year (21% below)
Latest Inspection January 30, 2025 Routine

Citations Info Citations are formal regulatory issues recorded during state inspections.

This FacilityFL Averagevs. FL Avg
Total citations Info Formal regulatory issues recorded by inspectors across all inspection types. 2633 This facility has 21% fewer total citations than a typical Florida nursing home (26 vs. FL avg 33).↓ 21% better
Citations per year Info Average citations per year since 2021. 5.26.6 This facility has 21% fewer citations per year than a typical Florida nursing home (5.2 vs. FL avg 6.6).↓ 21% better

Inspection Reports Summary Info An editor-reviewed summary of the themes and findings across this facility's recent inspection reports.

  • January 30, 2025 inspection found 5 deficiencies including failure to follow PASARR Level II recommendations, inadequate wound care, and poor kitchen sanitation monitoring.
  • April 15, 2024 inspection identified 5 maintenance failures including broken laundry machines, unclean stove, peeling exhaust hood paint, and leaking garbage disposal.
  • October 31, 2023 inspection noted 3 deficiencies with damaged wheelchairs, peeling over-bed tables, and water damage with biogrowth in a resident room.

Health Inspection History

Inspections since 2021
Total health inspections 5

Florida average 4.3


Last Health inspection on Jan 2025

Total health citations
20 Rank #142 / 252Health citations — State benchmarkedThis home is ranked 142nd out of 252 homes in Florida. Shows this facility's total health deficiency citations benchmarked to the Florida State average, with a ranking across all 252 FL facilities. Lower citation counts earn a better rank.Ranking totals vary by category as each rank only includes facilities that report data for that metric. Homes missing that data point aren't included in the ranking.Click the rank badge to see the full State ranking.Click here to see the full State ranking.

Florida average 19.7

Citations per inspection
4 Rank #112 / 252Citations per inspection — State benchmarkedThis home is ranked 112th out of 252 homes in Florida. Shows average deficiency citations per CMS inspection for this facility versus the Florida mean across 252 facilities with citation data. Lower is better.Ranking totals vary by category as each rank only includes facilities that report data for that metric. Homes missing that data point aren't included in the ranking.Click the rank badge to see the full State ranking.Click here to see the full State ranking.

Florida average 4.48


Health citations are formal notices following inspections when they fail to comply with safety and care standards.

14 of 20 citations resulted from standard inspections; 4 of 20 resulted from complaint investigations; and 2 of 20 came from combined inspections (standard and complaint).

Breakdown of citation severity (last 5 years)
Critical health citations
0
100% better than Florida average

Florida average: 0.8


Serious health citations
0
100% better than Florida average

Florida average: 0.4

0 critical citations Florida average: 0.8

0 serious citations Florida average: 0.4

20 moderate citations Florida average: 18.4

0 minor citations Florida average: 0.2
Citations history (last 5 years)
Nutrition moderate citation Jan 30, 2025
Corrected

Quality of Care moderate citation Jan 30, 2025
Corrected

Quality of Care moderate citation Jan 30, 2025
Corrected

Care Planning moderate citation Jan 30, 2025
Corrected

Staffing Data

Reporting period: October 1 – December 31, 2025 (Q4 2025). Source: CMS Payroll-Based Journal report.

Total staff 159
Employees 156
Contractors 3
Staff to resident ratio 1.38 : 1
6% fewer staff per resident than Florida average
Florida average ratio: 1.47 : 1 Florida average ratio: 1.47 : 1See full Florida ranking
Avg staff/day 55
Average shift 8.1 hours
0% compared with Florida average
Florida average: 7.9 hours Florida average shift: 7.9 hoursSee full Florida ranking
Total staff hours (quarter) 41,107

Nursing staff breakdown

Q4 2025 · Oct 1 – Dec 31 More info This data comes from the CMS Payroll-Based Journal report covering October 1 – December 31, 2025.
Registered Nurse

Manages medical care and health needs.

RN Staff Info All 13 RN Staff are full-time employees. No contractors work on this role. 13
Average shift length Info Average shift length. Calculated as total hours divided by days worked and average staff per day. 7.7 hours
Licensed Practical Nurse

Assists with medical care and medications.

LPN Staff Info All 28 LPN Staff are full-time employees. No contractors work on this role. 28
Average shift length Info Average shift length. Calculated as total hours divided by days worked and average staff per day. 9.1 hours
Certified Nursing Assistant

Helps with daily care and mobility.

CNA Staff Info All 64 CNA Staff are full-time employees. No contractors work on this role. 64
Average shift length Info Average shift length. Calculated as total hours divided by days worked and average staff per day. 8.4 hours

Contractor staffing

Q4 2025 · Oct 1 – Dec 31 More info This data comes from the CMS Payroll-Based Journal report covering October 1 – December 31, 2025.

Total hours from contractors

1.7%

680 contractor hours this quarter

Occupational Therapy Aide: 1 RN Director of Nursing: 1 Medical Director: 1

Staff by category

Q4 2025 · Oct 1 – Dec 31 More info This data comes from the CMS Payroll-Based Journal report covering October 1 – December 31, 2025.
Certified Nursing Assistant6406419,85792100%8.4
Licensed Practical Nurse280287,92692100%9.1
Registered Nurse130133,49092100%7.7
Nurse Aide in Training8081,8539199%8
Dietitian180181,4499199%7.6
RN Director of Nursing1128318491%6
Physical Therapy Aide4048187379%6.8
Speech Language Pathologist4047777177%7.1
Respiratory Therapy Technician5057466975%7.6
Dental Services Staff1015256470%8.2
Mental Health Service Worker1014565762%8
Qualified Social Worker2024496368%6.9
Administrator1014485661%8
Nurse Practitioner1014255459%7.9
Clinical Nurse Specialist2023845459%6.5
Physical Therapy Assistant3033456470%5.4
Occupational Therapy Aide0112994043%7.5
Medical Director0113067%5
64 Certified Nursing Assistant
% of Days 100%
28 Licensed Practical Nurse
% of Days 100%
13 Registered Nurse
% of Days 100%
8 Nurse Aide in Training
% of Days 99%
18 Dietitian
% of Days 99%
2 RN Director of Nursing
% of Days 91%
4 Physical Therapy Aide
% of Days 79%
4 Speech Language Pathologist
% of Days 77%
5 Respiratory Therapy Technician
% of Days 75%
1 Dental Services Staff
% of Days 70%
1 Mental Health Service Worker
% of Days 62%
2 Qualified Social Worker
% of Days 68%
1 Administrator
% of Days 61%
1 Nurse Practitioner
% of Days 59%
2 Clinical Nurse Specialist
% of Days 59%
3 Physical Therapy Assistant
% of Days 70%
1 Occupational Therapy Aide
% of Days 43%
1 Medical Director
% of Days 7%

Penalties and fines

Includes penalties issued in 2025

Federal penalties imposed by CMS for regulatory violations, including civil money penalties (fines) and denials of payment for new Medicare/Medicaid admissions.

Source: CMS Penalties Database (Data as of Jan 2026)

Total fines amount $4K Rank #162 / 258Federal fines — State benchmarkedThis home is ranked 162nd out of 258 homes in Florida. Shows this facility's cumulative CMS federal fine dollars versus the Florida average among facilities with fines, and where it ranks among 258 facilities in the pool. Lower total dollars mean a better rank.Ranking totals vary by category as each rank only includes facilities that report data for that metric. Homes missing that data point aren't included in the ranking.Click the rank badge to see the full State ranking.Click here to see the full State ranking.
94% lower than Florida average

Florida average: $72K

Number of fines 1
62% fewer fines than Florida average

Florida average: 2.6

Payment Denials Info Serious action where Medicare and/or Medicaid temporarily stops payments for new residents until issues are fixed. 0
100% fewer payment denials than Florida average

Florida average: 0.1

Fines amount comparison
This facility $4K
Florida average $72K
Penalty History

Penalties are imposed by CMS for violations of federal nursing home regulations.

1 penalty in the past 3 years

Jan 30, 2025 · $4K

Civil Money Penalty Info Fines imposed for noncompliance, which can be assessed per day or per instance of violation. Jan 30, 2025
$4K

Last updated: Jan 2026

Quality of care over time

These measures show how residents usually do over time at this home, based on health outcomes and preventive care.

High-risk clinical events score Info A composite score based on pressure ulcers, falls with injury, weight loss, walking ability decline, and activities of daily living decline. 10.3
39% worse than Florida average

Florida average: 7.4

Functional decline score Info A composite score based on activities of daily living decline, walking ability decline, and incontinence. 15.4
24% worse than Florida average

Florida average: 12.4

Long-stay resident measures
Above average Florida avg: 4.5 Info CMS star rating based on long-stay quality measure performance. 5 stars = significantly above average, 1 star = significantly below average.
Need for Help with Daily Activities Increased Info Percent of long-stay residents whose need for help with daily activities has increased 16.0%
52% worse than Florida average

Florida average: 10.5%

Walking Ability Worsened Info Percent of long-stay residents whose ability to move independently worsened 10.9%
16% better than Florida average

Florida average: 12.9%

Low Risk Residents with Bowel/Bladder Incontinence Info Percent of low risk long-stay residents who lose control of their bowels or bladder 19.3%
43% worse than Florida average

Florida average: 13.5%

Falls with Major Injury Info Percent of long-stay residents experiencing one or more falls with major injury 4.4%
66% worse than Florida average

Florida average: 2.6%

High Risk Residents with Pressure Ulcers Info Percent of long-stay high risk residents with pressure ulcers 10.7%
99% worse than Florida average

Florida average: 5.4%

Urinary Tract Infection Info Percent of long-stay residents with a urinary tract infection 0.0%
100% better than Florida average

Florida average: 0.9%

Lost Too Much Weight Info Percent of long-stay residents who lose too much weight 9.5%
59% worse than Florida average

Florida average: 6.0%

Depressive Symptoms Info Percent of long-stay residents who have depressive symptoms 0.0%
100% better than Florida average

Florida average: 3.3%

Antipsychotic Use Info Percent of long-stay residents who received an antipsychotic medication 18.5%
130% worse than Florida average

Florida average: 8.0%

Pneumococcal Vaccine Info Percent of long-stay residents assessed and appropriately given the pneumococcal vaccine 100.0%
In line with Florida average

Florida average: 97.7%

Influenza Vaccine Info Percent of long-stay residents assessed and appropriately given the seasonal influenza vaccine 100.0%
In line with Florida average

Florida average: 99.2%

Hospitalizations per 1,000 days Info Number of hospitalizations per 1,000 long-stay resident days. 2.08
In line with Florida average

Florida average: 2.10

ED visits per 1,000 days Info Number of outpatient emergency department visits per 1,000 long-stay resident days. 0.94
20% better than Florida average

Florida average: 1.18

Short-stay resident measures
Significantly below average Florida avg: 3.1 Info CMS star rating based on short-stay quality measure performance. 5 stars = much above average, 1 star = much below average.
Pneumococcal Vaccine Info Percent of short-stay residents assessed and appropriately given the pneumococcal vaccine 97.7%
In line with Florida average

Florida average: 94.0%

Antipsychotic medication increase Info Percent of short-stay residents who newly received an antipsychotic medication 3.6%
138% worse than Florida average

Florida average: 1.5%

Influenza Vaccine Info Percent of short-stay residents assessed and appropriately given the seasonal influenza vaccine 93.8%
In line with Florida average

Florida average: 94.7%

Re-hospitalized after SNF stay Info Percentage of short-stay residents who were re-hospitalized after their nursing home admission. 23.4%
11% better than Florida average

Florida average: 26.2%

Emergency department visits Info Percentage of short-stay residents who had an outpatient emergency department visit. 9.5%
In line with Florida average

Florida average: 9.3%

Falls with major injury Info Percentage of SNF residents who experience falls with major injury during their stay. 2.1%
174% worse than Florida average

Florida average: 0.8%

Ability to care for self at discharge Info Percentage of residents at or above expected ability to care for themselves at discharge. 47.8%
11% worse than Florida average

Florida average: 53.7%

Successful return to home or community Info Rate of successful return to home or community from a skilled nursing facility. 29.7%
41% worse than Florida average

Florida average: 50.6%

Breakdown by payment type

Medicare

30% of new residents, usually for short-term rehab.

Typical stay 29 days

Private pay

35% of new residents, often for short stays.

Typical stay 1 - 2 months

Medicaid

34% of new residents, often for long-term daily care.

Typical stay 5 - 6 months

Facility Characteristics

Source: CMS Long-Term Care Facility Characteristics (Data as of Jan 2026)

Total residents 115
Medicare
15
13% of residents
Medicaid
83
72.2% of residents
Private pay or other
17
14.8% of residents
Programs & Services
Residents Group

Residents meet regularly to discuss policies, care quality, and activities

Family Member Group

Family members meet regularly to discuss policies, care quality, and activities

Active Family Council

Organized group of family members that meets regularly to discuss facility policies, resident care, and activities.

Active Resident Council

Organized group of residents that meets regularly to discuss facility policies, quality of life, and activities.

Finances and operations

Based on CMS SNF Cost Report for fiscal year ending in 09/2023.

Voluntary non-profit community
Operated by a church.
Net patient revenue Info Net patient revenue — what the home actually collects for resident care, after contractual allowances, bad debt and discounts are subtracted from its gross charges (CMS cost report, Worksheet G-3). It covers resident care only; money the home earns from other sources is shown separately as "Other income."
$12.9M
Net patient income Info Net patient income: net patient revenue minus the home's total operating expenses. A positive figure means it earns more from resident care than it spends to deliver it; a negative figure means the opposite. It excludes non-operating "other income."
$3.9M
Voluntary non-profit community Operated by a church.
Net patient revenue Info Net patient revenue — what the home actually collects for resident care, after contractual allowances, bad debt and discounts are subtracted from its gross charges (CMS cost report, Worksheet G-3). It covers resident care only; money the home earns from other sources is shown separately as "Other income."
$12.9M Rank #195 / 257Revenue — State benchmarkedThis home is ranked 195th out of 257 homes in Florida. Shows this facility's annual revenue compared to the Florida average. Higher revenue generally means more resources for staffing and capital — read alongside Payroll %.Ranking totals vary by category as each rank only includes facilities that report data for that metric. Homes missing that data point aren't included in the ranking.Click the rank badge to see the full State ranking.Click here to see the full State ranking.
Net patient income Info Net patient income: net patient revenue minus the home's total operating expenses. A positive figure means it earns more from resident care than it spends to deliver it; a negative figure means the opposite. It excludes non-operating "other income."
$3.9M
Other income Info Money the home earns outside of resident care — such as investments, grants, rentals and other non-operating sources (CMS cost report, Worksheet G-3). It is tracked separately from net patient revenue: it is not part of that figure, and it is not included in net patient income.
-$9.4K
Payroll costs Info Staff salaries plus wage-related costs — benefits such as payroll taxes, health insurance and retirement — from the home's own accounting records (CMS cost report, Worksheet A). Contract or agency labor is counted separately, under other operating costs. Rank #167 / 257Payroll — State benchmarkedThis home is ranked 167th out of 257 homes in Florida. Shows total annual staff payroll benchmarked to the Florida average. Higher payroll investment relative to peers often signals better staffing and less reliance on cheaper contract labor.Ranking totals vary by category as each rank only includes facilities that report data for that metric. Homes missing that data point aren't included in the ranking.Click the rank badge to see the full State ranking.Click here to see the full State ranking.
$6.5M 50.2% of net patient revenue Info Payroll as a share of revenue: staff salaries and wage-related benefits divided by net patient revenue. A higher figure means more of each revenue dollar goes to staff pay. Rank #40 / 257Payroll % — State benchmarkedThis home is ranked 40th out of 257 homes in Florida. Shows payroll as a percentage of revenue versus the Florida average. Well-run Florida facilities typically land around 49–56% — the top third Statewide. Below 25% may signal understaffing or heavy agency use — read with Staffing ratings.Ranking totals vary by category as each rank only includes facilities that report data for that metric. Homes missing that data point aren't included in the ranking.Click the rank badge to see the full State ranking.Click here to see the full State ranking.
Other operating costs Info Everything it costs to run the home apart from payroll — food, utilities, supplies, maintenance, contract labor and administration. Calculated as total operating expense minus payroll (staff salaries and wage-related benefits).
$2.6M
Total costs Info The home's total operating expense for the year — all the costs of running it, salaries included (CMS cost report, Worksheet G-3).
$9.1M

What does this home offer?

Housing options icon

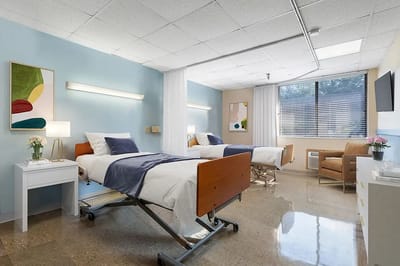
Housing Options: Private / Semi-Private Rooms

Building type icon
Building type icon

Building Type: Single-story

Recreational activities icon

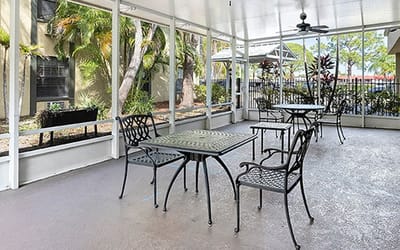
Recreational Activities
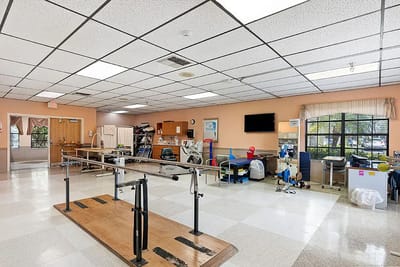
Exercise program icon

Exercise Programs

Health Programs icon

Health Programs

Who this home usually serves

TYPE OF STAY

Mix of rehab and long-term care

This home supports both short-term rehab and long-term care, with residents staying for a wide range of durations.

New residents most often arrive under private pay (35% of admissions), and a typical private pay stay runs around 1 - 2 months.

Admissions
500 total

Coverage residents most often arrive under.

Medicare 30%
Private pay 35%
Medicaid 34%
Discharges
399 total

Coverage residents most often leave under.

Medicare 39%
Private pay 36%
Medicaid 25%

Places of interest near Tierra Pines Center

Address 4.0 miles from city center Info Estimated distance in miles from Largo's city center to Tierra Pines Center's address, calculated via Google Maps.

Calculate Travel Distance to Tierra Pines Center

Add your location

Address

Compare Nursing Home around Pinellas County

The information below is reported by the Florida Agency for Health Care Administration (AHCA).

5 facilities compared · CMS & FL Dept. of Health data

East Bay Rehabilitation Center
NH
Clearwater
120
Facility 120
FL AVG 89
Rank #256 / 1074
89.3%
Facility 89.3%
FL AVG 84.3%
Rank #133 / 258
+6%
4.21
Facility 4.21
FL AVG 4.04
Rank #75 / 253
-45%+4%
$0
Facility $0
FL AVG $78.9k
Rank #1 / 258
-
13
Facility 13
FL AVG 19.7
Rank #73 / 252
3.3
Facility 3.3
FL AVG 4.5
Rank #73 / 252
-112-
13
Facility 13
FL AVG 40
Rank #1203 / 1486
-
$14.4M
Facility $14.4M
FL AVG $15.7M
Rank #172 / 257
$8.1M
Facility $8.1M
FL AVG $6.1M
Rank #124 / 257
56.5%
Facility 56.5%
FL AVG 39.8%
Rank #32 / 257
105697
Oak Manor Senior Living Community
NH
AL
IL
Largo (Anona)
150
Facility 150
FL AVG 89
Rank #135 / 1074
69.6%
Facility 69.6%
FL AVG 84.3%
Rank #226 / 258
-17%
3.63
Facility 3.63
FL AVG 4.04
Rank #198 / 253
-37%-10%
$4.0k
Facility $4.0k
FL AVG $78.9k
Rank #161 / 258
73
Facility 73
FL AVG 83
Rank #692 / 876
13
Facility 13
FL AVG 19.7
Rank #73 / 252
2.2
Facility 2.2
FL AVG 4.5
Rank #28 / 252
-131-
19
Facility 19
FL AVG 40
Rank #1109 / 1486
Brad Graham
$14.3M
Facility $14.3M
FL AVG $15.7M
Rank #152 / 257
$6.9M
Facility $6.9M
FL AVG $6.1M
Rank #136 / 257
48%
Facility 48%
FL AVG 39.8%
Rank #104 / 257
105248
Gulf Shore Care Center
NH
NC
Pinellas Park
120
Facility 120
FL AVG 89
Rank #256 / 1074
94.2%
Facility 94.2%
FL AVG 84.3%
Rank #39 / 258
+12%
3.23
Facility 3.23
FL AVG 4.04
Rank #250 / 253
-47%-20%
$0
Facility $0
FL AVG $78.9k
Rank #1 / 258
-
15
Facility 15
FL AVG 19.7
Rank #93 / 252
5.0
Facility 5.0
FL AVG 4.5
Rank #164 / 252
-113-
52
Facility 52
FL AVG 40
Rank #484 / 1486
Gulf Shore Nursing Holdco LLC
$6.9M
Facility $6.9M
FL AVG $15.7M
Rank #209 / 257
$3.1M
Facility $3.1M
FL AVG $6.1M
Rank #240 / 257
44.7%
Facility 44.7%
FL AVG 39.8%
Rank #245 / 257
105978
Tierra Pines Center
NH
PC
RC
Largo (Monterey Lakes Apartments)
120
Facility 120
FL AVG 89
Rank #256 / 1074
94.8%
Facility 94.8%
FL AVG 84.3%
Rank #31 / 258
+12%
3.72
Facility 3.72
FL AVG 4.04
Rank #175 / 253
-32%-8%
$4.1k
Facility $4.1k
FL AVG $78.9k
Rank #162 / 258
-
20
Facility 20
FL AVG 19.7
Rank #142 / 252
4.0
Facility 4.0
FL AVG 4.5
Rank #112 / 252
-113A+
63
Facility 63
FL AVG 40
Rank #309 / 1486
Theresa Felicione
$12.9M
Facility $12.9M
FL AVG $15.7M
Rank #195 / 257
$6.5M
Facility $6.5M
FL AVG $6.1M
Rank #167 / 257
50.2%
Facility 50.2%
FL AVG 39.8%
Rank #40 / 257
105398
Gateway Post-Acute Care Center
NH
NC
Pinellas Park
120
Facility 120
FL AVG 89
Rank #256 / 1074
92.7%
Facility 92.7%
FL AVG 84.3%
Rank #71 / 258
+10%- -21%-
$0
Facility $0
FL AVG $78.9k
Rank #1 / 258
-
28
Facility 28
FL AVG 19.7
Rank #198 / 252
4.7
Facility 4.7
FL AVG 4.5
Rank #150 / 252
-105A+
47
Facility 47
FL AVG 40
Rank #570 / 1486
Ivana Kirby
$12.4M
Facility $12.4M
FL AVG $15.7M
Rank #135 / 257
$6.8M
Facility $6.8M
FL AVG $6.1M
Rank #156 / 257
54.7%
Facility 54.7%
FL AVG 39.8%
Rank #160 / 257
105486

Financial Assistance for
Nursing Home in Florida

Tierra Pines Center is located in Largo, Florida.
Here are the financial assistance programs available to residents in Florida.

Get Financial aid guidance

Long-Term Care Waiver

Florida Medicaid LTC Waiver

Age 65+ or 21+ disabled
General Florida resident, Medicaid- eligible, nursing home-level care need.
Income Limits (2025) ~$2,829/month 300% FBR, individual
Asset Limits $2,000 (individual), $3,000 (couple).
FL

High demand; waitlists common.

Benefits
In-home care (6-8 hours/day) Assisted living Respite (240 hours/year) Case management

Community Care for the Elderly (CCE)

Florida CCE

Age 60+
General Florida resident, at risk of nursing home.
Income Limits ~$2,000/month varies
Asset Limits $5,000 individual
FL

Limited funding; regional variation.

Benefits
Homemaker services (3-5 hours/week) Adult day care (~$60/day) Respite (up to 10 days/year)

Home Care for the Elderly (HCE)

Florida Home Care for the Elderly

Age 60+
General Florida resident, at risk of nursing home placement; caregiver must be approved.
Income Limits (2025) ~$2,829/month individual, aligned with Medicaid thresholds
Asset Limits ~$2,000 (individual); varies by case manager discretion.
FL

Limited funding (~3,500 served annually); prioritizes low-income frail seniors.

Benefits
Basic subsidy (~$160/month) for housing/medical costs; special subsidies for supplies/services (e.g., incontinence supplies, ~$50-$200/month)

Program of All-Inclusive Care for the Elderly (PACE)

Florida Medicaid PACE

Age 55+
General Florida resident, nursing home-level care need, safe with PACE support.
Income Limits (2025) ~$2,829/month 300% FBR
Asset Limits $2,000 (individual), $3,000 (couple).
FL

Limited to specific counties (e.g., Hillsborough, Miami-Dade); ~10 sites statewide.

Benefits
Personal care (5-7 hours/day) Medical care Meals Transportation Therapy

Optional State Supplementation (OSS)

Florida Optional State Supplementation

Age 65+ or disabled
General Florida resident, living in approved facility, receiving SSI or low-income.
Income Limits (2025) ~$1,004/month individual, including SSI
Asset Limits $2,000 (individual), $3,000 (couple).
FL

Limited to specific facility types; ~$78.40/month max supplement.

Benefits
Cash payment (~$78.40/month) for room/board or personal needs in facilities

Frequently Asked Questions about Tierra Pines Center

What neighborhood is Tierra Pines Center in?

Tierra Pines Center is in the Monterey Lakes Apartments neighborhood of Largo.

Is Tierra Pines Center in a walkable area?

Tierra Pines Center has a walk score of 63. Moderately walkable. Some errands can be accomplished on foot, with a mix of nearby amenities.

What is the occupancy rate at Tierra Pines Center?

Tierra Pines Center's occupancy is 94.8%.

Are there photos of Tierra Pines Center?

Yes — there are 14 photos of Tierra Pines Center in the photo gallery on this page.

What is the address of Tierra Pines Center?

Tierra Pines Center is located at 7380 Ulmerton Rd, Largo, FL 33771.

What is the phone number of Tierra Pines Center?

(727) 535-9833 will put you in contact with the team at Tierra Pines Center.

Is Tierra Pines Center Medicare or Medicaid certified?

Yes — Tierra Pines Center is a CMS-certified provider of Medicare and Medicaid.

Guides for Better Senior Living

Care Cost Calculator: See Prices in Your Area

Nursing Home Data Explorer

Don’t Wait Too Long: 7 Red Flag Signs Your Parent Needs Assisted Living Now

The True Cost of Assisted Living in 2025 – And How Families Are Paying For It

Understanding Senior Living Costs: Pricing Models, Discounts & Financial Assistance