Pinellas Park Post-Acute and Rehabilitation Center
Nursing Home, Hospice Care, Memory Care, Palliative Care & Respite Care · Pinellas Park, FL
CMS overall rating Info CMS (the Centers for Medicare & Medicaid Services) is the federal agency that rates nursing home quality. Its Overall Rating runs from 1 to 5 stars, combining health inspections, staffing, and quality measures, with inspections weighted most heavily.

Pinellas Park Post-Acute and Rehabilitation Center

Nursing Home, Hospice Care, Memory Care, Palliative Care & Respite Care · Pinellas Park, FL
CMS overall rating Info CMS (the Centers for Medicare & Medicaid Services) is the federal agency that rates nursing home quality. Its Overall Rating runs from 1 to 5 stars, combining health inspections, staffing, and quality measures, with inspections weighted most heavily.
Calculator: See prices in your area
Pinellas Park Post-Acute and Rehabilitation Center accepts Medicare, Medicaid, and private pay.

Overview of Pinellas Park Post-Acute and Rehabilitation Center

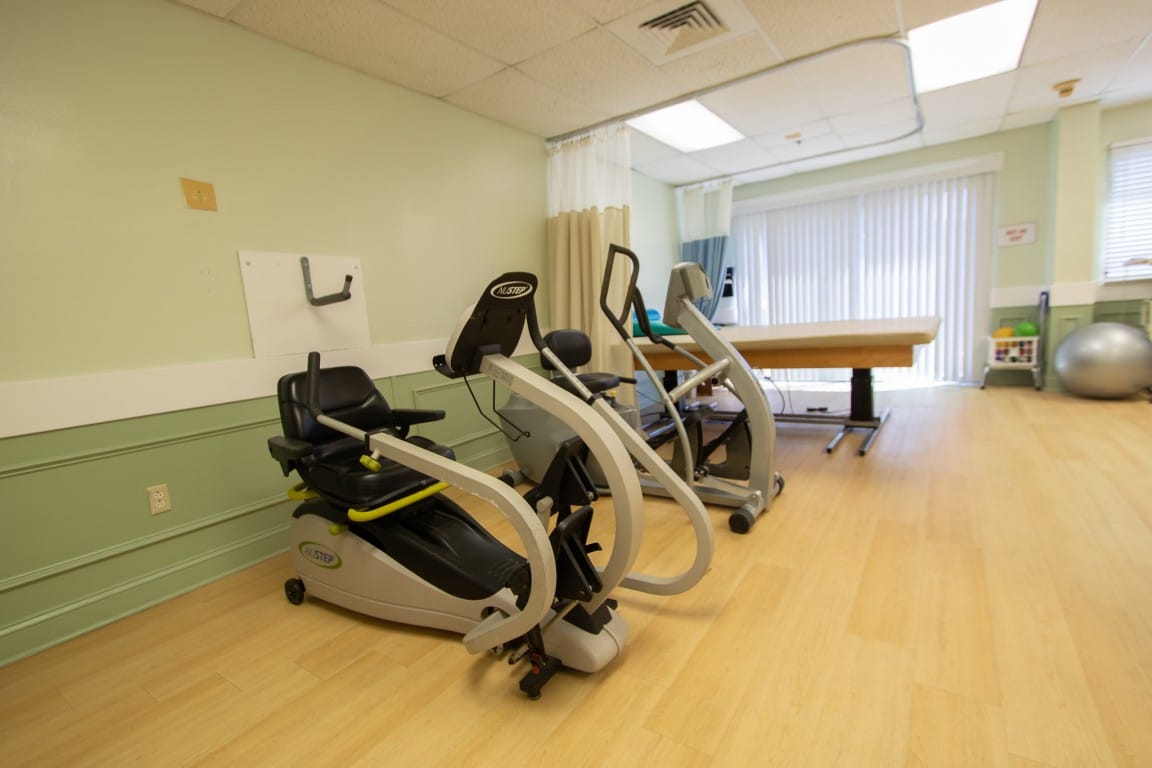
Find the care you need with Pinellas Park Post-Acute and Rehabilitation Center, a trusted community located in Pinellas Park, FL, that offers skilled nursing and rehabilitation. The community provides comprehensive care, including cardiac care, memory care, stroke recovery, respiratory care, palliative care, and therapy, ensuring residents meet their unique needs and preferences. Promoting a cozy and nurturing environment, the community ensures residents feel at ease and live their golden years to the fullest.

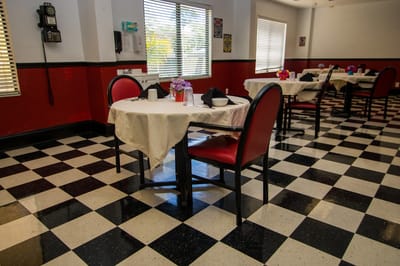
The community utilizes a holistic approach to enhance residents’ living experiences. Working closely with acute care providers, residents can rest assured of receiving the right care according to their needs. Dietary programs are also available to meet residents’ nutritional needs and preferences. The community is ideal for those seeking a wide range of care to recover and to spend their golden years.

Quality ratings

Measured by Centers for Medicare & Medicaid Services (CMS)

Overall rating Info The Overall CMS Rating combines results from health inspections, staffing levels and quality measures. Health inspections carry the most weight. Staffing and quality scores can increase or decrease the final rating based on performance compared to state and national standards.
▼ 68.5% Below FL avg. ▼ 68.5% Below FL avg.FL average: 3.2Click the badge to see the full State ranking.Click here to see the full State ranking.
Health Inspection Info Based on the results of the facility's three most recent standard inspections and any complaint investigations. CMS reviews the number, scope, and severity of deficiencies, with more recent findings weighted more heavily.
▼ 64.4% Below FL avg. ▼ 64.4% Below FL avg.FL average: 2.8Click the badge to see the full State ranking.Click here to see the full State ranking.
Quality Measures Info Based on clinical and physical health indicators reported to CMS, such as hospital readmissions, falls, pressure ulcers, and improvements in mobility. These measures reflect how well residents' health needs are being managed.
▼ 26.1% Below FL avg. ▼ 26.1% Below FL avg.FL average: 4.1Click the badge to see the full State ranking.Click here to see the full State ranking.

Capacity and availability

This home usually has limited availability

Higher occupancy than the Florida average: 84.3%
Occupancy rate
90.4% Rank #111 / 258Occupancy rate — State benchmarkedThis home is ranked 111th out of 258 homes in Florida. Shows this facility's occupancy rate versus the Florida average, with its Statewide rank out of 258. Higher occupancy signals strong local demand and financial stability.Rankings are based only on facilities in Florida that report data for that category. Facilities without available data are excluded from the ranking.Click the rank badge to see the full State ranking.Click here to see the full State ranking.
Avg. Length of Stay
101 days
Bed community size
120-bed community Rank #256 / 1074Bed count — State benchmarkedThis home is ranked 256th out of 1074 homes in Florida. Shows this facility's certified or reported bed count compared to other Florida facilities. Larger communities may offer more amenities, programs, and on-site services for residents and families.Rankings are based only on facilities in Florida that report data for that category. Facilities without available data are excluded from the ranking.Click the rank badge to see the full State ranking.Click here to see the full State ranking.
A larger shared setting that may offer more common spaces and organized community services.
Walk Score
Walk Score: 74 / 100 Rank #165 / 1486Walk Score — State benchmarkedThis home is ranked 165th out of 1486 homes in Florida. Shows how walkable this facility's neighborhood is compared to the average Walk Score across Florida facilities. Higher scores benefit residents, families, and staff.Rankings are based only on facilities in Florida that report data for that category. Facilities without available data are excluded from the ranking.Click the rank badge to see the full State ranking.Click here to see the full State ranking.
Very walkable. Most errands can be accomplished on foot, and many essentials are within a short walk.

Therapy & Rehabilitation

2 services
Rehabilitation Services
Short-Term Rehab

Amenities & Lifestyle

Specific ProgramsShort-Term Stays, Long-Term Stays
Touring HoursMonday-Friday, 9am-5pm

Contact Pinellas Park Post-Acute and Rehabilitation Center

Staffing Data

Reporting period: October 1 – December 31, 2025 (Q4 2025). Source: CMS Payroll-Based Journal report.

Total staff 177
Employees 144
Contractors 33
Staff to resident ratio 1.59 : 1
8% more staff per resident than Florida average
Florida average ratio: 1.47 : 1 Florida average ratio: 1.47 : 1See full Florida ranking
Avg staff/day 54
Average shift 8.1 hours
0% compared with Florida average
Florida average: 7.9 hours Florida average shift: 7.9 hoursSee full Florida ranking
Total staff hours (quarter) 40,215

Nursing staff breakdown

Q4 2025 · Oct 1 – Dec 31 More info This data comes from the CMS Payroll-Based Journal report covering October 1 – December 31, 2025.
Registered Nurse

Manages medical care and health needs.

RN Staff Info All 13 RN Staff are full-time employees. No contractors work on this role. 13
Average shift length Info Average shift length. Calculated as total hours divided by days worked and average staff per day. 8.8 hours
Licensed Practical Nurse

Assists with medical care and medications.

LPN Staff Info 58 total: 25 full-time employees and 33 contractors. 58
Average shift length Info Average shift length. Calculated as total hours divided by days worked and average staff per day. 8.9 hours
Certified Nursing Assistant

Helps with daily care and mobility.

CNA Staff Info All 55 CNA Staff are full-time employees. No contractors work on this role. 55
Average shift length Info Average shift length. Calculated as total hours divided by days worked and average staff per day. 7.9 hours

Contractor staffing

Q4 2025 · Oct 1 – Dec 31 More info This data comes from the CMS Payroll-Based Journal report covering October 1 – December 31, 2025.

Total hours from contractors

1.5%

614 contractor hours this quarter

Licensed Practical Nurse: 33

Staff by category

Q4 2025 · Oct 1 – Dec 31 More info This data comes from the CMS Payroll-Based Journal report covering October 1 – December 31, 2025.
Certified Nursing Assistant5505517,42892100%7.9
Licensed Practical Nurse2533588,46492100%8.9
Physical Therapist8082,95292100%7.6
Registered Nurse130132,0068693%8.8
Occupational Therapy Aide8081,72592100%8.8
Dietitian8081,3819098%7.8
Speech Language Pathologist6061,0066773%7.5
Physical Therapy Assistant3039537076%7.8
Physical Therapy Aide3039096672%7.5
Nurse Practitioner1015286672%8
Respiratory Therapy Technician3035066368%7.6
Clinical Nurse Specialist2024885762%8
Administrator2024806065%8
RN Director of Nursing1014806065%8
Mental Health Service Worker2024645762%8
Qualified Social Worker4044456166%7.2
55 Certified Nursing Assistant
% of Days 100%
58 Licensed Practical Nurse
% of Days 100%
8 Physical Therapist
% of Days 100%
13 Registered Nurse
% of Days 93%
8 Occupational Therapy Aide
% of Days 100%
8 Dietitian
% of Days 98%
6 Speech Language Pathologist
% of Days 73%
3 Physical Therapy Assistant
% of Days 76%
3 Physical Therapy Aide
% of Days 72%
1 Nurse Practitioner
% of Days 72%
3 Respiratory Therapy Technician
% of Days 68%
2 Clinical Nurse Specialist
% of Days 62%
2 Administrator
% of Days 65%
1 RN Director of Nursing
% of Days 65%
2 Mental Health Service Worker
% of Days 62%
4 Qualified Social Worker
% of Days 66%

Penalties and fines

Includes penalties issued in 2023

Federal penalties imposed by CMS for regulatory violations, including civil money penalties (fines) and denials of payment for new Medicare/Medicaid admissions.

Source: CMS Penalties Database (Data as of Jan 2026)

Total fines amount $20K Rank #201 / 258Federal fines — State benchmarkedThis home is ranked 201st out of 258 homes in Florida. Shows this facility's cumulative CMS federal fine dollars versus the Florida average among facilities with fines, and where it ranks among 258 facilities in the pool. Lower total dollars mean a better rank.Rankings are based only on facilities in Florida that report data for that category. Facilities without available data are excluded from the ranking.Click the rank badge to see the full State ranking.Click here to see the full State ranking.
73% lower than Florida average

Florida average: $72K

Number of fines 1
62% fewer fines than Florida average

Florida average: 2.6

Payment Denials Info Serious action where Medicare and/or Medicaid temporarily stops payments for new residents until issues are fixed. 0
100% fewer payment denials than Florida average

Florida average: 0.1

Fines amount comparison
This facility $20K
Florida average $72K
Penalty History

Penalties are imposed by CMS for violations of federal nursing home regulations.

1 penalty in the past 3 years

Sep 29, 2023 · $20K

Civil Money Penalty Info Fines imposed for noncompliance, which can be assessed per day or per instance of violation. Sep 29, 2023
$20K

Last updated: Jan 2026

Quality of care over time

These measures show how residents usually do over time at this home, based on health outcomes and preventive care.

High-risk clinical events score Info A composite score based on pressure ulcers, falls with injury, weight loss, walking ability decline, and activities of daily living decline. 8.3
12% worse than Florida average

Florida average: 7.4

Functional decline score Info A composite score based on activities of daily living decline, walking ability decline, and incontinence. 12.4
In line with Florida average

Florida average: 12.4

Long-stay resident measures
Significantly above average Florida avg: 4.5 Info CMS star rating based on long-stay quality measure performance. 5 stars = significantly above average, 1 star = significantly below average.
Need for Help with Daily Activities Increased Info Percent of long-stay residents whose need for help with daily activities has increased 11.7%
11% worse than Florida average

Florida average: 10.5%

Walking Ability Worsened Info Percent of long-stay residents whose ability to move independently worsened 8.5%
35% better than Florida average

Florida average: 12.9%

Low Risk Residents with Bowel/Bladder Incontinence Info Percent of low risk long-stay residents who lose control of their bowels or bladder 17.0%
26% worse than Florida average

Florida average: 13.5%

Falls with Major Injury Info Percent of long-stay residents experiencing one or more falls with major injury 2.5%
7% better than Florida average

Florida average: 2.6%

High Risk Residents with Pressure Ulcers Info Percent of long-stay high risk residents with pressure ulcers 7.9%
47% worse than Florida average

Florida average: 5.4%

Urinary Tract Infection Info Percent of long-stay residents with a urinary tract infection 0.9%
In line with Florida average

Florida average: 0.9%

Lost Too Much Weight Info Percent of long-stay residents who lose too much weight 11.0%
84% worse than Florida average

Florida average: 6.0%

Depressive Symptoms Info Percent of long-stay residents who have depressive symptoms 0.0%
100% better than Florida average

Florida average: 3.3%

Antipsychotic Use Info Percent of long-stay residents who received an antipsychotic medication 4.1%
48% better than Florida average

Florida average: 8.0%

Pneumococcal Vaccine Info Percent of long-stay residents assessed and appropriately given the pneumococcal vaccine 99.7%
In line with Florida average

Florida average: 97.7%

Influenza Vaccine Info Percent of long-stay residents assessed and appropriately given the seasonal influenza vaccine 100.0%
In line with Florida average

Florida average: 99.2%

Hospitalizations per 1,000 days Info Number of hospitalizations per 1,000 long-stay resident days. 2.61
24% worse than Florida average

Florida average: 2.10

ED visits per 1,000 days Info Number of outpatient emergency department visits per 1,000 long-stay resident days. 1.24
5% worse than Florida average

Florida average: 1.18

Short-stay resident measures
Significantly below average Florida avg: 3.1 Info CMS star rating based on short-stay quality measure performance. 5 stars = much above average, 1 star = much below average.
Pneumococcal Vaccine Info Percent of short-stay residents assessed and appropriately given the pneumococcal vaccine 99.7%
6% better than Florida average

Florida average: 94.0%

Antipsychotic medication increase Info Percent of short-stay residents who newly received an antipsychotic medication 1.6%
6% worse than Florida average

Florida average: 1.5%

Influenza Vaccine Info Percent of short-stay residents assessed and appropriately given the seasonal influenza vaccine 96.9%
In line with Florida average

Florida average: 94.7%

Re-hospitalized after SNF stay Info Percentage of short-stay residents who were re-hospitalized after their nursing home admission. 31.0%
18% worse than Florida average

Florida average: 26.2%

Emergency department visits Info Percentage of short-stay residents who had an outpatient emergency department visit. 10.6%
14% worse than Florida average

Florida average: 9.3%

Falls with major injury Info Percentage of SNF residents who experience falls with major injury during their stay. 1.0%
26% worse than Florida average

Florida average: 0.8%

Ability to care for self at discharge Info Percentage of residents at or above expected ability to care for themselves at discharge. 42.4%
21% worse than Florida average

Florida average: 53.7%

Successful return to home or community Info Rate of successful return to home or community from a skilled nursing facility. 34.0%
33% worse than Florida average

Florida average: 50.6%

Breakdown by payment type

Medicare

30% of new residents, usually for short-term rehab.

Typical stay 1 - 2 months

Private pay

40% of new residents, often for short stays.

Typical stay 1 - 2 months

Medicaid

30% of new residents, often for long-term daily care.

Typical stay 8 - 9 months

Facility Characteristics

Source: CMS Long-Term Care Facility Characteristics (Data as of Jan 2026)

Total residents 111
Medicare
9
8.1% of residents
Medicaid
83
74.8% of residents
Private pay or other
19
17.1% of residents
Programs & Services
Residents Group

Residents meet regularly to discuss policies, care quality, and activities

Active Resident Council

Organized group of residents that meets regularly to discuss facility policies, quality of life, and activities.

Finances and operations

Based on CMS SNF Cost Report for fiscal year ending in 12/2023.

For-profit
Corporation
Net patient revenue Info Net patient revenue — what the home actually collects for resident care, after contractual allowances, bad debt and discounts are subtracted from its gross charges (CMS cost report, Worksheet G-3). It covers resident care only; money the home earns from other sources is shown separately as "Other income."
$12.5M
Net patient income Info Net patient income: net patient revenue minus the home's total operating expenses. A positive figure means it earns more from resident care than it spends to deliver it; a negative figure means the opposite. It excludes non-operating "other income."
-$1.1M
For-profit Corporation
Net patient revenue Info Net patient revenue — what the home actually collects for resident care, after contractual allowances, bad debt and discounts are subtracted from its gross charges (CMS cost report, Worksheet G-3). It covers resident care only; money the home earns from other sources is shown separately as "Other income."
$12.5M Rank #156 / 257Revenue — State benchmarkedThis home is ranked 156th out of 257 homes in Florida. Shows this facility's annual revenue compared to the Florida average. Higher revenue generally means more resources for staffing and capital — read alongside Payroll %.Rankings are based only on facilities in Florida that report data for that category. Facilities without available data are excluded from the ranking.Click the rank badge to see the full State ranking.Click here to see the full State ranking.
Net patient income Info Net patient income: net patient revenue minus the home's total operating expenses. A positive figure means it earns more from resident care than it spends to deliver it; a negative figure means the opposite. It excludes non-operating "other income."
-$1.1M
Other income Info Money the home earns outside of resident care — such as investments, grants, rentals and other non-operating sources (CMS cost report, Worksheet G-3). It is tracked separately from net patient revenue: it is not part of that figure, and it is not included in net patient income.
-$271.5K
Payroll costs Info Staff salaries plus wage-related costs — benefits such as payroll taxes, health insurance and retirement — from the home's own accounting records (CMS cost report, Worksheet A). Contract or agency labor is counted separately, under other operating costs. Rank #134 / 257Payroll — State benchmarkedThis home is ranked 134th out of 257 homes in Florida. Shows total annual staff payroll benchmarked to the Florida average. Higher payroll investment relative to peers often signals better staffing and less reliance on cheaper contract labor.Rankings are based only on facilities in Florida that report data for that category. Facilities without available data are excluded from the ranking.Click the rank badge to see the full State ranking.Click here to see the full State ranking.
$6.4M 51.1% of net patient revenue Info Payroll as a share of revenue: staff salaries and wage-related benefits divided by net patient revenue. A higher figure means more of each revenue dollar goes to staff pay. Rank #88 / 257Payroll % — State benchmarkedThis home is ranked 88th out of 257 homes in Florida. Shows payroll as a percentage of revenue versus the Florida average. Well-run Florida facilities typically land around 49–56% — the top third Statewide. Below 25% may signal understaffing or heavy agency use — read with Staffing ratings.Rankings are based only on facilities in Florida that report data for that category. Facilities without available data are excluded from the ranking.Click the rank badge to see the full State ranking.Click here to see the full State ranking.
Other operating costs Info Everything it costs to run the home apart from payroll — food, utilities, supplies, maintenance, contract labor and administration. Calculated as total operating expense minus payroll (staff salaries and wage-related benefits).
$7.2M
Total costs Info The home's total operating expense for the year — all the costs of running it, salaries included (CMS cost report, Worksheet G-3).
$13.6M

What does this home offer?

Housing options icon

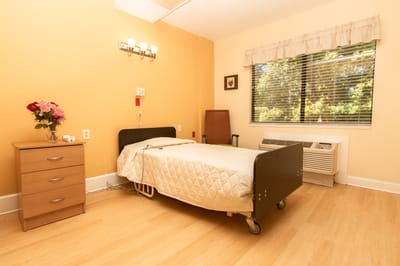
Housing Options: Private Rooms

Building type icon
Building type icon

Building Type: 2-story

Recreational activities icon

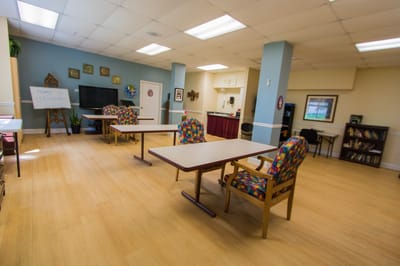
Recreational Activities

Exercise program icon

Exercise Programs

Who this home usually serves

TYPE OF STAY

Mix of rehab and long-term care

This home supports both short-term rehab and long-term care, with residents staying for a wide range of durations.

New residents most often arrive under private pay (40% of admissions), and a typical private pay stay runs around 1 - 2 months.

Admissions
388 total

Coverage residents most often arrive under.

Medicare 30%
Private pay 40%
Medicaid 30%
Discharges
393 total

Coverage residents most often leave under.

Medicare 22%
Private pay 33%
Medicaid 45%

Places of interest near Pinellas Park Post-Acute and Rehabilitation Center

Address 0.7 miles from city center Info Estimated distance in miles from Pinellas Park's city center to Pinellas Park Post-Acute and Rehabilitation Center's address, calculated via Google Maps.

Calculate Travel Distance to Pinellas Park Post-Acute and Rehabilitation Center

Add your location

Address

Compare Nursing Homes around Pinellas County

The information below is reported by the Florida Agency for Health Care Administration (AHCA).

5 facilities compared · CMS & FL Dept. of Health data

Oak Manor Senior Living Community
NH
AL
IL
Largo (Anona)
150
Facility 150
FL AVG 89
Rank #135 / 1074
69.6%
Facility 69.6%
FL AVG 84.3%
Rank #226 / 258
-17%
3.63
Facility 3.63
FL AVG 4.04
Rank #198 / 253
-37%-10%
$4.0k
Facility $4.0k
FL AVG $78.9k
Rank #161 / 258
73
Facility 73
FL AVG 83
Rank #692 / 876
13
Facility 13
FL AVG 19.7
Rank #73 / 252
2.2
Facility 2.2
FL AVG 4.5
Rank #28 / 252
-131-
19
Facility 19
FL AVG 40
Rank #1109 / 1486
Brad Graham
$14.3M
Facility $14.3M
FL AVG $15.7M
Rank #152 / 257
$6.9M
Facility $6.9M
FL AVG $6.1M
Rank #136 / 257
48%
Facility 48%
FL AVG 39.8%
Rank #104 / 257
105248
Tierra Pines Center
NH
PC
RC
Largo (Monterey Lakes Apartments)
120
Facility 120
FL AVG 89
Rank #256 / 1074
94.8%
Facility 94.8%
FL AVG 84.3%
Rank #31 / 258
+12%
3.72
Facility 3.72
FL AVG 4.04
Rank #175 / 253
-32%-8%
$4.1k
Facility $4.1k
FL AVG $78.9k
Rank #162 / 258
-
20
Facility 20
FL AVG 19.7
Rank #142 / 252
4.0
Facility 4.0
FL AVG 4.5
Rank #112 / 252
-113A+
63
Facility 63
FL AVG 40
Rank #309 / 1486
Theresa Felicione
$12.9M
Facility $12.9M
FL AVG $15.7M
Rank #195 / 257
$6.5M
Facility $6.5M
FL AVG $6.1M
Rank #167 / 257
50.2%
Facility 50.2%
FL AVG 39.8%
Rank #40 / 257
105398
Gateway Post-Acute Care Center
NH
NC
Pinellas Park
120
Facility 120
FL AVG 89
Rank #256 / 1074
92.7%
Facility 92.7%
FL AVG 84.3%
Rank #71 / 258
+10%- -21%-
$0
Facility $0
FL AVG $78.9k
Rank #1 / 258
-
28
Facility 28
FL AVG 19.7
Rank #198 / 252
4.7
Facility 4.7
FL AVG 4.5
Rank #150 / 252
-105A+
47
Facility 47
FL AVG 40
Rank #570 / 1486
Ivana Kirby
$12.4M
Facility $12.4M
FL AVG $15.7M
Rank #135 / 257
$6.8M
Facility $6.8M
FL AVG $6.1M
Rank #156 / 257
54.7%
Facility 54.7%
FL AVG 39.8%
Rank #160 / 257
105486
The Barclay at Pasadena
NH
AL
IL
MC
South Pasadena
175
Facility 175
FL AVG 89
Rank #84 / 1074
78.4%
Facility 78.4%
FL AVG 84.3%
Rank #196 / 258
-7%- - --
$79.8k
Facility $79.8k
FL AVG $78.9k
Rank #229 / 258
70
Facility 70
FL AVG 83
Rank #735 / 876
27
Facility 27
FL AVG 19.7
Rank #190 / 252
6.8
Facility 6.8
FL AVG 4.5
Rank #215 / 252
---
70
Facility 70
FL AVG 40
Rank #211 / 1486
Shore Parent LLC
$1.6M
Facility $1.6M
FL AVG $15.7M
Rank #242 / 257
$917.3k
Facility $917.3k
FL AVG $6.1M
Rank #253 / 257
56.9%
Facility 56.9%
FL AVG 39.8%
Rank #227 / 257
105012
Pinellas Park Post-Acute and Rehabilitation Center
NH
HC
MC
PC
RC
Pinellas Park
120
Facility 120
FL AVG 89
Rank #256 / 1074
90.4%
Facility 90.4%
FL AVG 84.3%
Rank #111 / 258
+7%- - -40%-
$19.7k
Facility $19.7k
FL AVG $78.9k
Rank #201 / 258
-
21
Facility 21
FL AVG 19.7
Rank #149 / 252
4.2
Facility 4.2
FL AVG 4.5
Rank #127 / 252
2--
74
Facility 74
FL AVG 40
Rank #165 / 1486
David Mcmillon
$12.5M
Facility $12.5M
FL AVG $15.7M
Rank #156 / 257
$6.4M
Facility $6.4M
FL AVG $6.1M
Rank #134 / 257
51.1%
Facility 51.1%
FL AVG 39.8%
Rank #88 / 257
105422

Financial Assistance for
Nursing Home in Florida

Pinellas Park Post-Acute and Rehabilitation Center is located in Pinellas Park, Florida.
Here are the financial assistance programs available to residents in Florida.

Get Financial aid guidance

Long-Term Care Waiver

Florida Medicaid LTC Waiver

Age 65+ or 21+ disabled
General Florida resident, Medicaid- eligible, nursing home-level care need.
Income Limits (2025) ~$2,829/month 300% FBR, individual
Asset Limits $2,000 (individual), $3,000 (couple).
FL

High demand; waitlists common.

Benefits
In-home care (6-8 hours/day) Assisted living Respite (240 hours/year) Case management

Community Care for the Elderly (CCE)

Florida CCE

Age 60+
General Florida resident, at risk of nursing home.
Income Limits ~$2,000/month varies
Asset Limits $5,000 individual
FL

Limited funding; regional variation.

Benefits
Homemaker services (3-5 hours/week) Adult day care (~$60/day) Respite (up to 10 days/year)

Home Care for the Elderly (HCE)

Florida Home Care for the Elderly

Age 60+
General Florida resident, at risk of nursing home placement; caregiver must be approved.
Income Limits (2025) ~$2,829/month individual, aligned with Medicaid thresholds
Asset Limits ~$2,000 (individual); varies by case manager discretion.
FL

Limited funding (~3,500 served annually); prioritizes low-income frail seniors.

Benefits
Basic subsidy (~$160/month) for housing/medical costs; special subsidies for supplies/services (e.g., incontinence supplies, ~$50-$200/month)

Program of All-Inclusive Care for the Elderly (PACE)

Florida Medicaid PACE

Age 55+
General Florida resident, nursing home-level care need, safe with PACE support.
Income Limits (2025) ~$2,829/month 300% FBR
Asset Limits $2,000 (individual), $3,000 (couple).
FL

Limited to specific counties (e.g., Hillsborough, Miami-Dade); ~10 sites statewide.

Benefits
Personal care (5-7 hours/day) Medical care Meals Transportation Therapy

Optional State Supplementation (OSS)

Florida Optional State Supplementation

Age 65+ or disabled
General Florida resident, living in approved facility, receiving SSI or low-income.
Income Limits (2025) ~$1,004/month individual, including SSI
Asset Limits $2,000 (individual), $3,000 (couple).
FL

Limited to specific facility types; ~$78.40/month max supplement.

Benefits
Cash payment (~$78.40/month) for room/board or personal needs in facilities

Frequently Asked Questions about Pinellas Park Post-Acute and Rehabilitation Center

What neighborhood is Pinellas Park Post-Acute and Rehabilitation Center in?

Pinellas Park Post-Acute and Rehabilitation Center is in the Pinellas Park neighborhood.

Is Pinellas Park Post-Acute and Rehabilitation Center in a walkable area?

Pinellas Park Post-Acute and Rehabilitation Center has a walk score of 74. Very walkable. Most errands can be accomplished on foot, and many essentials are within a short walk.

What is the occupancy rate at Pinellas Park Post-Acute and Rehabilitation Center?

Pinellas Park Post-Acute and Rehabilitation Center's occupancy is 90.4%.

Does Pinellas Park Post-Acute and Rehabilitation Center operate as a for-profit or non-profit?

Pinellas Park Post-Acute and Rehabilitation Center is registered as a for-profit.

Are there photos of Pinellas Park Post-Acute and Rehabilitation Center?

Yes — there are 5 photos of Pinellas Park Post-Acute and Rehabilitation Center in the photo gallery on this page.

What is the address of Pinellas Park Post-Acute and Rehabilitation Center?

Pinellas Park Post-Acute and Rehabilitation Center is located at 8701 49Th St N, Pinellas Park, FL 33782.

What is the phone number of Pinellas Park Post-Acute and Rehabilitation Center?

(727) 546-4661 will put you in contact with the team at Pinellas Park Post-Acute and Rehabilitation Center.

Guides for Better Senior Living

Care Cost Calculator: See Prices in Your Area

Nursing Home Data Explorer

Don’t Wait Too Long: 7 Red Flag Signs Your Parent Needs Assisted Living Now

The True Cost of Assisted Living in 2025 – And How Families Are Paying For It

Understanding Senior Living Costs: Pricing Models, Discounts & Financial Assistance