

Total staff
166
Employees
164
Contractors
2

We arrange tours, appointments, and even moving support so you don’t have to
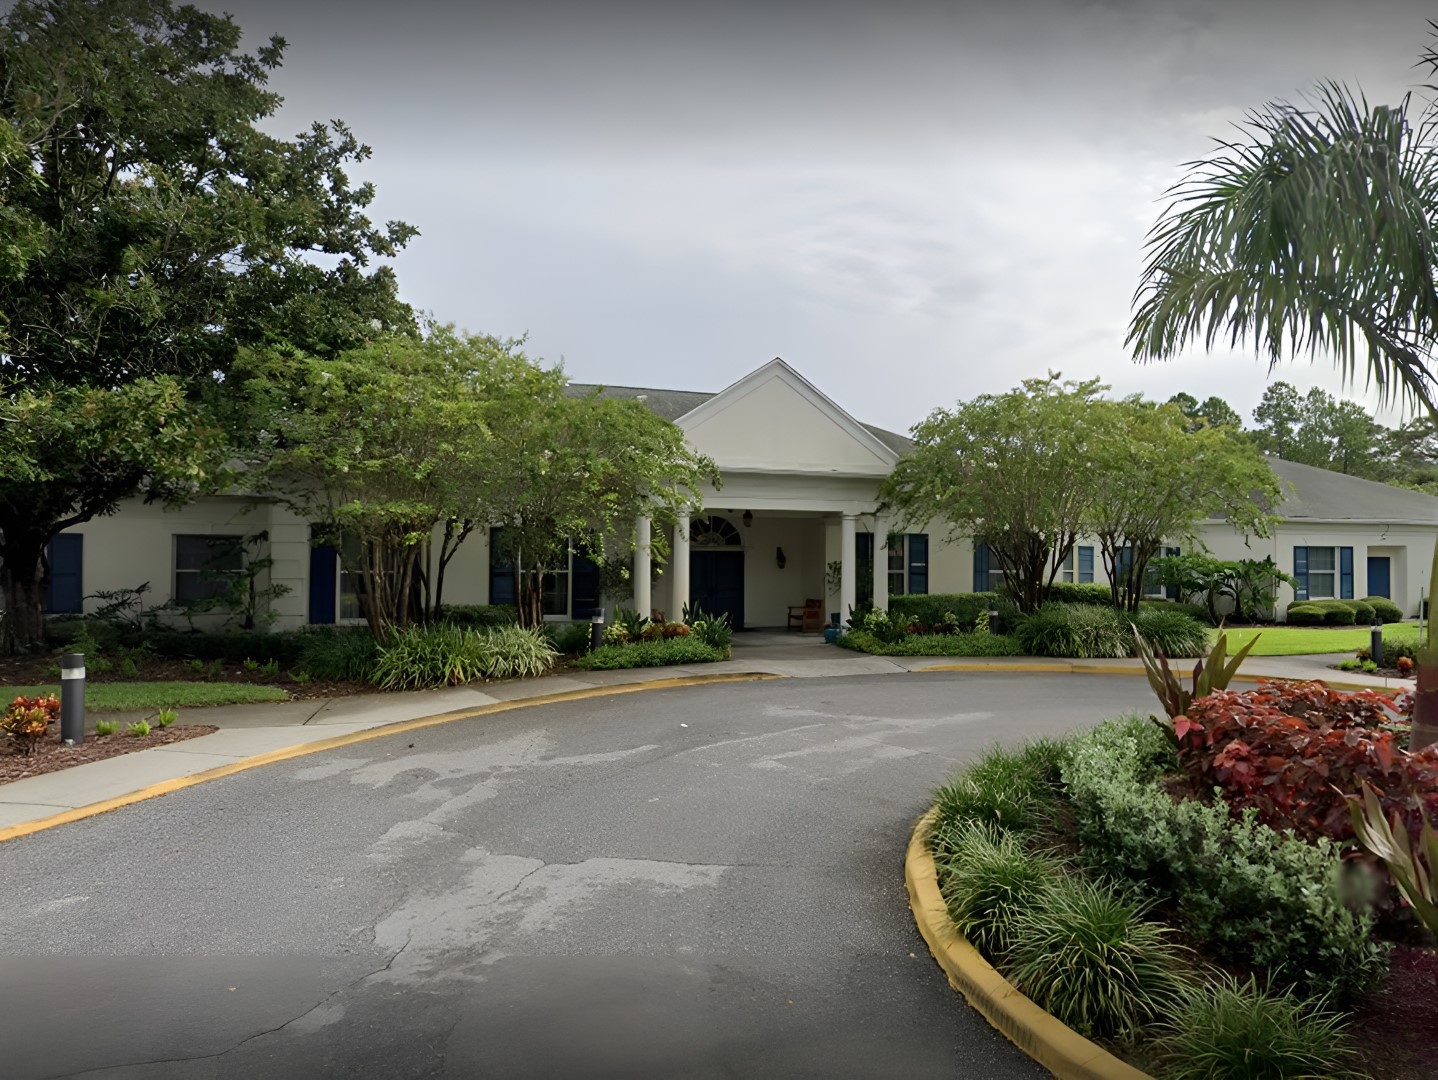


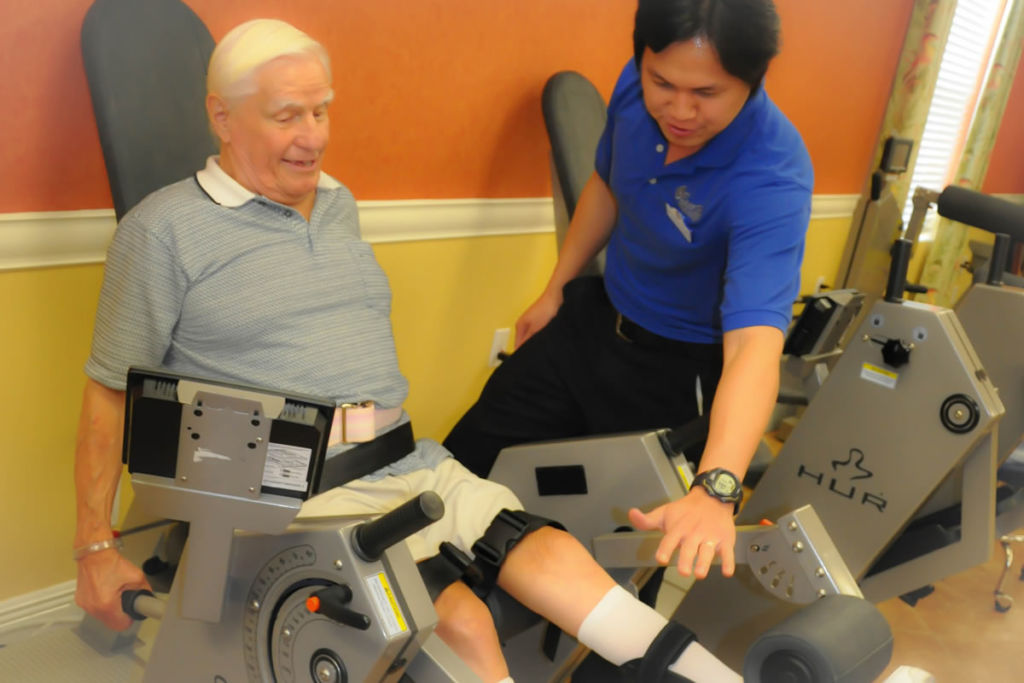
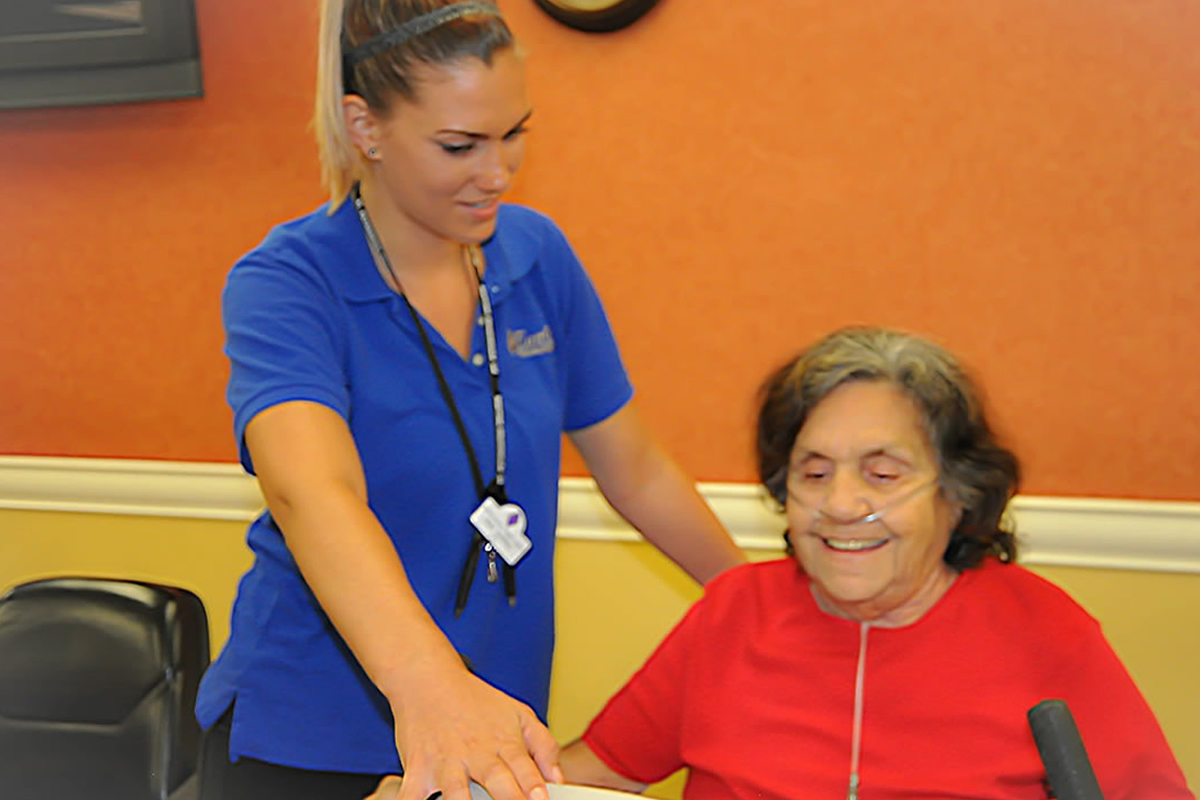
Surrounded by convenient local amenities in the thriving neighborhood of East Bay Drive, Clearwater, FL, East Bay Rehabilitation Center is a distinguished community that offers therapy, skilled nursing, and specialized care. Alongside comprehensive care options, round-the-clock assistance is provided to meet residents’ healthcare needs. Residents experience comfort and safety with the community’s luxurious and spacious accommodations.
Dedicated to enhancing residents’ living experiences, the community offers outpatient therapy to ensure a worry-free recovery. Medicare and Medicaid are accepted in the community, helping residents with their financial burdens. The community’s cozy and nurturing environment makes it an ideal option for those seeking top-notch care to live comfortably in their golden years. Proving its trusted and exceptional quality, the community is a Medicare and Medicaid five-star community and has received the Governor’s Gold Seal.
| Staff type | Hours / Day / Resident | vs state avg |
|---|---|---|
|
Registered Nurse (RN)
| 32m per day | ▼ 27% State avg: 44m per day · National avg: 41m per day |
|
LPN / LVN
| 49m per day | ▲ 4% State avg: 47m per day · National avg: 52m per day |
|
Nurse Aide
| 2h 41m per day | ▲ 15% State avg: 2h 20m per day · National avg: 2h 21m per day |
|
Weekend Total Nursing
| 3h 25m per day | ▼ 3% State avg: 3h 31m per day · National avg: 3h 26m per day |
|
Physical Therapist
| 6m per day | ▲ 20% State avg: 5m per day · National avg: 4m per day |
|
Weekend RN
| 22m per day | ▼ 31% State avg: 32m per day · National avg: 29m per day |
Reporting period: October 1 – December 31, 2025 (Q4 2025). Source: CMS Payroll-Based Journal report.
Manages medical care and health needs.
No contractors work on this role.
Assists with medical care and medications.
No contractors work on this role.
Helps with daily care and mobility.
No contractors work on this role.
Total hours from contractors
34 contractor hours this quarter
| Certified Nursing Assistant | 93 | 0 | 93 | 26,164 | 92 | 100% | 8 |
| Licensed Practical Nurse | 27 | 0 | 27 | 6,340 | 92 | 100% | 8.4 |
| Registered Nurse | 11 | 0 | 11 | 3,525 | 92 | 100% | 8.2 |
| RN Director of Nursing | 4 | 0 | 4 | 1,775 | 67 | 73% | 8 |
| Clinical Nurse Specialist | 6 | 1 | 7 | 1,670 | 92 | 100% | 7.7 |
| Qualified Social Worker | 5 | 0 | 5 | 1,329 | 72 | 78% | 7 |
| Speech Language Pathologist | 5 | 0 | 5 | 1,153 | 82 | 89% | 7.5 |
| Physical Therapy Aide | 3 | 0 | 3 | 1,096 | 74 | 80% | 7.9 |
| Respiratory Therapy Technician | 2 | 0 | 2 | 977 | 66 | 72% | 7.8 |
| Physical Therapy Assistant | 3 | 0 | 3 | 521 | 65 | 71% | 7 |
| Administrator | 1 | 0 | 1 | 512 | 64 | 70% | 8 |
| Nurse Practitioner | 1 | 0 | 1 | 512 | 64 | 70% | 8 |
| Dietitian | 1 | 0 | 1 | 432 | 54 | 59% | 8 |
| Mental Health Service Worker | 1 | 0 | 1 | 424 | 53 | 58% | 8 |
| Dental Services Staff | 1 | 0 | 1 | 72 | 9 | 10% | 8 |
| Medical Director | 0 | 1 | 1 | 21 | 23 | 25% | 0.9 |
Federal penalties imposed by CMS for regulatory violations, including civil money penalties (fines) and denials of payment for new Medicare/Medicaid admissions.
Source: CMS Penalties Database
No penalties in the past 3 years
No civil money penalties or payment denials were reported in the last 3 years.
These measures show how residents usually do over time at this home, based on health outcomes and preventive care.
Florida average: 7.4
Florida average: 12.4
Florida average: 10.5%
Florida average: 12.9%
Florida average: 13.5%
Florida average: 2.6%
Florida average: 5.4%
Florida average: 0.9%
Florida average: 6.0%
Florida average: 3.3%
Florida average: 8.0%
Florida average: 97.7%
Florida average: 99.2%
Florida average: 2.10
Florida average: 1.18
Florida average: 94.0%
Florida average: 1.5%
Florida average: 94.7%
Florida average: 26.2%
Florida average: 9.3%
Florida average: 0.8%
Florida average: 53.7%
Florida average: 50.6%
Quality measures are calculated from Minimum Data Set (MDS) assessments. For most measures, lower percentages indicate better care quality.
50% of new residents, usually for short-term rehab.
47% of new residents, often for short stays.
3% of new residents, often for long-term daily care.
Source: CMS Long-Term Care Facility Characteristics (Data as of Jan 2026)
Residents meet regularly to discuss policies, care quality, and activities
Organized group of residents that meets regularly to discuss facility policies, quality of life, and activities.
Data sourced from CMS Long-Term Care Facility Characteristics quarterly report. Payer mix reflects the current resident census by primary payment source.
Historical financial and operational data for East Bay Rehabilitation Center based on CMS SNF Cost Reports.
Housing Options: Shared Rooms
Building Type: Single-story
Dining Services
Housekeeping Services

Health Programs
Most residents typically stay for a few weeks or months before returning home or moving on.
![]() 6.9 miles from city center
6.9 miles from city center
![]() Estimated distance in miles from Clearwater's city center to East Bay Rehabilitation Center's address, calculated via Google Maps.
Estimated distance in miles from Clearwater's city center to East Bay Rehabilitation Center's address, calculated via Google Maps.
Add your location
East Bay Rehabilitation Center is located in Clearwater, Florida.
Here are the financial assistance programs available to residents in Florida.
The information below is reported by the Florida Agency for Health Care Administration (AHCA).
| East Bay Rehabilitation Center |
NH Nursing Home Licensed facility providing 24/7 skilled nursing care for residents with complex, ongoing medical needs. Staffed by RNs, LPNs, and CNAs. Inspected and star-rated annually by CMS. Accepts Medicare (short-term rehab) and Medicaid (long-term care).
CH Care Homes | Clearwater | 120 | 89.3% | +6% | 4.21 | -45% | +4% | $0 | 13 | 3.3 | - | 114 | - | 13 | - | $14.8M | $8.1M | 54.9% | 105697 | ||||
| Gulf Shore Care Center |
NH Nursing Home Licensed facility providing 24/7 skilled nursing care for residents with complex, ongoing medical needs. Staffed by RNs, LPNs, and CNAs. Inspected and star-rated annually by CMS. Accepts Medicare (short-term rehab) and Medicaid (long-term care). | Pinellas Park | 120 | 94.2% | +12% | 3.23 | -47% | -20% | $0 | 15 | 5.0 | - | 111 | - | 52 | Gulf Shore Nursing Holdco LLC | $11.6M | $3.1M | 26.7% | 105978 | ||||
| Tierra Pines Center |
NH Nursing Home Licensed facility providing 24/7 skilled nursing care for residents with complex, ongoing medical needs. Staffed by RNs, LPNs, and CNAs. Inspected and star-rated annually by CMS. Accepts Medicare (short-term rehab) and Medicaid (long-term care). | Largo (Monterey Lakes Apartments) | 120 | 94.8% | +12% | 3.72 | -32% | -8% | $23.1k | 20 | 4.0 | - | 112 | A+ | 63 | Theresa Felicione | $12.9M | $7.0M | 53.8% | 105398 | ||||
| Pinellas Park Post-Acute and Rehabilitation Center |
NH Nursing Home Licensed facility providing 24/7 skilled nursing care for residents with complex, ongoing medical needs. Staffed by RNs, LPNs, and CNAs. Inspected and star-rated annually by CMS. Accepts Medicare (short-term rehab) and Medicaid (long-term care).
HC Home Care Professional care delivered in the person's own home — from companionship and errands to skilled nursing and therapy. Allows seniors to age in place. Medicare covers skilled home health when medically necessary.
MC Memory Care Secured, specialized care for people living with Alzheimer's or dementia. Staff trained in cognitive impairment, with higher staff-to-resident ratios and an environment designed to reduce confusion and wandering risk. | Pinellas Park | 120 | 90.4% | +7% | - | - | -40% | - | $19.7k | 21 | 4.2 | 2 | - | - | 74 | David Mcmillon | $16.3M | $7.9M | 48.4% | 105422 | |||
| Gateway Post-Acute Care Center |
NH Nursing Home Licensed facility providing 24/7 skilled nursing care for residents with complex, ongoing medical needs. Staffed by RNs, LPNs, and CNAs. Inspected and star-rated annually by CMS. Accepts Medicare (short-term rehab) and Medicaid (long-term care).
HC Home Care Professional care delivered in the person's own home — from companionship and errands to skilled nursing and therapy. Allows seniors to age in place. Medicare covers skilled home health when medically necessary.
MC Memory Care Secured, specialized care for people living with Alzheimer's or dementia. Staff trained in cognitive impairment, with higher staff-to-resident ratios and an environment designed to reduce confusion and wandering risk. | Pinellas Park | 120 | 92.7% | +10% | - | -21% | - | $0 | 28 | 4.7 | - | 105 | A+ | 47 | Ivana Kirby | $17.8M | $7.3M | 41.1% | 105486 |
East Bay Rehabilitation Center has a walk score of 13. Car-dependent. Most errands require a car, with limited nearby walkable options.
East Bay Rehabilitation Center's occupancy is 89.3%.
Yes — there is 1 photo of East Bay Rehabilitation Center in the photo gallery on this page.
East Bay Rehabilitation Center is located at 4470 E Bay Dr, Clearwater, FL 33764.
(727) 530-7100 will put you in contact with the team at East Bay Rehabilitation Center.
Yes — East Bay Rehabilitation Center is a CMS-certified provider of Medicare and Medicaid.
Care Cost Calculator: See Prices in Your Area
Nursing Home Data Explorer
Don’t Wait Too Long: 7 Red Flag Signs Your Parent Needs Assisted Living Now
The True Cost of Assisted Living in 2025 – And How Families Are Paying For It
Understanding Senior Living Costs: Pricing Models, Discounts & Financial Assistance


Thank you for your interest!
Our team will be in touch shortly to help with next steps.
