

Total staff
174
Employees
134
Contractors
40

We arrange tours, appointments, and even moving support so you don’t have to
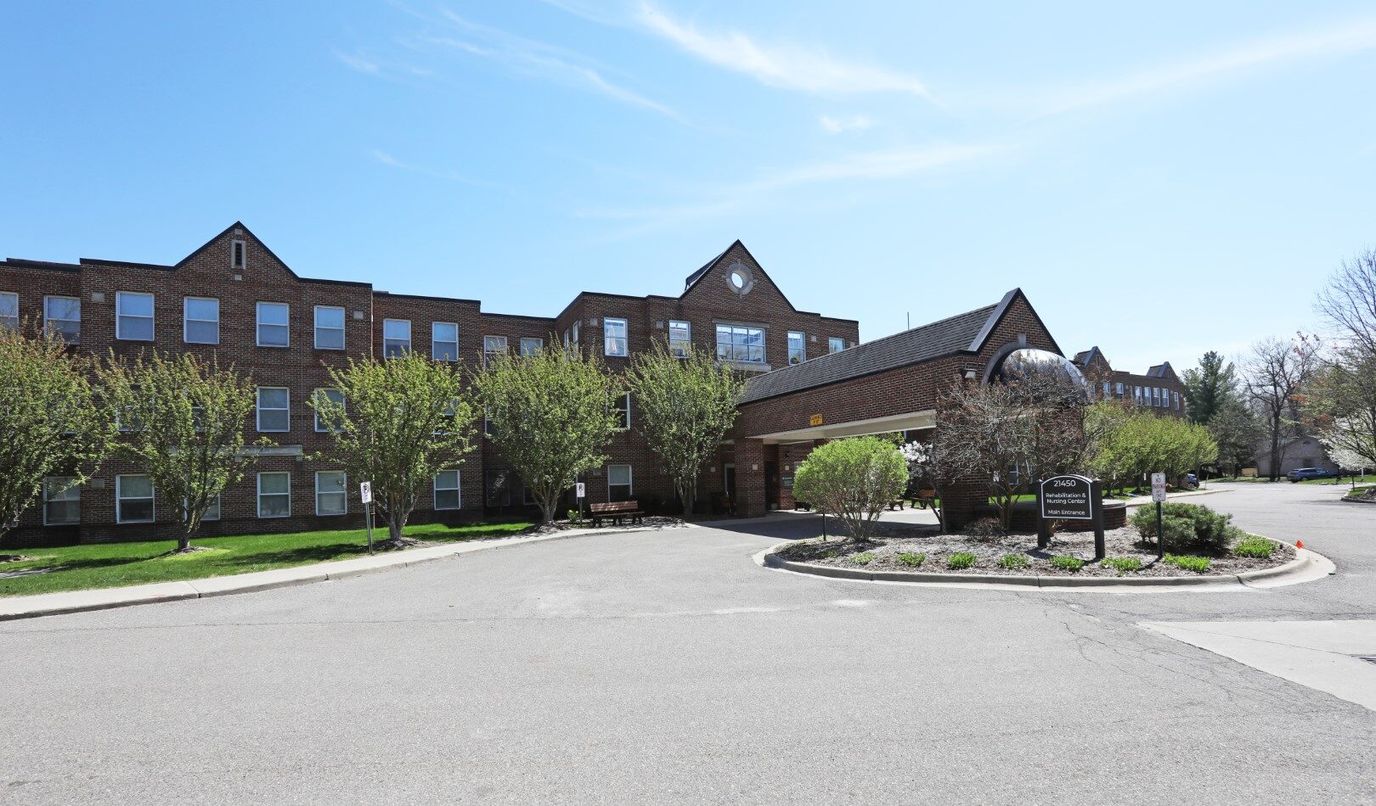
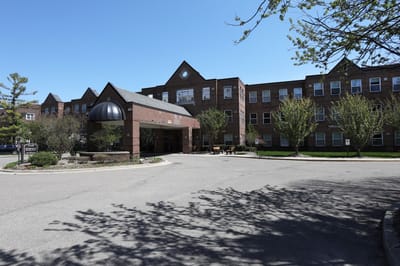
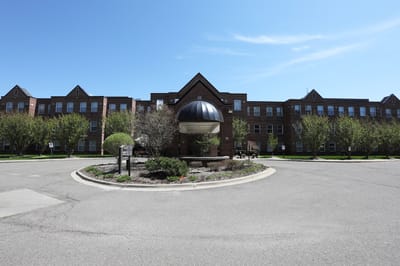
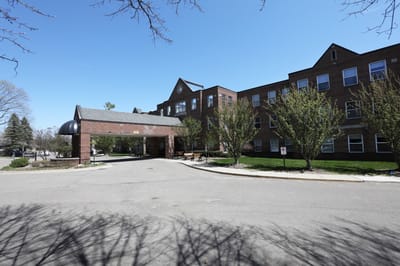
Beaumont Commons – Farmington Hills, located at 21450 Archwood Circle in Farmington Hills, Oakland County, Michigan, is a 179-bed community operated by nonprofit Botsford General Hospital. The 33-acre setting provides independent living, assisted living, and skilled nursing services to a mixed census spanning both short-term Medicare rehabilitation (typical 26-day stay) and long-term Medicaid placements (averaging two years). Medicare and Medicaid certified.
Nursing personnel deliver 4 hours 24 minutes of care per resident daily, marginally above the Michigan average and ranked 38th among 133 state facilities. The nursing roster comprises 20 registered nurses, 38 licensed practical nurses, and 75 certified nursing assistants. A 2.0-to-1 overall staff-to-resident ratio outperforms the Michigan average by 18%, reflecting the nonprofit commitment to direct-care staffing: payroll consumes 78% of revenue, the third-highest proportion in the state.
Health inspection performance runs 29.3% below Michigan average; the weaker component of the overall rating, which stands 4.4% below state average. Quality measures rank 33% above state average, and staffing rates 14.4% above. In 2023, CMS imposed a single $16,000 civil money penalty for regulatory violation; zero payment denials have been assessed.
High-risk clinical events score 4.7, 44% better than Michigan average; and functional decline score 8.4, 49% better than state baseline. Residents record below-average rates of falls with injury, pressure ulcers, weight loss, and depression. Infection control and antipsychotic restraint show less favorable profiles. Vaccination rates are generally strong, though pneumococcal vaccine uptake lags state average.
Current occupancy is 40.8% and substantially below the Michigan average of 75.8%; housing 87 of 179 licensed beds. Resident census breaks down as 57.5% Medicaid, 31% Medicare, 11.5% private pay. The facility has operated at a significant operating deficit since 2020.
Beaumont Commons serves long-term nursing care candidates, particularly Medicaid-eligible residents. Strong clinical and functional preservation metrics offset lower census and recent federal penalty, though financial pressures and health inspection concerns temper the overall profile.
| Staff type | Hours / Day / Resident | vs state avg |
|---|---|---|
|
Registered Nurse (RN)
| 1h 4m per day | ▲ 40% State avg: 46m per day · National avg: 41m per day |
|
LPN / LVN
| 1h 10m per day | ▲ 32% State avg: 53m per day · National avg: 52m per day |
|
Nurse Aide
| 2h 28m per day | ▲ 6% State avg: 2h 20m per day · National avg: 2h 20m per day |
|
Weekend Total Nursing
| 3h 55m per day | ▲ 12% State avg: 3h 31m per day · National avg: 3h 27m per day |
|
Physical Therapist
| 10m per day | ▲ 146% State avg: 4m per day · National avg: 4m per day |
|
Weekend RN
| 31m per day | ▲ 7% State avg: 29m per day · National avg: 29m per day |
Reporting period: October 1 – December 31, 2025 (Q4 2025). Source: CMS Payroll-Based Journal report.
Manages medical care and health needs.
Assists with medical care and medications.
Helps with daily care and mobility.
Total hours from contractors
9,512 contractor hours this quarter
| Certified Nursing Assistant | 60 | 15 | 75 | 22,789 | 92 | 100% | 7.8 |
| Licensed Practical Nurse | 38 | 0 | 38 | 9,771 | 92 | 100% | 8.3 |
| Registered Nurse | 19 | 1 | 20 | 6,431 | 92 | 100% | 8.5 |
| Clinical Nurse Specialist | 7 | 0 | 7 | 2,953 | 80 | 87% | 8.1 |
| Other Dietary Services Staff | 3 | 0 | 3 | 1,602 | 88 | 96% | 8.4 |
| Respiratory Therapy Technician | 0 | 8 | 8 | 1,566 | 76 | 83% | 5.9 |
| Mental Health Service Worker | 2 | 2 | 4 | 1,295 | 69 | 75% | 8 |
| RN Director of Nursing | 2 | 0 | 2 | 1,047 | 66 | 72% | 8.7 |
| Physical Therapy Assistant | 0 | 5 | 5 | 869 | 73 | 79% | 6.8 |
| Nurse Practitioner | 1 | 0 | 1 | 528 | 66 | 72% | 8 |
| Physical Therapy Aide | 0 | 4 | 4 | 525 | 73 | 79% | 5.9 |
| Administrator | 1 | 0 | 1 | 456 | 57 | 62% | 8 |
| Dietitian | 1 | 0 | 1 | 452 | 57 | 62% | 7.9 |
| Occupational Therapy Aide | 0 | 1 | 1 | 440 | 55 | 60% | 8 |
| Occupational Therapy Assistant | 0 | 1 | 1 | 56 | 6 | 7% | 9.4 |
| Qualified Social Worker | 0 | 1 | 1 | 50 | 13 | 14% | 3.9 |
| Speech Language Pathologist | 0 | 1 | 1 | 44 | 15 | 16% | 2.9 |
| Medical Director | 0 | 1 | 1 | 30 | 3 | 3% | 10 |
Includes penalties issued in 2023
Federal penalties imposed by CMS for regulatory violations, including civil money penalties (fines) and denials of payment for new Medicare/Medicaid admissions.
Source: CMS Penalties Database (Data as of Jan 2026)
Michigan average: $76K
Michigan average: 2.0
Michigan average: 0.8
Penalties are imposed by CMS for violations of federal nursing home regulations.
1 penalty in the past 3 years
Aug 24, 2023 · $16K
Last updated: Jan 2026
These measures show how residents usually do over time at this home, based on health outcomes and preventive care.
Michigan average: 8.4
Michigan average: 16.3
Michigan average: 12.5%
Michigan average: 15.3%
Michigan average: 21.0%
Michigan average: 3.2%
Michigan average: 5.7%
Michigan average: 1.7%
Michigan average: 5.7%
Michigan average: 3.9%
Michigan average: 15.0%
Michigan average: 94.9%
Michigan average: 95.0%
Michigan average: 82.5%
Michigan average: 1.4%
Michigan average: 79.5%
Quality measures are calculated from Minimum Data Set (MDS) assessments. For most measures, lower percentages indicate better care quality.
40% of new residents, usually for short-term rehab.
50% of new residents, often for short stays.
10% of new residents, often for long-term daily care.
Source: CMS Long-Term Care Facility Characteristics (Data as of Jan 2026)
Residents meet regularly to discuss policies, care quality, and activities
Organized group of residents that meets regularly to discuss facility policies, quality of life, and activities.
Data sourced from CMS Long-Term Care Facility Characteristics quarterly report. Payer mix reflects the current resident census by primary payment source.
Historical financial and operational data for Beaumont Commons – Farmington Hills based on CMS SNF Cost Reports.
Pets Allowed
Housing Options: 1 Bed / 2 Bed
Building Type: 3-story
Housekeeping Services
Social and Recreational Activities
This home supports both short-term rehab and long-term care, with residents staying for a wide range of durations.
![]() 4.4 miles from city center
4.4 miles from city center
![]() Estimated distance in miles from Farmington Hills's city center to Beaumont Commons – Farmington Hills's address, calculated via Google Maps.
Estimated distance in miles from Farmington Hills's city center to Beaumont Commons – Farmington Hills's address, calculated via Google Maps.
Add your location
Beaumont Commons – Farmington Hills is located in Farmington Hills, Michigan.
Here are the financial assistance programs available to residents in Michigan.
Beaumont Commons – Farmington Hills is in the Botsford Commons Senior Community neighborhood.
Beaumont Commons – Farmington Hills has a walk score of 24. Car-dependent. Most errands require a car, with limited nearby walkable options.
Yes — there are 4 photos of Beaumont Commons – Farmington Hills in the photo gallery on this page.
Beaumont Commons – Farmington Hills is located at 21450 Archwood Cir, Farmington Hills, MI 48336, United States.
(248) 477-7400 will put you in contact with the team at Beaumont Commons – Farmington Hills.
Yes — Beaumont Commons – Farmington Hills is a CMS-certified provider of Medicare and Medicaid.
Care Cost Calculator: See Prices in Your Area
Nursing Home Data Explorer
Don’t Wait Too Long: 7 Red Flag Signs Your Parent Needs Assisted Living Now
The True Cost of Assisted Living in 2025 – And How Families Are Paying For It
Understanding Senior Living Costs: Pricing Models, Discounts & Financial Assistance


Thank you for your interest!
Our team will be in touch shortly to help with next steps.
