


Total staff
307
Employees
277
Contractors
30
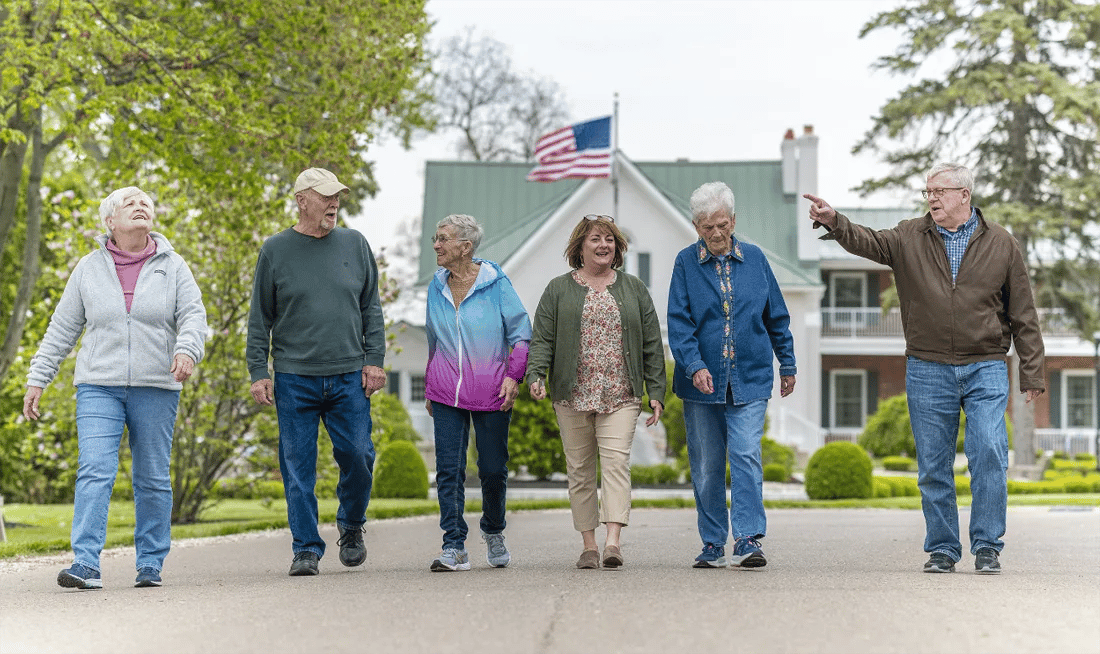

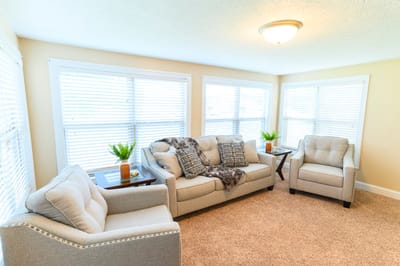
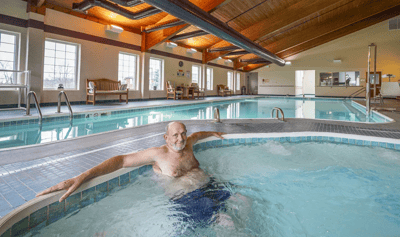


In our village-style life plan community, gracious public spaces complement well-designed private senior living residences, including apartments, cottages, and villas. We are a Level I Arboretum with walking trails, yet we have easy freeway access to the “big city” of Columbus and an international airport.
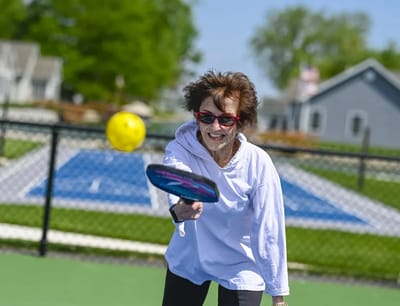
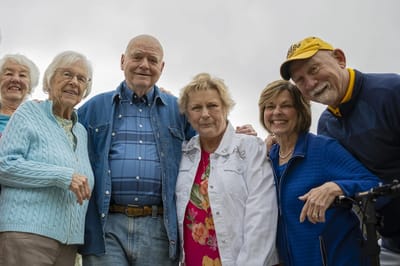
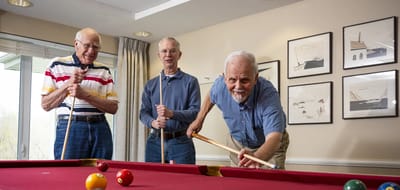
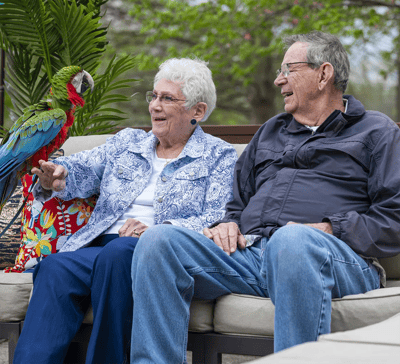
We make space for the gregarious and the contemplative. Residents can be as active or as quiet as they prefer, because there is no one right way to live. Freedom is an important concept at Otterbein Granville. Our residents’ fresh ideas thrive in familiar, supportive surroundings. Resident-directed activities and life-enhancing friendships enrich community life. The design supports a range of individual lifestyles, promotes community interaction, and optimizes mobility for people with a variety of physical capabilities. Many residents are lifelong learners who audit classes; attend concerts, plays and lectures; and volunteer throughout central Ohio in a variety of settings.
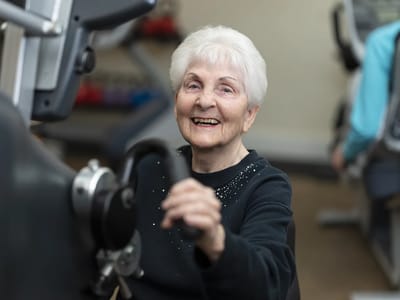
A comprehensive health care program is offered on campus, with health and wellness programs, physician services, therapies, assisted living, skilled nursing, memory support and long-term nursing care.
| Staff type | Hours / Day / Resident | vs state avg |
|---|---|---|
|
Registered Nurse (RN)
| 35m per day | |
|
LPN / LVN
| 1h 3m per day | |
|
Nurse Aide
| 2h 31m per day | |
|
Weekend Total Nursing
| 3h 52m per day | |
|
Physical Therapist
| 3m per day | |
|
Weekend RN
| 26m per day |
Reporting period: October 1 – December 31, 2025 (Q4 2025). Source: CMS Payroll-Based Journal report.
State average ratio: 0 : 0
State average: 0 hours
Manages medical care and health needs.
Assists with medical care and medications.
Helps with daily care and mobility.
Total hours from contractors
4,417 contractor hours this quarter
| Certified Nursing Assistant | 143 | 0 | 143 | 31,406 | 92 | 100% | 8 |
| Licensed Practical Nurse | 84 | 0 | 84 | 12,997 | 92 | 100% | 8.6 |
| Registered Nurse | 28 | 0 | 28 | 4,721 | 92 | 100% | 7.9 |
| Clinical Nurse Specialist | 6 | 0 | 6 | 2,280 | 65 | 71% | 8 |
| Speech Language Pathologist | 0 | 10 | 10 | 1,110 | 80 | 87% | 4.7 |
| Administrator | 2 | 0 | 2 | 1,056 | 66 | 72% | 8 |
| Physical Therapy Aide | 0 | 6 | 6 | 979 | 78 | 85% | 6.1 |
| Qualified Social Worker | 0 | 4 | 4 | 976 | 66 | 72% | 7.1 |
| Other Dietary Services Staff | 3 | 0 | 3 | 910 | 63 | 68% | 7.9 |
| Medication Aide/Technician | 7 | 0 | 7 | 817 | 67 | 73% | 7.8 |
| Physical Therapy Assistant | 0 | 3 | 3 | 653 | 73 | 79% | 5.6 |
| Respiratory Therapy Technician | 0 | 3 | 3 | 576 | 81 | 88% | 4.5 |
| Dental Services Staff | 1 | 0 | 1 | 480 | 58 | 63% | 8.3 |
| Nurse Practitioner | 1 | 0 | 1 | 480 | 60 | 65% | 8 |
| RN Director of Nursing | 1 | 0 | 1 | 464 | 58 | 63% | 8 |
| Mental Health Service Worker | 1 | 0 | 1 | 329 | 44 | 48% | 7.5 |
| Occupational Therapy Assistant | 0 | 1 | 1 | 67 | 11 | 12% | 6.1 |
| Medical Director | 0 | 2 | 2 | 30 | 6 | 7% | 5 |
| Occupational Therapy Aide | 0 | 1 | 1 | 27 | 4 | 4% | 6.8 |
Federal penalties imposed by CMS for regulatory violations, including civil money penalties (fines) and denials of payment for new Medicare/Medicaid admissions.
Source: CMS Penalties Database
No penalties in the past 3 years
No civil money penalties or payment denials were reported in the last 3 years.
These measures show how residents usually do over time at this home, based on health outcomes and preventive care.
State average: 5.8
State average: 12.7
State average: 6.8%
State average: 8.9%
State average: 22.0%
State average: 3.4%
State average: 3.9%
State average: 0.5%
State average: 6.2%
State average: 24.0%
State average: 8.4%
State average: 92.4%
State average: 94.5%
State average: 78.0%
State average: 1.3%
State average: 75.6%
Quality measures are calculated from Minimum Data Set (MDS) assessments. For most measures, lower percentages indicate better care quality.
29% of new residents, usually for short-term rehab.
67% of new residents, often for short stays.
5% of new residents, often for long-term daily care.
Source: CMS Long-Term Care Facility Characteristics (Data as of Jan 2026)
Residents meet regularly to discuss policies, care quality, and activities
Part of a Continuing Care Retirement Community offering multiple care levels
Organized group of residents that meets regularly to discuss facility policies, quality of life, and activities.
Data sourced from CMS Long-Term Care Facility Characteristics quarterly report. Payer mix reflects the current resident census by primary payment source.
Historical financial and operational data for Otterbein SeniorLife from 2011–2023, based on CMS SNF Cost Reports.
Based on CMS SNF Cost Report for fiscal year ending in 12/2023.
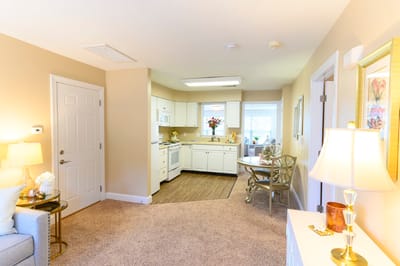
Housing Options: Studio / 1 Bed / 2 Bed / 3 Bed
Building Type: Single-story
Beauty Services
Transportation Services
Housekeeping Services
Social and Recreational Activities
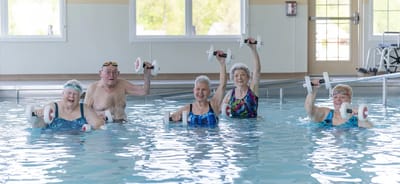
Exercise Programs
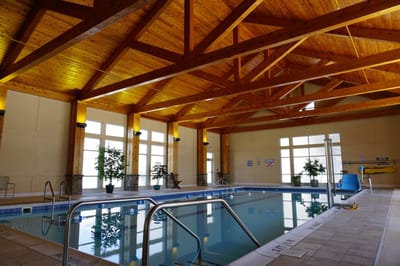
Swimming Pool
Residents typically stay for brief periods, with frequent admissions and discharges throughout the year.
Most new residents arrive under private pay (67% of admissions), and a typical private pay stay runs around 3 - 4 months.
Coverage residents most often arrive under.
Coverage residents most often leave under.
![]() 4.7 miles from city center
4.7 miles from city center
![]() Estimated distance in miles from Lebanon's city center to Otterbein SeniorLife's address, calculated via Google Maps.
Estimated distance in miles from Lebanon's city center to Otterbein SeniorLife's address, calculated via Google Maps.
Add your location
The information below is reported by the Ohio Department of Health, Bureau of Survey and Certification.
| Otterbein SeniorLife | NH AL HC IL MC NC | Lebanon | - | 154 | - | 0 | Studio / 1 Bed / 2 Bed / 3 Bed |
| Beachwood Commons by New Perspective | NH AL IL MC | Beachwood | - | 120 | A+ | 15 | Studio / 1 Bed |
| Brookdale Westlake Village | NH AL IL MC | Westlake | - | 60 | A+ | 25 | 1 Bed / 2 Bed |
| Elizabeth Scott Community | NH AL MC | Maumee | - | 60 | A+ | 0 | Studio / 1 Bed |
| Genoa Retirement Village | NH AL IL MC | Genoa | - | 68 | A+ | 17 | Studio / 1 Bed / 2 Bed |
Otterbein SeniorLife's occupancy is 91.4%.
Otterbein SeniorLife is registered as a non-profit.
Yes — there are 21 photos of Otterbein SeniorLife in the photo gallery on this page.
Otterbein SeniorLife is located at 3855 Lower Market St Suite 300, Lebanon, OH 45036.
(330) 638-2420 will put you in contact with the team at Otterbein SeniorLife.
Yes — Otterbein SeniorLife is a CMS-certified provider of Medicare and Medicaid.
Care Cost Calculator: See Prices in Your Area
Nursing Home Data Explorer
Don’t Wait Too Long: 7 Red Flag Signs Your Parent Needs Assisted Living Now
The True Cost of Assisted Living in 2025 – And How Families Are Paying For It
Understanding Senior Living Costs: Pricing Models, Discounts & Financial Assistance


